
|
|||||
|
 | |
| |
| |
| |
| |
| |
|
Gene: MARCO |
Gene summary for MARCO |
| Gene information | Species | Human | Gene symbol | MARCO | Gene ID | 8685 |
| Gene name | macrophage receptor with collagenous structure | |
| Gene Alias | SCARA2 | |
| Cytomap | 2q14.2 | |
| Gene Type | protein-coding | GO ID | GO:0000165 | UniProtAcc | Q4ZG40 |
Top |
Malignant transformation analysis |
| Identification of the aberrant gene expression in precancerous and cancerous lesions by comparing the gene expression of stem-like cells in diseased tissues with normal stem cells |
| Entrez ID | Symbol | Replicates | Species | Organ | Tissue | Adj P-value | Log2FC | Malignancy |
| 8685 | MARCO | C21 | Human | Oral cavity | OSCC | 1.31e-06 | 2.73e-01 | 0.2678 |
| 8685 | MARCO | C46 | Human | Oral cavity | OSCC | 1.22e-29 | 9.08e-01 | 0.1673 |
| 8685 | MARCO | LN46 | Human | Oral cavity | OSCC | 8.91e-32 | 1.27e+00 | 0.1666 |
| 8685 | MARCO | ATC2 | Human | Thyroid | ATC | 2.49e-06 | 8.52e-01 | 0.34 |
| Page: 1 |
| Tissue | Expression Dynamics | Abbreviation |
| Oral Cavity | 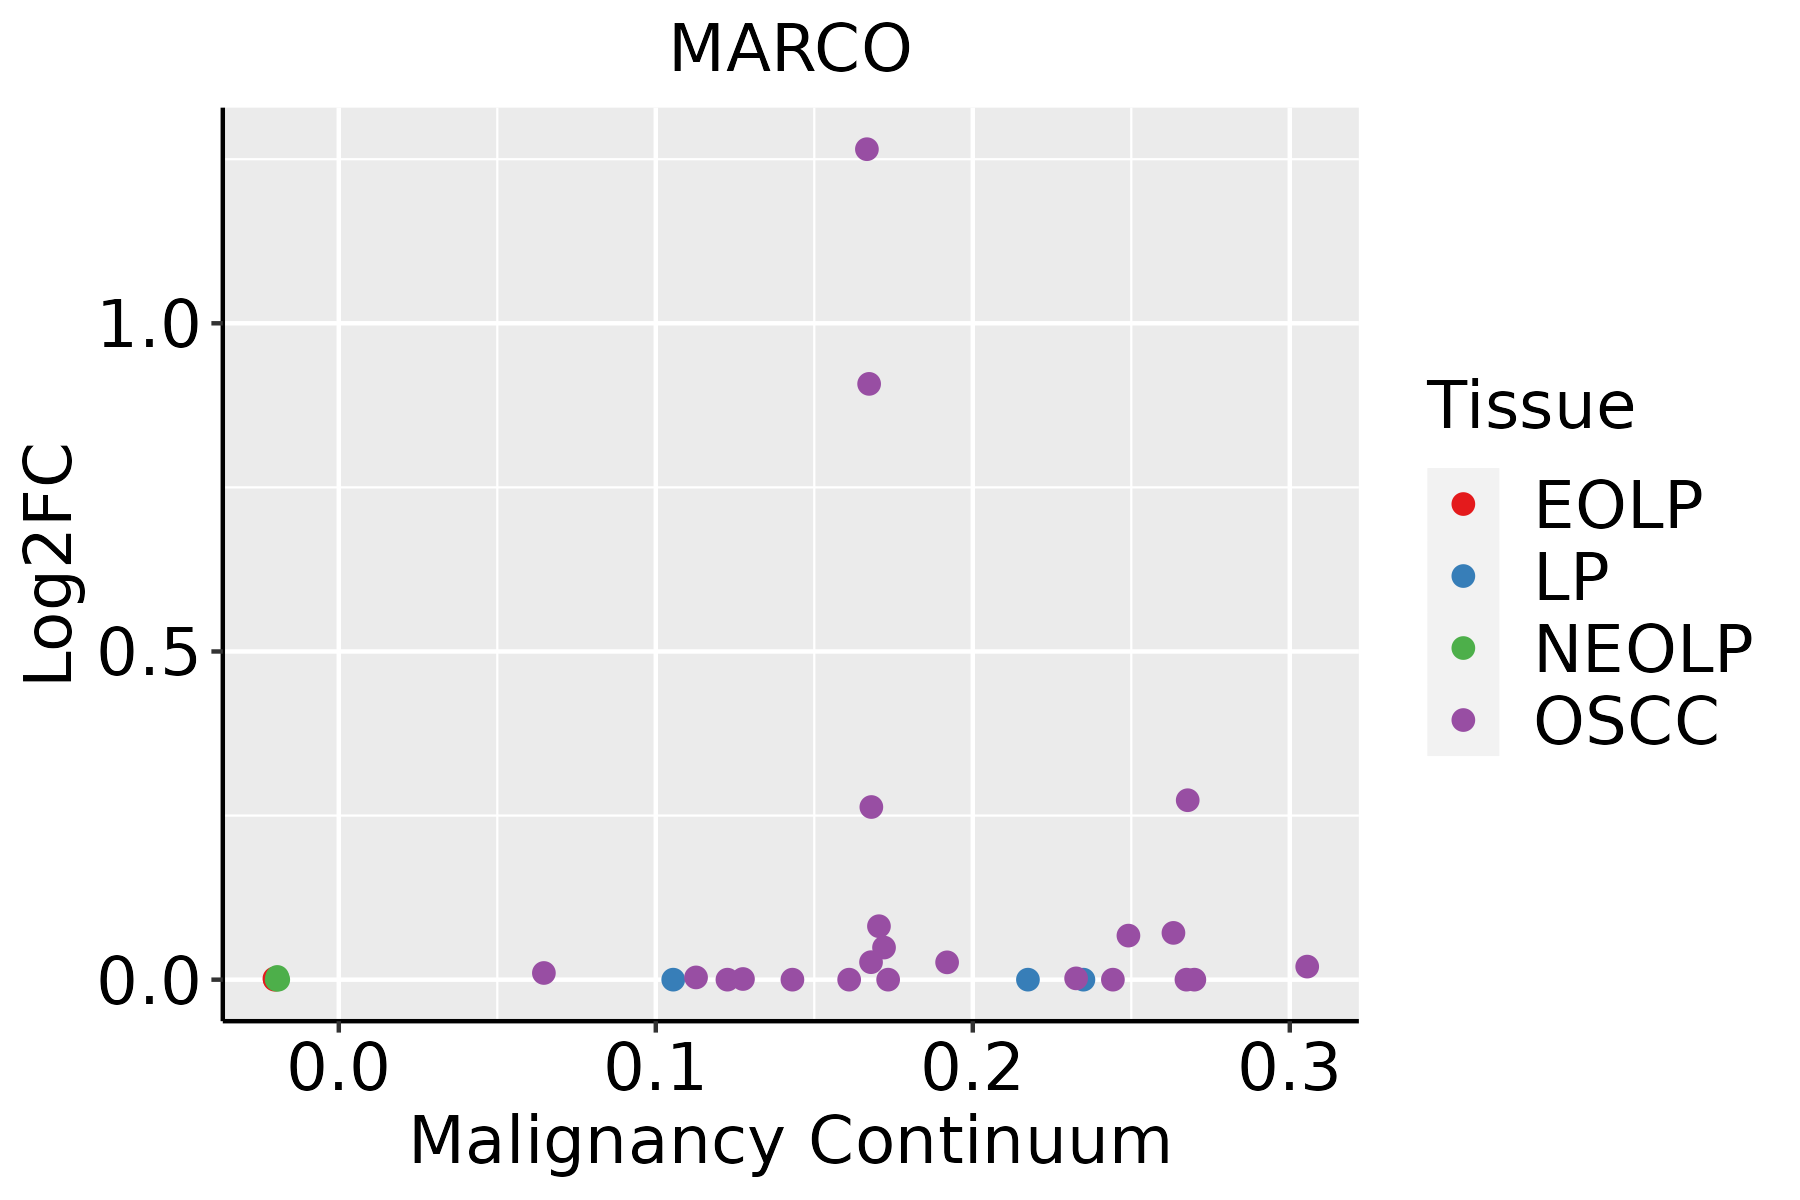 | EOLP: Erosive Oral lichen planus |
| LP: leukoplakia | ||
| NEOLP: Non-erosive oral lichen planus | ||
| OSCC: Oral squamous cell carcinoma | ||
| Thyroid |  | ATC: Anaplastic thyroid cancer |
| HT: Hashimoto's thyroiditis | ||
| PTC: Papillary thyroid cancer |
| ∗log2FC in expression of this searched gene in stem-like cells from each diseased tissue sample relative to stem-like cells in normal samples in each tissue plotted against the malignancy continuum. Samples are colored based on if they are from different disease stage. |
Top |
Malignant transformation related pathway analysis |
| Find out the enriched GO biological processes and KEGG pathways involved in transition from healthy to precancer to cancer |
| Tissue | Disease Stage | Enriched GO biological Processes |
| Colorectum | AD |  |
| Colorectum | SER |  |
| Colorectum | MSS |  |
| Colorectum | MSI-H |  |
| Colorectum | FAP |  |
| ∗Top 15 enriched GO BP terms are showed in the bar plot of each disease state in each tissue. Each row represents a significant GO biological process which is colored according to the -log10(p.adjust). |
| Page: 1 2 3 4 5 6 7 8 9 |
| GO ID | Tissue | Disease Stage | Description | Gene Ratio | Bg Ratio | pvalue | p.adjust | Count |
| GO:000689810 | Oral cavity | OSCC | receptor-mediated endocytosis | 125/7305 | 244/18723 | 6.56e-05 | 5.32e-04 | 125 |
| GO:00972424 | Oral cavity | OSCC | amyloid-beta clearance | 24/7305 | 38/18723 | 2.21e-03 | 1.00e-02 | 24 |
| GO:00434107 | Oral cavity | OSCC | positive regulation of MAPK cascade | 213/7305 | 480/18723 | 8.71e-03 | 3.16e-02 | 213 |
| GO:00703716 | Oral cavity | OSCC | ERK1 and ERK2 cascade | 150/7305 | 330/18723 | 9.47e-03 | 3.38e-02 | 150 |
| GO:00703724 | Oral cavity | OSCC | regulation of ERK1 and ERK2 cascade | 140/7305 | 309/18723 | 1.34e-02 | 4.46e-02 | 140 |
| GO:000689826 | Thyroid | ATC | receptor-mediated endocytosis | 118/6293 | 244/18723 | 1.17e-06 | 1.50e-05 | 118 |
| GO:009724221 | Thyroid | ATC | amyloid-beta clearance | 23/6293 | 38/18723 | 6.05e-04 | 3.44e-03 | 23 |
| Page: 1 |
| Pathway ID | Tissue | Disease Stage | Description | Gene Ratio | Bg Ratio | pvalue | p.adjust | qvalue | Count |
| hsa0414528 | Oral cavity | OSCC | Phagosome | 88/3704 | 152/8465 | 2.83e-04 | 9.13e-04 | 4.65e-04 | 88 |
| hsa04145113 | Oral cavity | OSCC | Phagosome | 88/3704 | 152/8465 | 2.83e-04 | 9.13e-04 | 4.65e-04 | 88 |
| Page: 1 |
Top |
Cell-cell communication analysis |
| Identification of potential cell-cell interactions between two cell types and their ligand-receptor pairs for different disease states |
| Ligand | Receptor | LRpair | Pathway | Tissue | Disease Stage |
| SCGB3A2 | MARCO | SCGB3A2_MARCO | UGRP1 | Lung | AAH |
| SCGB3A2 | MARCO | SCGB3A2_MARCO | UGRP1 | Lung | AIS |
| SCGB3A2 | MARCO | SCGB3A2_MARCO | UGRP1 | Lung | Healthy |
| SCGB3A2 | MARCO | SCGB3A2_MARCO | UGRP1 | Lung | MIAC |
| SCGB3A2 | MARCO | SCGB3A2_MARCO | UGRP1 | Lung | Precancer |
| Page: 1 |
Top |
Single-cell gene regulatory network inference analysis |
| Find out the significant the regulons (TFs) and the target genes of each regulon across cell types for different disease states |
| TF | Cell Type | Tissue | Disease Stage | Target Gene | RSS | Regulon Activity |
| ∗The dot plots of a searched regulon are shown for all cell subpopulations in each disease state of each tissue based on the regulon specific score inferred using pySCENIC and by calculating the average expression. |
| Page: 1 |
Top |
Somatic mutation of malignant transformation related genes |
| Annotation of somatic variants for genes involved in malignant transformation |
| Hugo Symbol | Variant Class | Variant Classification | dbSNP RS | HGVSc | HGVSp | HGVSp Short | SWISSPROT | BIOTYPE | SIFT | PolyPhen | Tumor Sample Barcode | Tissue | Histology | Sex | Age | Stage | Therapy Types | Drugs | Outcome |
| MARCO | SNV | Missense_Mutation | novel | c.454N>T | p.Ala152Ser | p.A152S | Q9UEW3 | protein_coding | tolerated(0.59) | benign(0.01) | TCGA-A2-A25A-01 | Breast | breast invasive carcinoma | Female | <65 | I/II | Unspecific | Cytoxan | SD |
| MARCO | SNV | Missense_Mutation | rs371994323 | c.1466N>A | p.Arg489Gln | p.R489Q | Q9UEW3 | protein_coding | tolerated(0.54) | benign(0.409) | TCGA-D8-A1XQ-01 | Breast | breast invasive carcinoma | Female | >=65 | I/II | Unknown | Unknown | SD |
| MARCO | SNV | Missense_Mutation | c.1387C>A | p.Leu463Met | p.L463M | Q9UEW3 | protein_coding | tolerated(0.06) | probably_damaging(0.995) | TCGA-EW-A1J3-01 | Breast | breast invasive carcinoma | Female | <65 | I/II | Chemotherapy | carboplatin | SD | |
| MARCO | SNV | Missense_Mutation | c.515N>A | p.Gly172Glu | p.G172E | Q9UEW3 | protein_coding | deleterious(0.01) | possibly_damaging(0.874) | TCGA-DR-A0ZM-01 | Cervix | cervical & endocervical cancer | Female | <65 | III/IV | Unspecific | Cisplatin | SD | |
| MARCO | SNV | Missense_Mutation | c.1293N>A | p.Asn431Lys | p.N431K | Q9UEW3 | protein_coding | tolerated(0.4) | possibly_damaging(0.849) | TCGA-AA-3664-01 | Colorectum | colon adenocarcinoma | Female | >=65 | I/II | Unknown | Unknown | SD | |
| MARCO | SNV | Missense_Mutation | c.1427C>T | p.Ala476Val | p.A476V | Q9UEW3 | protein_coding | deleterious(0.02) | possibly_damaging(0.557) | TCGA-AA-3710-01 | Colorectum | colon adenocarcinoma | Female | >=65 | I/II | Unknown | Unknown | SD | |
| MARCO | SNV | Missense_Mutation | rs200590124 | c.1558G>A | p.Val520Ile | p.V520I | Q9UEW3 | protein_coding | tolerated_low_confidence(0.84) | benign(0.198) | TCGA-AA-3833-01 | Colorectum | colon adenocarcinoma | Female | <65 | I/II | Unknown | Unknown | SD |
| MARCO | SNV | Missense_Mutation | rs554794950 | c.31G>A | p.Glu11Lys | p.E11K | Q9UEW3 | protein_coding | tolerated(0.42) | benign(0.013) | TCGA-AA-3864-01 | Colorectum | colon adenocarcinoma | Male | >=65 | I/II | Unknown | Unknown | SD |
| MARCO | SNV | Missense_Mutation | c.605N>C | p.Gly202Ala | p.G202A | Q9UEW3 | protein_coding | deleterious(0) | probably_damaging(0.999) | TCGA-AA-3866-01 | Colorectum | colon adenocarcinoma | Female | >=65 | I/II | Unknown | Unknown | SD | |
| MARCO | SNV | Missense_Mutation | novel | c.875N>A | p.Gly292Asp | p.G292D | Q9UEW3 | protein_coding | deleterious(0) | probably_damaging(1) | TCGA-AA-3870-01 | Colorectum | colon adenocarcinoma | Female | >=65 | III/IV | Chemotherapy | folinic | CR |
| Page: 1 2 3 4 5 6 7 8 9 |
Top |
Related drugs of malignant transformation related genes |
| Identification of chemicals and drugs interact with genes involved in malignant transfromation |
| (DGIdb 4.0) |
| Entrez ID | Symbol | Category | Interaction Types | Drug Claim Name | Drug Name | PMIDs |
| Page: 1 |

Copyright 2023-Present -The University of Texas Health Science Center at Houston |