
|
|||||
|
 | |
| |
| |
| |
| |
| |
|
Gene: MARCKS |
Gene summary for MARCKS |
| Gene information | Species | Human | Gene symbol | MARCKS | Gene ID | 4082 |
| Gene name | myristoylated alanine rich protein kinase C substrate | |
| Gene Alias | 80K-L | |
| Cytomap | 6q21 | |
| Gene Type | protein-coding | GO ID | GO:0006996 | UniProtAcc | P29966 |
Top |
Malignant transformation analysis |
| Identification of the aberrant gene expression in precancerous and cancerous lesions by comparing the gene expression of stem-like cells in diseased tissues with normal stem cells |
| Entrez ID | Symbol | Replicates | Species | Organ | Tissue | Adj P-value | Log2FC | Malignancy |
| 4082 | MARCKS | GSM4909286 | Human | Breast | IDC | 3.54e-06 | -2.31e-01 | 0.1081 |
| 4082 | MARCKS | GSM4909289 | Human | Breast | IDC | 3.64e-03 | 4.75e-01 | 0.1064 |
| 4082 | MARCKS | GSM4909290 | Human | Breast | IDC | 2.21e-04 | 2.81e-01 | 0.2096 |
| 4082 | MARCKS | GSM4909291 | Human | Breast | IDC | 1.14e-13 | -5.90e-01 | 0.1753 |
| 4082 | MARCKS | GSM4909294 | Human | Breast | IDC | 2.07e-02 | 1.16e-01 | 0.2022 |
| 4082 | MARCKS | GSM4909296 | Human | Breast | IDC | 6.40e-26 | -5.66e-01 | 0.1524 |
| 4082 | MARCKS | GSM4909297 | Human | Breast | IDC | 1.53e-16 | -1.35e-01 | 0.1517 |
| 4082 | MARCKS | GSM4909298 | Human | Breast | IDC | 2.54e-19 | -5.49e-01 | 0.1551 |
| 4082 | MARCKS | GSM4909301 | Human | Breast | IDC | 6.97e-05 | -2.33e-01 | 0.1577 |
| 4082 | MARCKS | GSM4909302 | Human | Breast | IDC | 2.45e-18 | -5.50e-01 | 0.1545 |
| 4082 | MARCKS | GSM4909304 | Human | Breast | IDC | 2.43e-30 | -6.12e-01 | 0.1636 |
| 4082 | MARCKS | GSM4909306 | Human | Breast | IDC | 1.04e-21 | -5.67e-01 | 0.1564 |
| 4082 | MARCKS | GSM4909307 | Human | Breast | IDC | 1.05e-25 | -6.03e-01 | 0.1569 |
| 4082 | MARCKS | GSM4909308 | Human | Breast | IDC | 1.22e-21 | -6.06e-01 | 0.158 |
| 4082 | MARCKS | GSM4909309 | Human | Breast | IDC | 9.19e-05 | -1.47e-01 | 0.0483 |
| 4082 | MARCKS | GSM4909311 | Human | Breast | IDC | 2.70e-37 | -6.56e-01 | 0.1534 |
| 4082 | MARCKS | GSM4909312 | Human | Breast | IDC | 2.67e-42 | -6.63e-01 | 0.1552 |
| 4082 | MARCKS | GSM4909315 | Human | Breast | IDC | 8.72e-05 | -3.12e-01 | 0.21 |
| 4082 | MARCKS | GSM4909319 | Human | Breast | IDC | 2.21e-38 | -6.47e-01 | 0.1563 |
| 4082 | MARCKS | GSM4909320 | Human | Breast | IDC | 8.64e-09 | -5.43e-01 | 0.1575 |
| Page: 1 2 3 4 5 6 7 8 9 10 11 12 |
| Tissue | Expression Dynamics | Abbreviation |
| Breast | 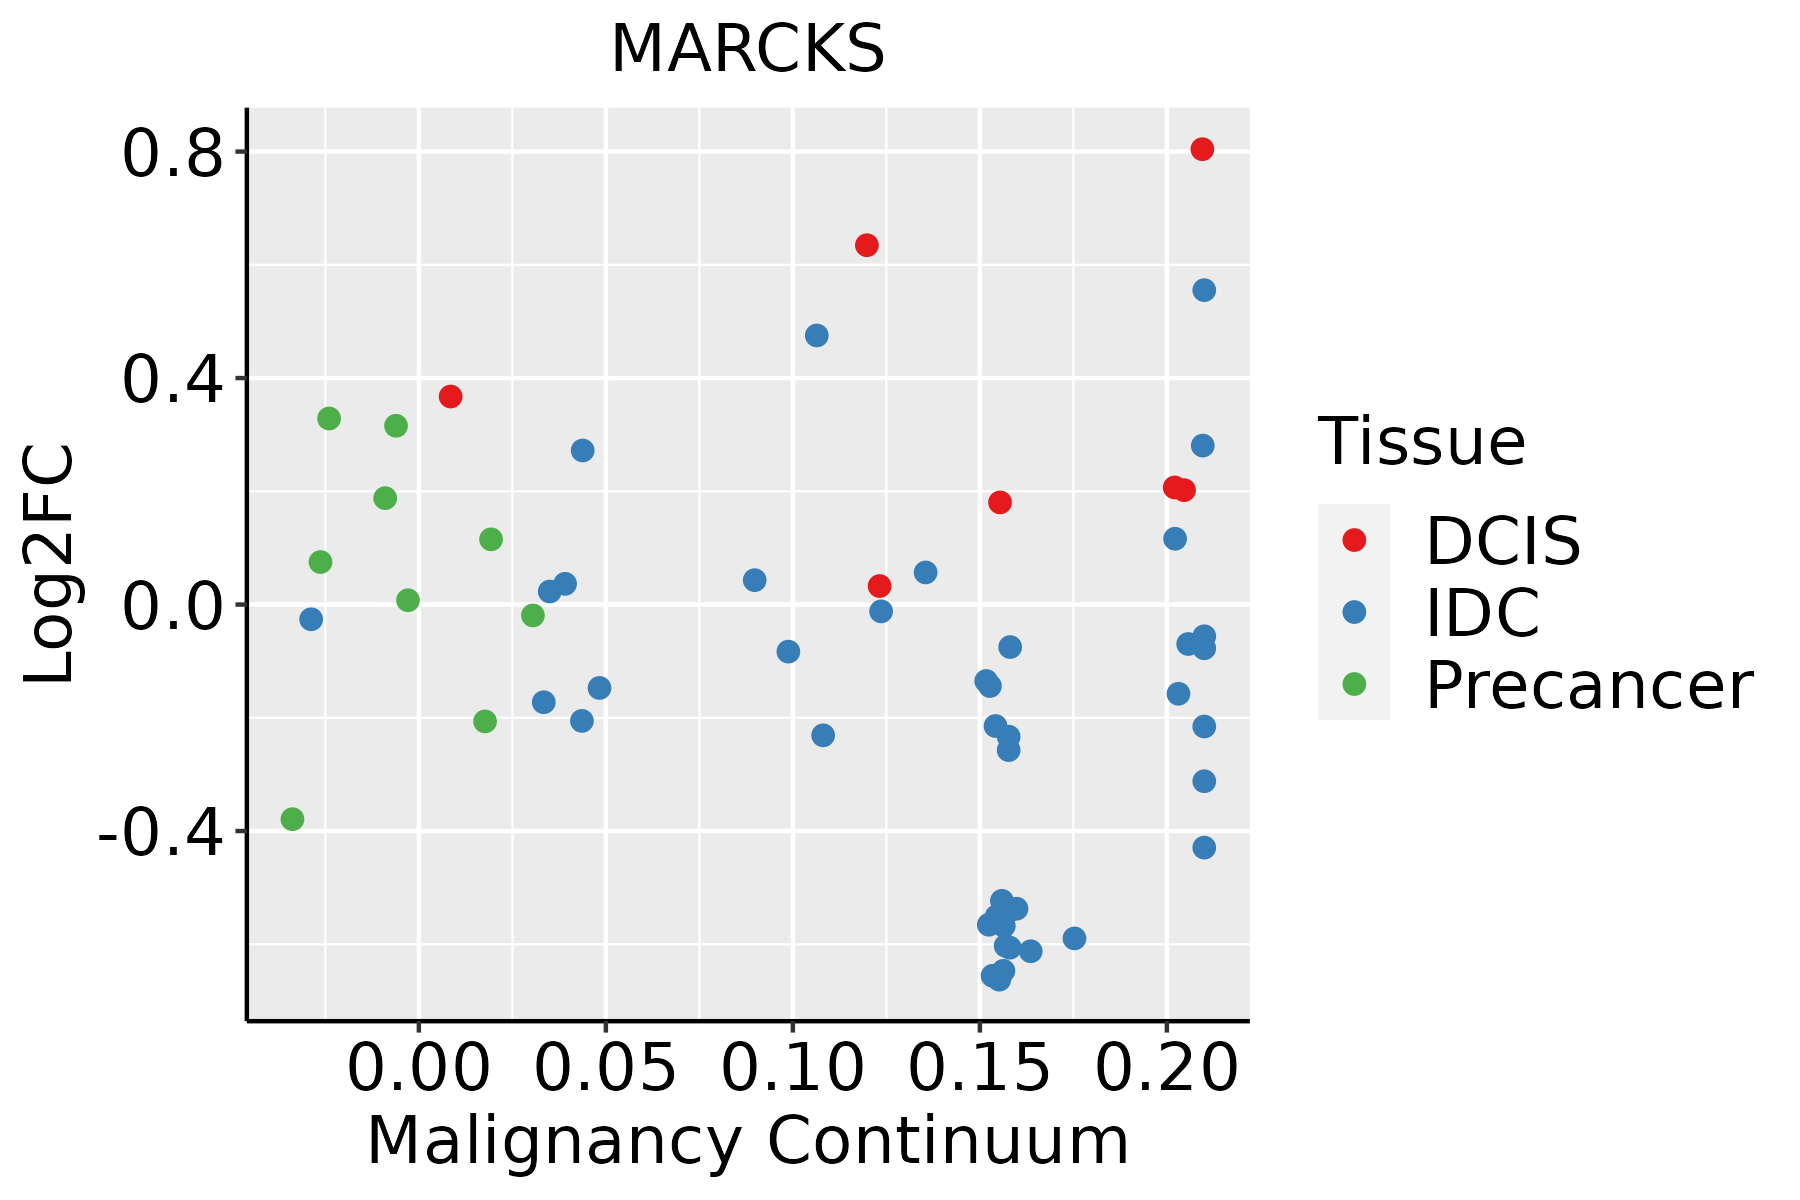 | IDC: Invasive ductal carcinoma |
| DCIS: Ductal carcinoma in situ | ||
| Precancer(BRCA1-mut): Precancerous lesion from BRCA1 mutation carriers | ||
| Cervix |  | CC: Cervix cancer |
| HSIL_HPV: HPV-infected high-grade squamous intraepithelial lesions | ||
| N_HPV: HPV-infected normal cervix | ||
| Colorectum (GSE201348) |  | FAP: Familial adenomatous polyposis |
| CRC: Colorectal cancer | ||
| Colorectum (HTA11) |  | AD: Adenomas |
| SER: Sessile serrated lesions | ||
| MSI-H: Microsatellite-high colorectal cancer | ||
| MSS: Microsatellite stable colorectal cancer | ||
| Endometrium | 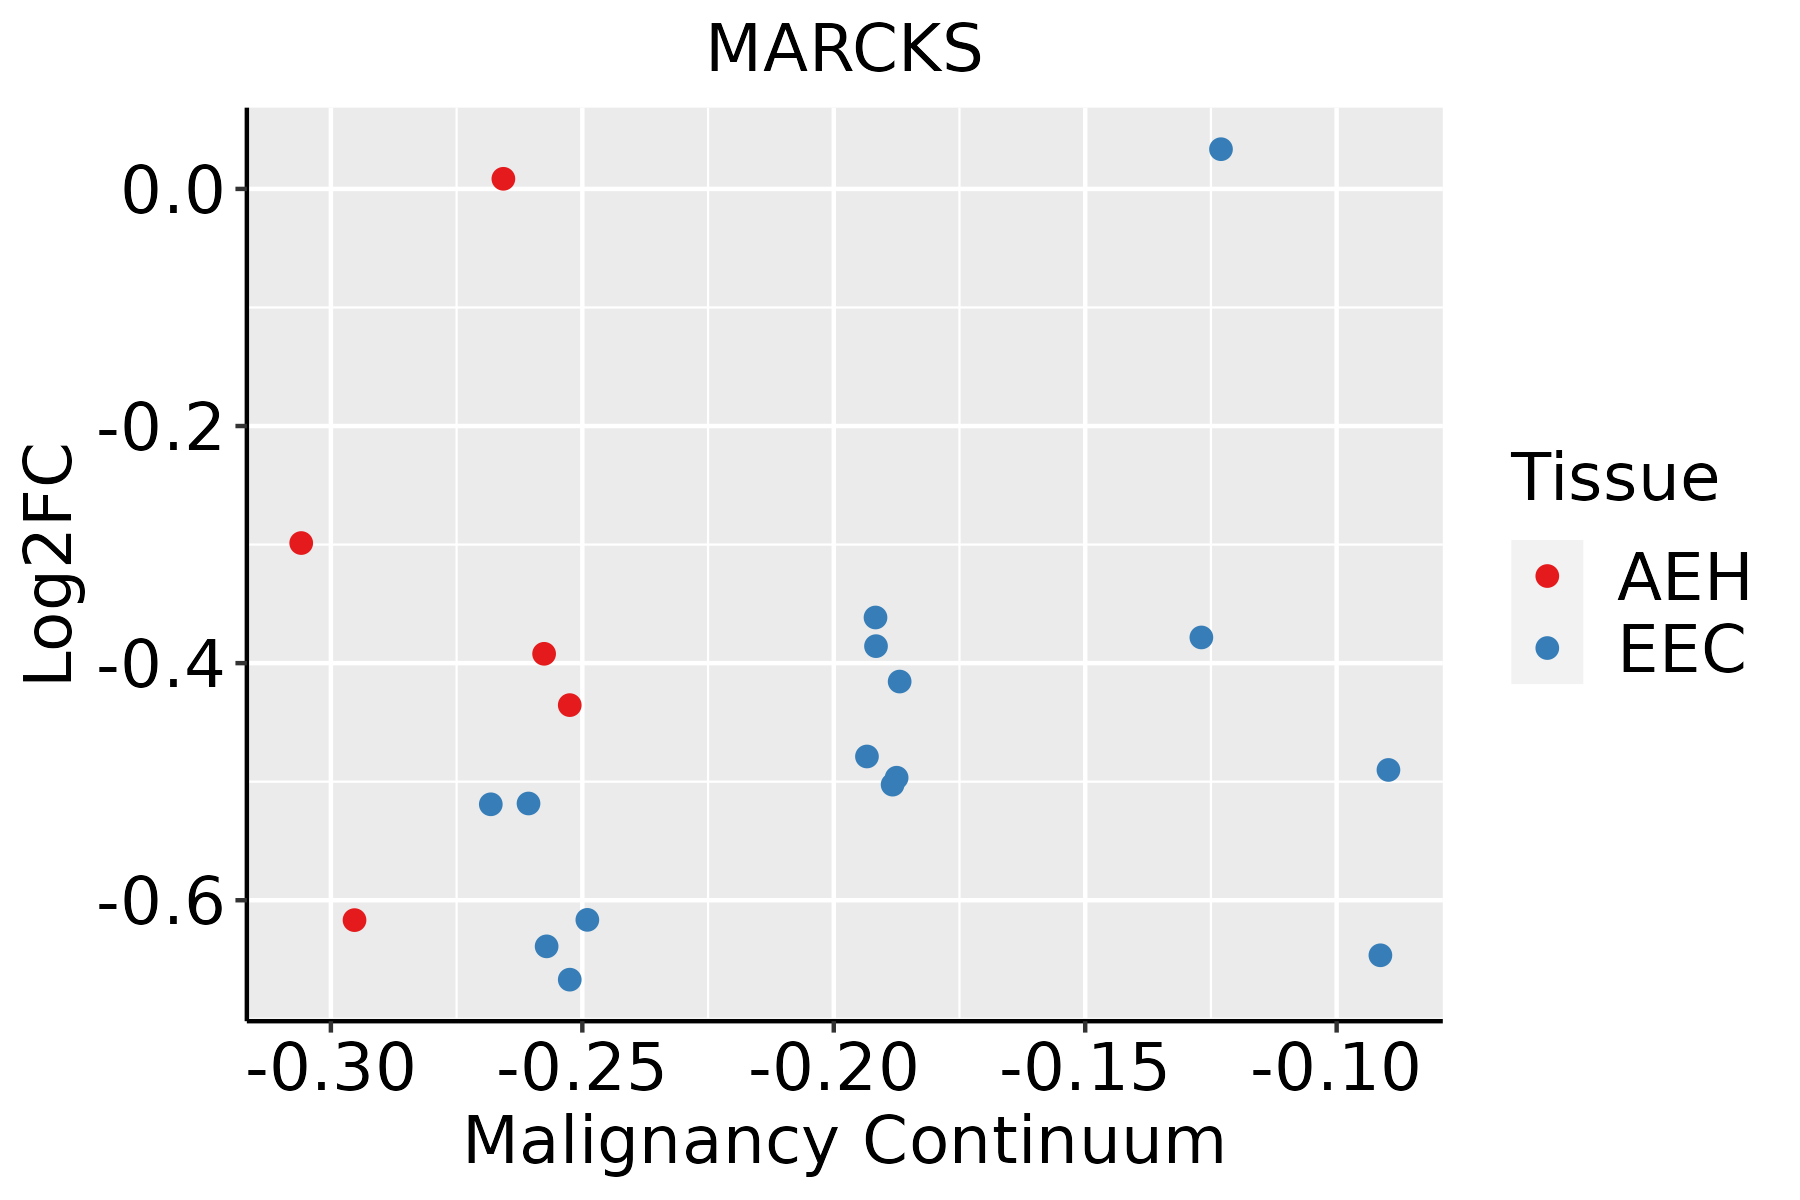 | AEH: Atypical endometrial hyperplasia |
| EEC: Endometrioid Cancer | ||
| Esophagus | 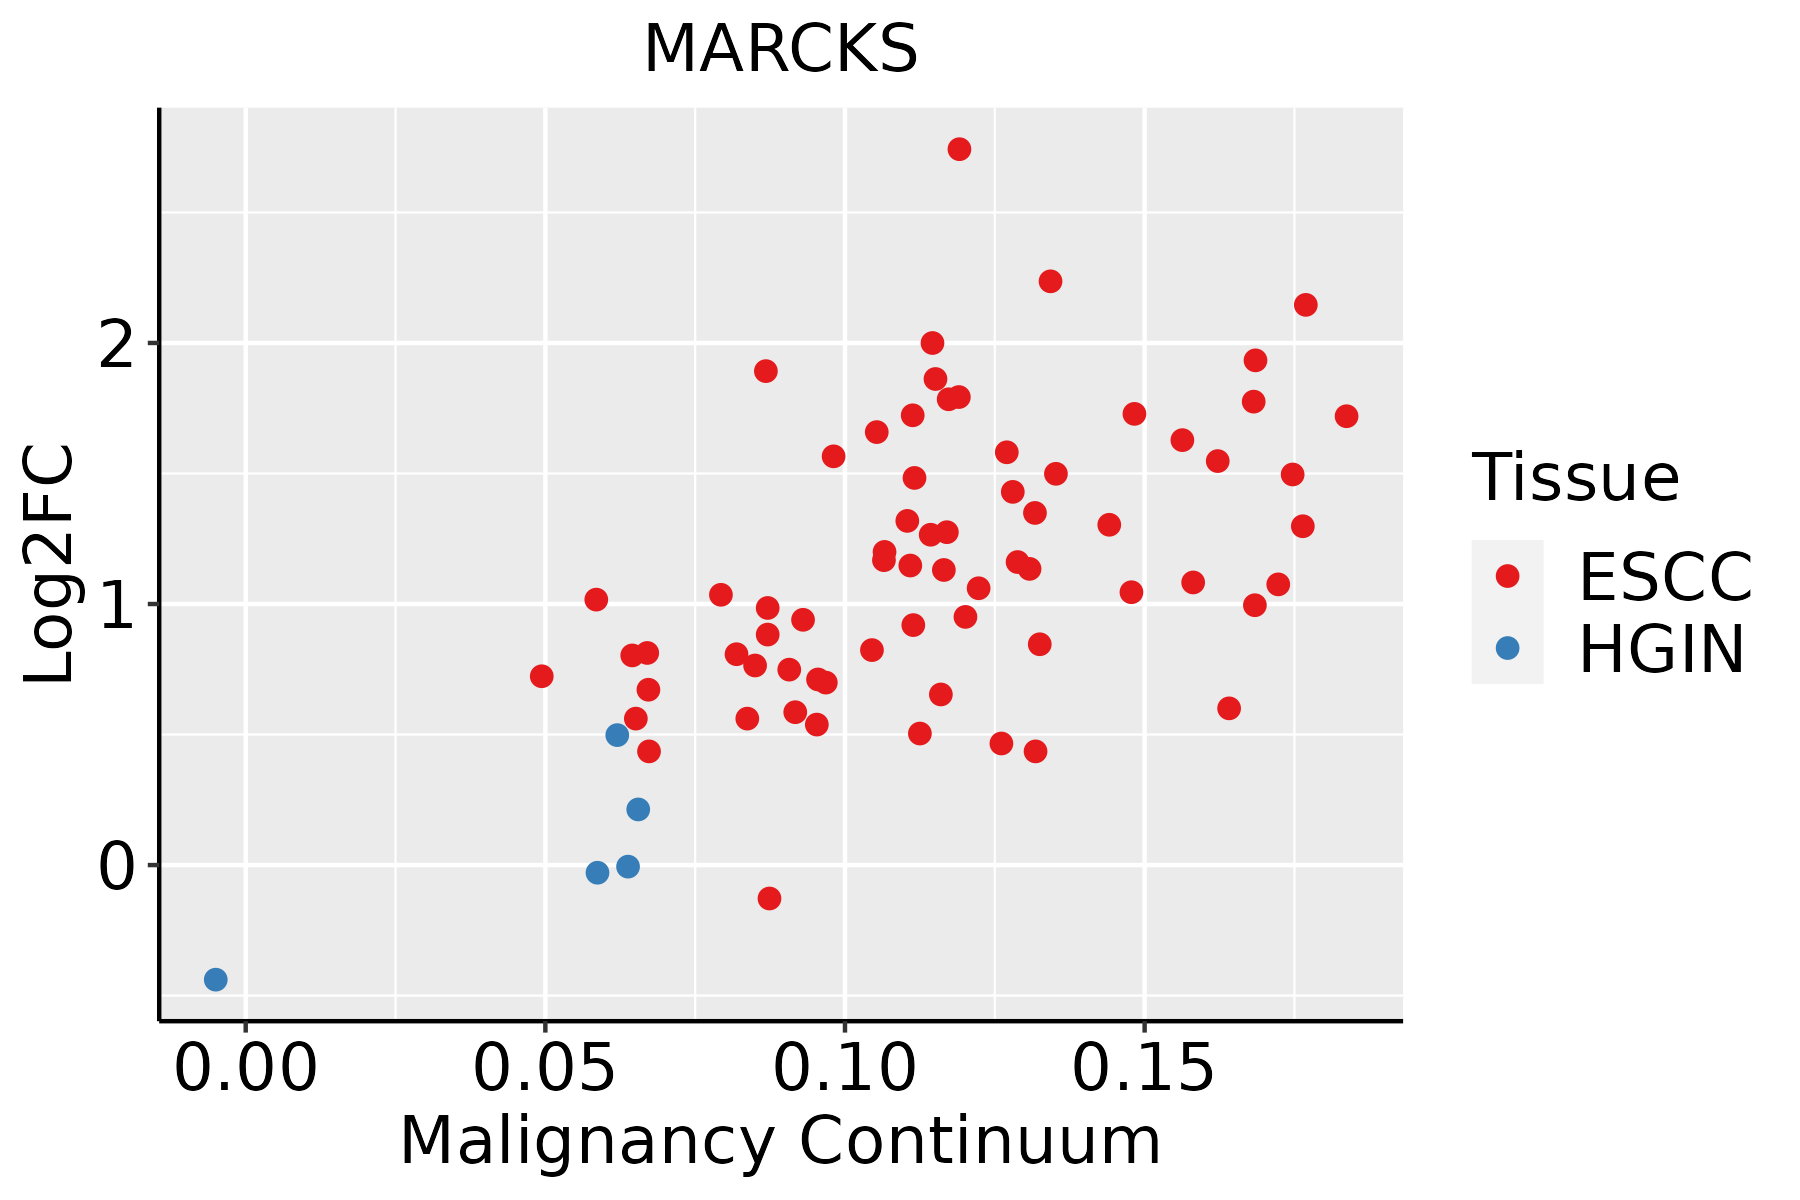 | ESCC: Esophageal squamous cell carcinoma |
| HGIN: High-grade intraepithelial neoplasias | ||
| LGIN: Low-grade intraepithelial neoplasias | ||
| Liver |  | HCC: Hepatocellular carcinoma |
| NAFLD: Non-alcoholic fatty liver disease | ||
| Oral Cavity | 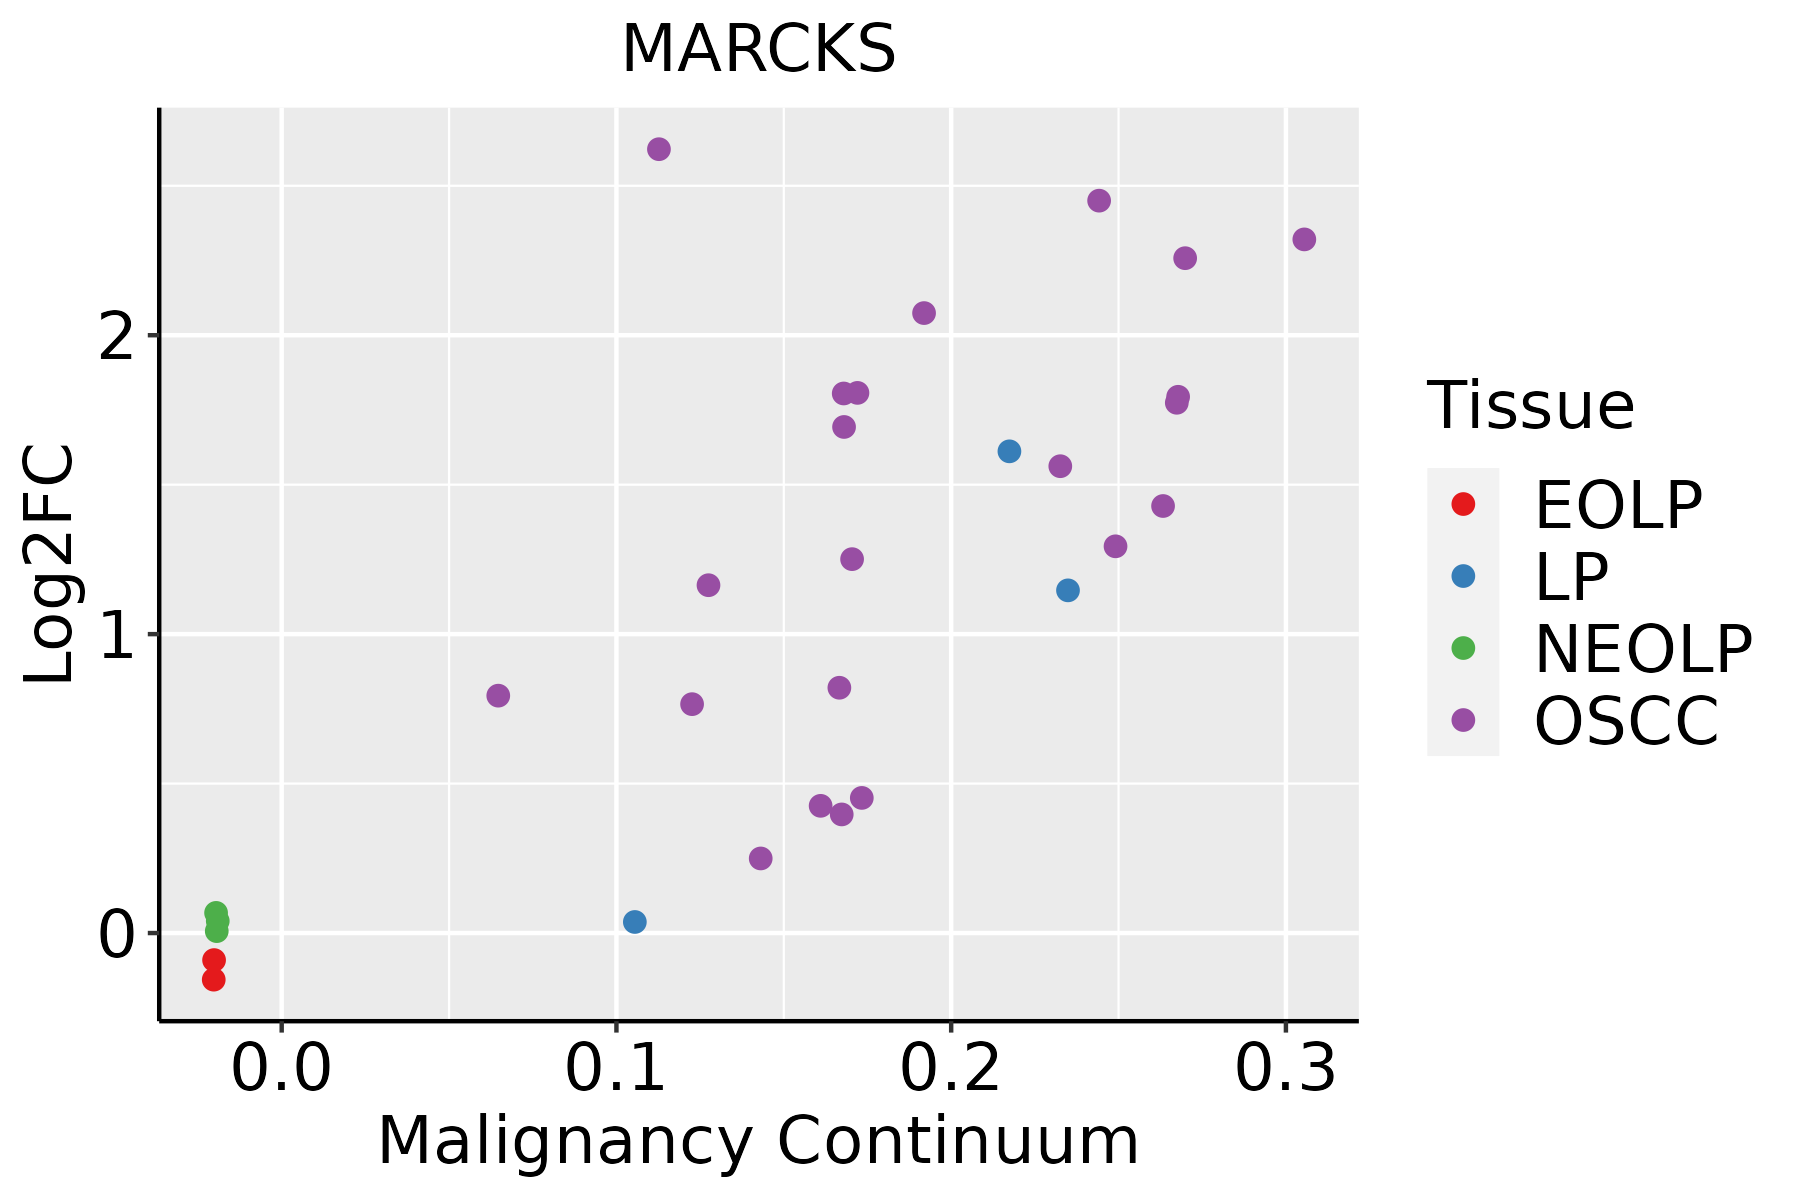 | EOLP: Erosive Oral lichen planus |
| LP: leukoplakia | ||
| NEOLP: Non-erosive oral lichen planus | ||
| OSCC: Oral squamous cell carcinoma | ||
| Prostate | 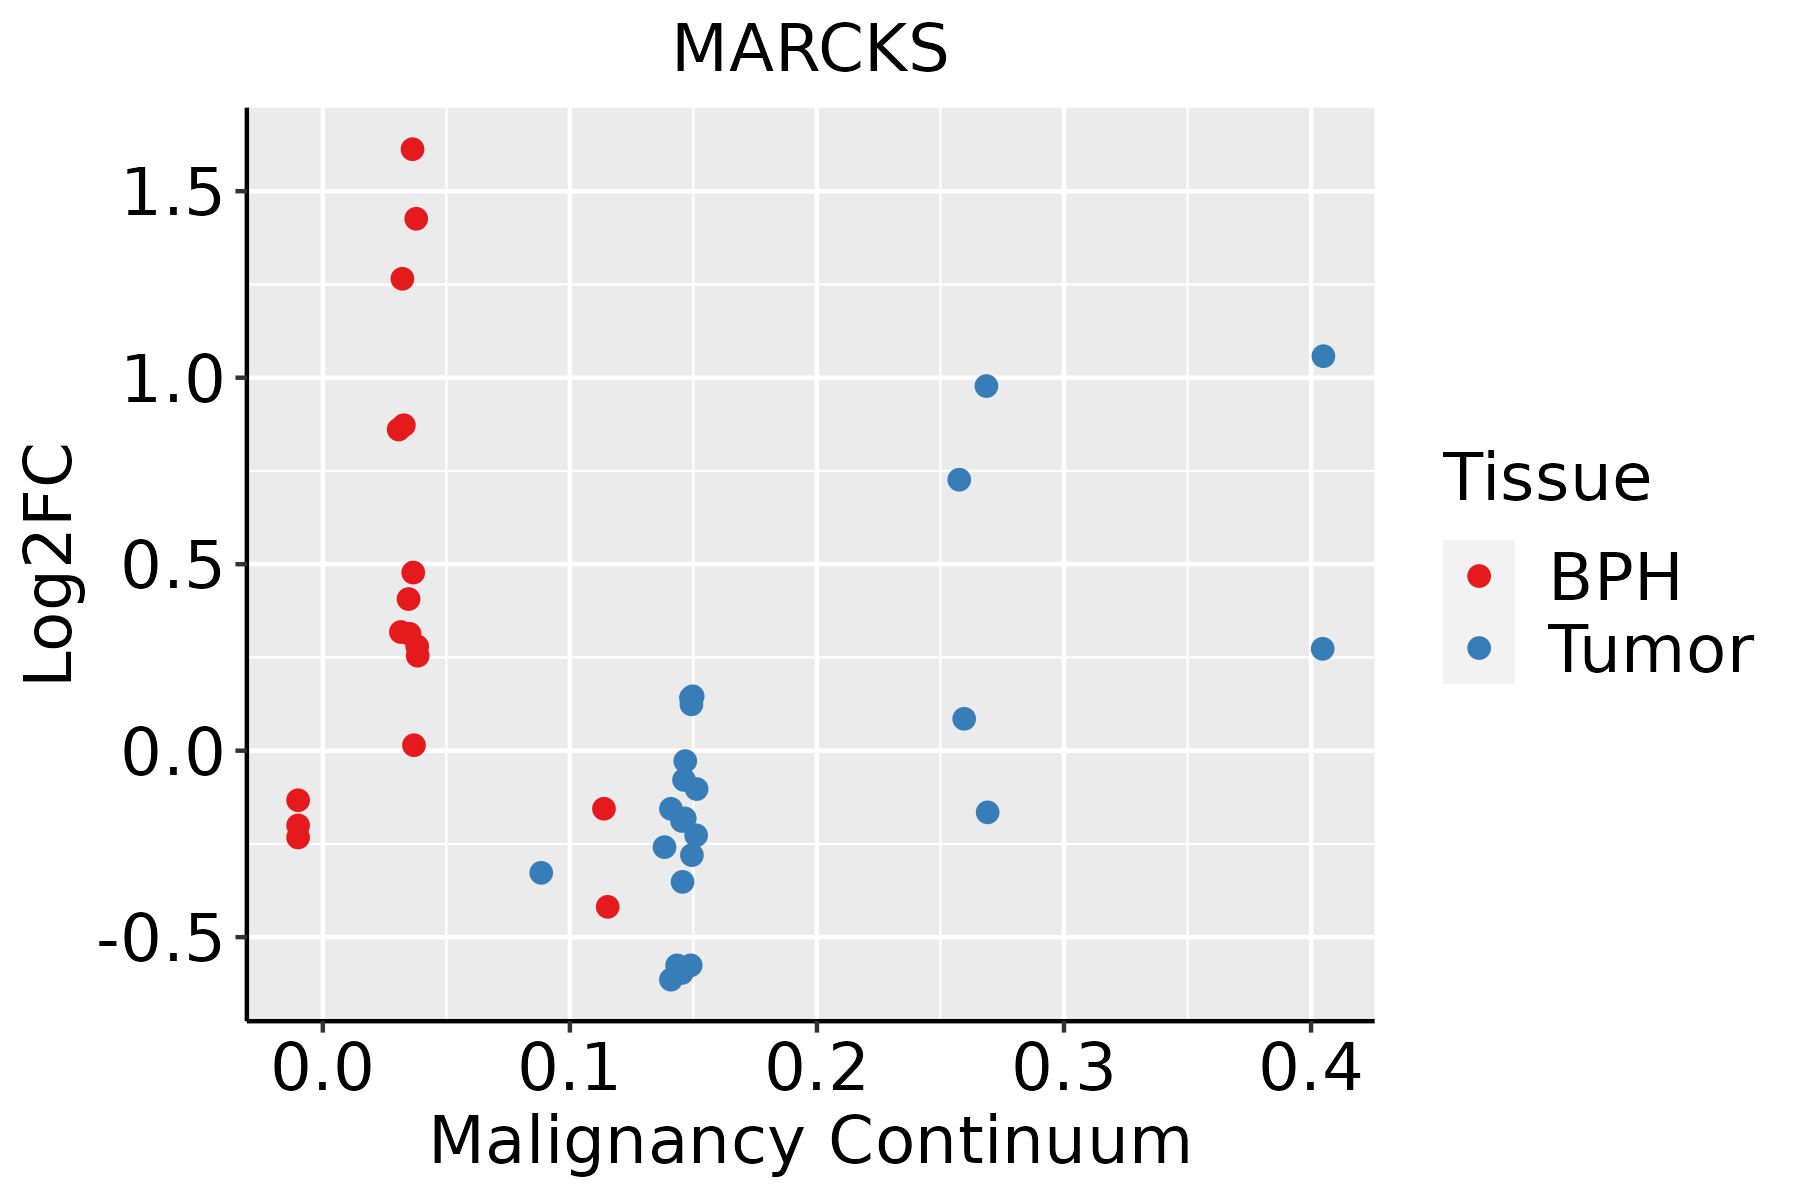 | BPH: Benign Prostatic Hyperplasia |
| Skin |  | AK: Actinic keratosis |
| cSCC: Cutaneous squamous cell carcinoma | ||
| SCCIS:squamous cell carcinoma in situ | ||
| Thyroid | 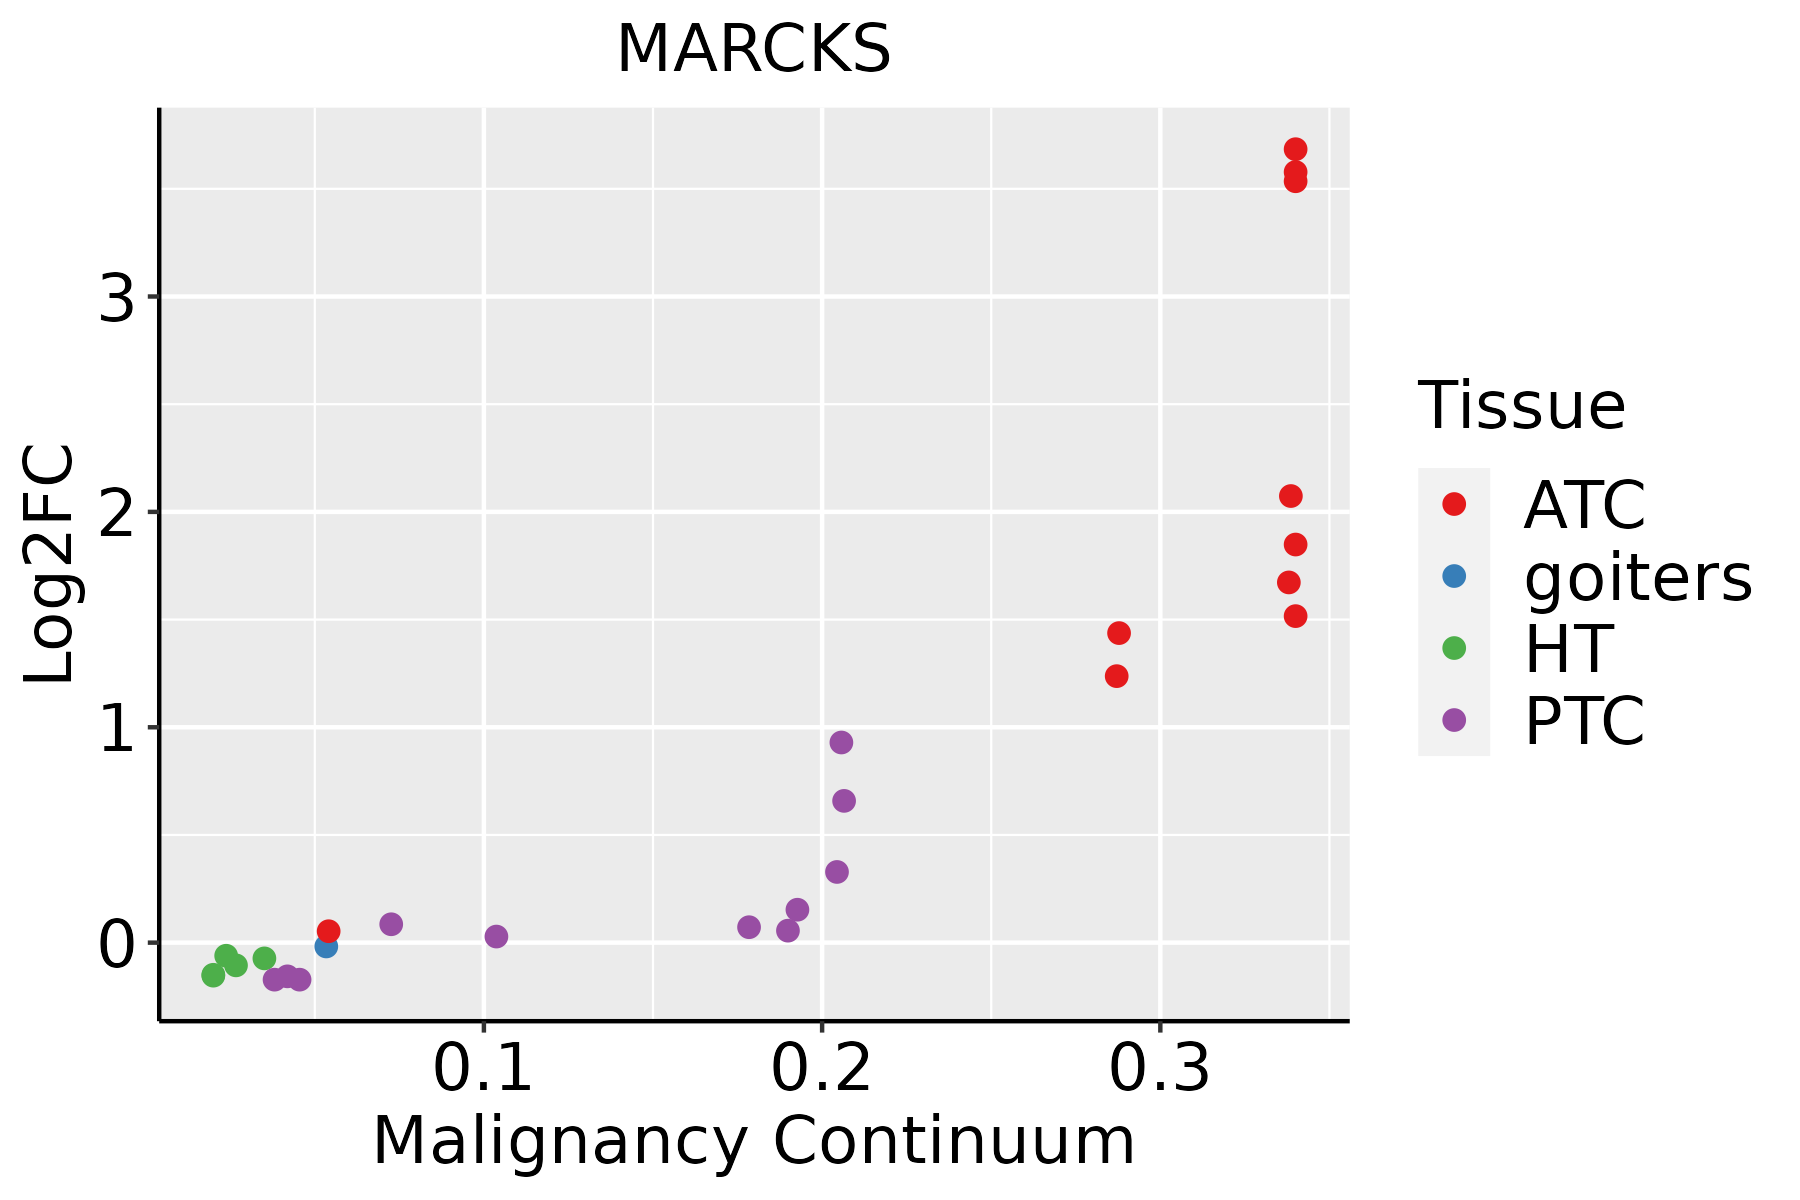 | ATC: Anaplastic thyroid cancer |
| HT: Hashimoto's thyroiditis | ||
| PTC: Papillary thyroid cancer |
| ∗log2FC in expression of this searched gene in stem-like cells from each diseased tissue sample relative to stem-like cells in normal samples in each tissue plotted against the malignancy continuum. Samples are colored based on if they are from different disease stage. |
Top |
Malignant transformation related pathway analysis |
| Find out the enriched GO biological processes and KEGG pathways involved in transition from healthy to precancer to cancer |
| Tissue | Disease Stage | Enriched GO biological Processes |
| Colorectum | AD |  |
| Colorectum | SER |  |
| Colorectum | MSS |  |
| Colorectum | MSI-H |  |
| Colorectum | FAP |  |
| ∗Top 15 enriched GO BP terms are showed in the bar plot of each disease state in each tissue. Each row represents a significant GO biological process which is colored according to the -log10(p.adjust). |
| Page: 1 2 3 4 5 6 7 8 9 |
| GO ID | Tissue | Disease Stage | Description | Gene Ratio | Bg Ratio | pvalue | p.adjust | Count |
| GO:00070159 | Breast | Precancer | actin filament organization | 44/1080 | 442/18723 | 3.02e-04 | 4.35e-03 | 44 |
| GO:00510179 | Breast | Precancer | actin filament bundle assembly | 18/1080 | 157/18723 | 4.17e-03 | 3.28e-02 | 18 |
| GO:00615729 | Breast | Precancer | actin filament bundle organization | 18/1080 | 161/18723 | 5.43e-03 | 4.01e-02 | 18 |
| GO:000701514 | Breast | IDC | actin filament organization | 55/1434 | 442/18723 | 2.45e-04 | 3.84e-03 | 55 |
| GO:005101714 | Breast | IDC | actin filament bundle assembly | 24/1434 | 157/18723 | 8.73e-04 | 1.01e-02 | 24 |
| GO:006157214 | Breast | IDC | actin filament bundle organization | 24/1434 | 161/18723 | 1.25e-03 | 1.33e-02 | 24 |
| GO:000701524 | Breast | DCIS | actin filament organization | 56/1390 | 442/18723 | 5.90e-05 | 1.19e-03 | 56 |
| GO:005101724 | Breast | DCIS | actin filament bundle assembly | 25/1390 | 157/18723 | 2.31e-04 | 3.65e-03 | 25 |
| GO:006157224 | Breast | DCIS | actin filament bundle organization | 25/1390 | 161/18723 | 3.43e-04 | 4.90e-03 | 25 |
| GO:000701510 | Cervix | CC | actin filament organization | 109/2311 | 442/18723 | 4.92e-13 | 2.45e-10 | 109 |
| GO:006157210 | Cervix | CC | actin filament bundle organization | 44/2311 | 161/18723 | 2.08e-07 | 9.34e-06 | 44 |
| GO:005101710 | Cervix | CC | actin filament bundle assembly | 43/2311 | 157/18723 | 2.66e-07 | 1.12e-05 | 43 |
| GO:000701515 | Cervix | HSIL_HPV | actin filament organization | 43/737 | 442/18723 | 4.77e-08 | 3.59e-06 | 43 |
| GO:000701525 | Cervix | N_HPV | actin filament organization | 29/534 | 442/18723 | 3.00e-05 | 8.02e-04 | 29 |
| GO:005101725 | Cervix | N_HPV | actin filament bundle assembly | 12/534 | 157/18723 | 1.85e-03 | 1.83e-02 | 12 |
| GO:006157225 | Cervix | N_HPV | actin filament bundle organization | 12/534 | 161/18723 | 2.28e-03 | 2.12e-02 | 12 |
| GO:0007015 | Colorectum | AD | actin filament organization | 167/3918 | 442/18723 | 1.65e-16 | 7.94e-14 | 167 |
| GO:0061572 | Colorectum | AD | actin filament bundle organization | 60/3918 | 161/18723 | 1.33e-06 | 4.23e-05 | 60 |
| GO:0051017 | Colorectum | AD | actin filament bundle assembly | 58/3918 | 157/18723 | 2.74e-06 | 7.89e-05 | 58 |
| GO:00070151 | Colorectum | SER | actin filament organization | 134/2897 | 442/18723 | 1.39e-15 | 5.70e-13 | 134 |
| Page: 1 2 3 4 |
| Pathway ID | Tissue | Disease Stage | Description | Gene Ratio | Bg Ratio | pvalue | p.adjust | qvalue | Count |
| hsa0466612 | Cervix | CC | Fc gamma R-mediated phagocytosis | 31/1267 | 97/8465 | 1.78e-05 | 1.42e-04 | 8.40e-05 | 31 |
| hsa0466613 | Cervix | CC | Fc gamma R-mediated phagocytosis | 31/1267 | 97/8465 | 1.78e-05 | 1.42e-04 | 8.40e-05 | 31 |
| hsa04666 | Colorectum | AD | Fc gamma R-mediated phagocytosis | 46/2092 | 97/8465 | 9.10e-07 | 1.22e-05 | 7.77e-06 | 46 |
| hsa046661 | Colorectum | AD | Fc gamma R-mediated phagocytosis | 46/2092 | 97/8465 | 9.10e-07 | 1.22e-05 | 7.77e-06 | 46 |
| hsa046662 | Colorectum | SER | Fc gamma R-mediated phagocytosis | 39/1580 | 97/8465 | 5.84e-07 | 9.70e-06 | 7.04e-06 | 39 |
| hsa046663 | Colorectum | SER | Fc gamma R-mediated phagocytosis | 39/1580 | 97/8465 | 5.84e-07 | 9.70e-06 | 7.04e-06 | 39 |
| hsa046664 | Colorectum | MSS | Fc gamma R-mediated phagocytosis | 45/1875 | 97/8465 | 9.30e-08 | 1.56e-06 | 9.55e-07 | 45 |
| hsa046665 | Colorectum | MSS | Fc gamma R-mediated phagocytosis | 45/1875 | 97/8465 | 9.30e-08 | 1.56e-06 | 9.55e-07 | 45 |
| hsa046666 | Colorectum | FAP | Fc gamma R-mediated phagocytosis | 35/1404 | 97/8465 | 2.46e-06 | 4.28e-05 | 2.60e-05 | 35 |
| hsa046667 | Colorectum | FAP | Fc gamma R-mediated phagocytosis | 35/1404 | 97/8465 | 2.46e-06 | 4.28e-05 | 2.60e-05 | 35 |
| hsa0466614 | Endometrium | AEH | Fc gamma R-mediated phagocytosis | 27/1197 | 97/8465 | 3.02e-04 | 2.39e-03 | 1.75e-03 | 27 |
| hsa0466615 | Endometrium | AEH | Fc gamma R-mediated phagocytosis | 27/1197 | 97/8465 | 3.02e-04 | 2.39e-03 | 1.75e-03 | 27 |
| hsa0466621 | Endometrium | EEC | Fc gamma R-mediated phagocytosis | 27/1237 | 97/8465 | 5.15e-04 | 3.83e-03 | 2.85e-03 | 27 |
| hsa0466631 | Endometrium | EEC | Fc gamma R-mediated phagocytosis | 27/1237 | 97/8465 | 5.15e-04 | 3.83e-03 | 2.85e-03 | 27 |
| hsa0466620 | Esophagus | ESCC | Fc gamma R-mediated phagocytosis | 63/4205 | 97/8465 | 1.63e-03 | 4.89e-03 | 2.50e-03 | 63 |
| hsa04666110 | Esophagus | ESCC | Fc gamma R-mediated phagocytosis | 63/4205 | 97/8465 | 1.63e-03 | 4.89e-03 | 2.50e-03 | 63 |
| hsa0466610 | Liver | HCC | Fc gamma R-mediated phagocytosis | 58/4020 | 97/8465 | 9.65e-03 | 2.52e-02 | 1.40e-02 | 58 |
| hsa0466611 | Liver | HCC | Fc gamma R-mediated phagocytosis | 58/4020 | 97/8465 | 9.65e-03 | 2.52e-02 | 1.40e-02 | 58 |
| hsa0466618 | Oral cavity | OSCC | Fc gamma R-mediated phagocytosis | 60/3704 | 97/8465 | 2.35e-04 | 7.72e-04 | 3.93e-04 | 60 |
| hsa0466619 | Oral cavity | OSCC | Fc gamma R-mediated phagocytosis | 60/3704 | 97/8465 | 2.35e-04 | 7.72e-04 | 3.93e-04 | 60 |
| Page: 1 2 |
Top |
Cell-cell communication analysis |
| Identification of potential cell-cell interactions between two cell types and their ligand-receptor pairs for different disease states |
| Ligand | Receptor | LRpair | Pathway | Tissue | Disease Stage |
| Page: 1 |
Top |
Single-cell gene regulatory network inference analysis |
| Find out the significant the regulons (TFs) and the target genes of each regulon across cell types for different disease states |
| TF | Cell Type | Tissue | Disease Stage | Target Gene | RSS | Regulon Activity |
| ∗The dot plots of a searched regulon are shown for all cell subpopulations in each disease state of each tissue based on the regulon specific score inferred using pySCENIC and by calculating the average expression. |
| Page: 1 |
Top |
Somatic mutation of malignant transformation related genes |
| Annotation of somatic variants for genes involved in malignant transformation |
| Hugo Symbol | Variant Class | Variant Classification | dbSNP RS | HGVSc | HGVSp | HGVSp Short | SWISSPROT | BIOTYPE | SIFT | PolyPhen | Tumor Sample Barcode | Tissue | Histology | Sex | Age | Stage | Therapy Types | Drugs | Outcome |
| MARCKS | SNV | Missense_Mutation | c.83N>T | p.Pro28Leu | p.P28L | P29966 | protein_coding | deleterious(0) | probably_damaging(0.999) | TCGA-DR-A0ZL-01 | Cervix | cervical & endocervical cancer | Female | <65 | I/II | Unknown | Unknown | SD | |
| MARCKS | deletion | Frame_Shift_Del | c.974delN | p.Pro327GlnfsTer42 | p.P327Qfs*42 | P29966 | protein_coding | TCGA-A6-2686-01 | Colorectum | colon adenocarcinoma | Female | >=65 | I/II | Unknown | Unknown | SD | |||
| MARCKS | insertion | Frame_Shift_Ins | rs770972906 | c.973_974insC | p.Ala328SerfsTer14 | p.A328Sfs*14 | P29966 | protein_coding | TCGA-CK-5916-01 | Colorectum | colon adenocarcinoma | Female | >=65 | I/II | Unknown | Unknown | PD | ||
| MARCKS | deletion | Frame_Shift_Del | c.939delC | p.Ser314HisfsTer55 | p.S314Hfs*55 | P29966 | protein_coding | TCGA-CM-6674-01 | Colorectum | colon adenocarcinoma | Male | <65 | I/II | Unknown | Unknown | SD | |||
| MARCKS | deletion | Frame_Shift_Del | c.974delN | p.Pro327GlnfsTer42 | p.P327Qfs*42 | P29966 | protein_coding | TCGA-G4-6309-01 | Colorectum | colon adenocarcinoma | Female | <65 | III/IV | Chemotherapy | xeloda | PD | |||
| MARCKS | SNV | Missense_Mutation | novel | c.983N>T | p.Ala328Val | p.A328V | P29966 | protein_coding | tolerated_low_confidence(0.21) | benign(0.193) | TCGA-EO-A22R-01 | Endometrium | uterine corpus endometrioid carcinoma | Female | <65 | I/II | Unknown | Unknown | SD |
| MARCKS | deletion | Frame_Shift_Del | c.980delC | p.Pro327GlnfsTer42 | p.P327Qfs*42 | P29966 | protein_coding | TCGA-B5-A5OC-01 | Endometrium | uterine corpus endometrioid carcinoma | Female | >=65 | III/IV | Chemotherapy | cisplatin | SD | |||
| MARCKS | deletion | Frame_Shift_Del | c.974delN | p.Pro327GlnfsTer42 | p.P327Qfs*42 | P29966 | protein_coding | TCGA-EY-A547-01 | Endometrium | uterine corpus endometrioid carcinoma | Female | >=65 | I/II | Unknown | Unknown | SD | |||
| MARCKS | SNV | Missense_Mutation | novel | c.590C>A | p.Ala197Asp | p.A197D | P29966 | protein_coding | deleterious_low_confidence(0.02) | benign(0.041) | TCGA-86-A4D0-01 | Lung | lung adenocarcinoma | Male | <65 | I/II | Chemotherapy | etoposide | CR |
| MARCKS | SNV | Missense_Mutation | novel | c.913N>A | p.Ala305Thr | p.A305T | P29966 | protein_coding | tolerated_low_confidence(0.15) | benign(0.003) | TCGA-97-7938-01 | Lung | lung adenocarcinoma | Female | >=65 | I/II | Unknown | Unknown | SD |
| Page: 1 2 3 |
Top |
Related drugs of malignant transformation related genes |
| Identification of chemicals and drugs interact with genes involved in malignant transfromation |
| (DGIdb 4.0) |
| Entrez ID | Symbol | Category | Interaction Types | Drug Claim Name | Drug Name | PMIDs |
| 4082 | MARCKS | KINASE | BIO-11006 | BIO-11006 |
| Page: 1 |

Copyright 2023-Present -The University of Texas Health Science Center at Houston |