
|
|||||
|
 | |
| |
| |
| |
| |
| |
|
Gene: MARCH7 |
Gene summary for MARCH7 |
| Gene information | Species | Human | Gene symbol | MARCH7 | Gene ID | 64844 |
| Gene name | membrane associated ring-CH-type finger 7 | |
| Gene Alias | AXO | |
| Cytomap | 2q24.2 | |
| Gene Type | protein-coding | GO ID | GO:0000209 | UniProtAcc | B7ZAR7 |
Top |
Malignant transformation analysis |
| Identification of the aberrant gene expression in precancerous and cancerous lesions by comparing the gene expression of stem-like cells in diseased tissues with normal stem cells |
| Entrez ID | Symbol | Replicates | Species | Organ | Tissue | Adj P-value | Log2FC | Malignancy |
| 64844 | MARCH7 | CCI_1 | Human | Cervix | CC | 3.64e-23 | 1.09e+00 | 0.528 |
| 64844 | MARCH7 | CCI_2 | Human | Cervix | CC | 2.30e-24 | 1.12e+00 | 0.5249 |
| 64844 | MARCH7 | CCI_3 | Human | Cervix | CC | 2.02e-37 | 1.16e+00 | 0.516 |
| 64844 | MARCH7 | CCII_1 | Human | Cervix | CC | 9.25e-04 | 1.62e-01 | 0.3249 |
| 64844 | MARCH7 | Tumor | Human | Cervix | CC | 5.84e-20 | 3.49e-01 | 0.1241 |
| 64844 | MARCH7 | sample3 | Human | Cervix | CC | 4.67e-35 | 4.46e-01 | 0.1387 |
| 64844 | MARCH7 | H2 | Human | Cervix | HSIL_HPV | 6.51e-23 | 4.48e-01 | 0.0632 |
| 64844 | MARCH7 | T1 | Human | Cervix | CC | 1.39e-10 | 2.36e-01 | 0.0918 |
| 64844 | MARCH7 | T2 | Human | Cervix | CC | 4.61e-08 | 2.90e-01 | 0.0709 |
| 64844 | MARCH7 | T3 | Human | Cervix | CC | 2.08e-31 | 4.10e-01 | 0.1389 |
| 64844 | MARCH7 | HTA11_3410_2000001011 | Human | Colorectum | AD | 2.16e-35 | -7.41e-01 | 0.0155 |
| 64844 | MARCH7 | HTA11_2487_2000001011 | Human | Colorectum | SER | 1.46e-21 | -7.41e-01 | -0.1808 |
| 64844 | MARCH7 | HTA11_2951_2000001011 | Human | Colorectum | AD | 2.88e-05 | -7.41e-01 | 0.0216 |
| 64844 | MARCH7 | HTA11_1938_2000001011 | Human | Colorectum | AD | 1.22e-16 | -7.41e-01 | -0.0811 |
| 64844 | MARCH7 | HTA11_78_2000001011 | Human | Colorectum | AD | 3.70e-25 | -7.41e-01 | -0.1088 |
| 64844 | MARCH7 | HTA11_347_2000001011 | Human | Colorectum | AD | 7.28e-38 | -7.41e-01 | -0.1954 |
| 64844 | MARCH7 | HTA11_411_2000001011 | Human | Colorectum | SER | 4.06e-03 | -7.41e-01 | -0.2602 |
| 64844 | MARCH7 | HTA11_2112_2000001011 | Human | Colorectum | SER | 1.69e-04 | -7.41e-01 | -0.2196 |
| 64844 | MARCH7 | HTA11_3361_2000001011 | Human | Colorectum | AD | 3.03e-17 | -7.41e-01 | -0.1207 |
| 64844 | MARCH7 | HTA11_83_2000001011 | Human | Colorectum | SER | 5.44e-14 | -7.41e-01 | -0.1526 |
| Page: 1 2 3 4 5 6 7 8 9 10 |
| Tissue | Expression Dynamics | Abbreviation |
| Cervix | 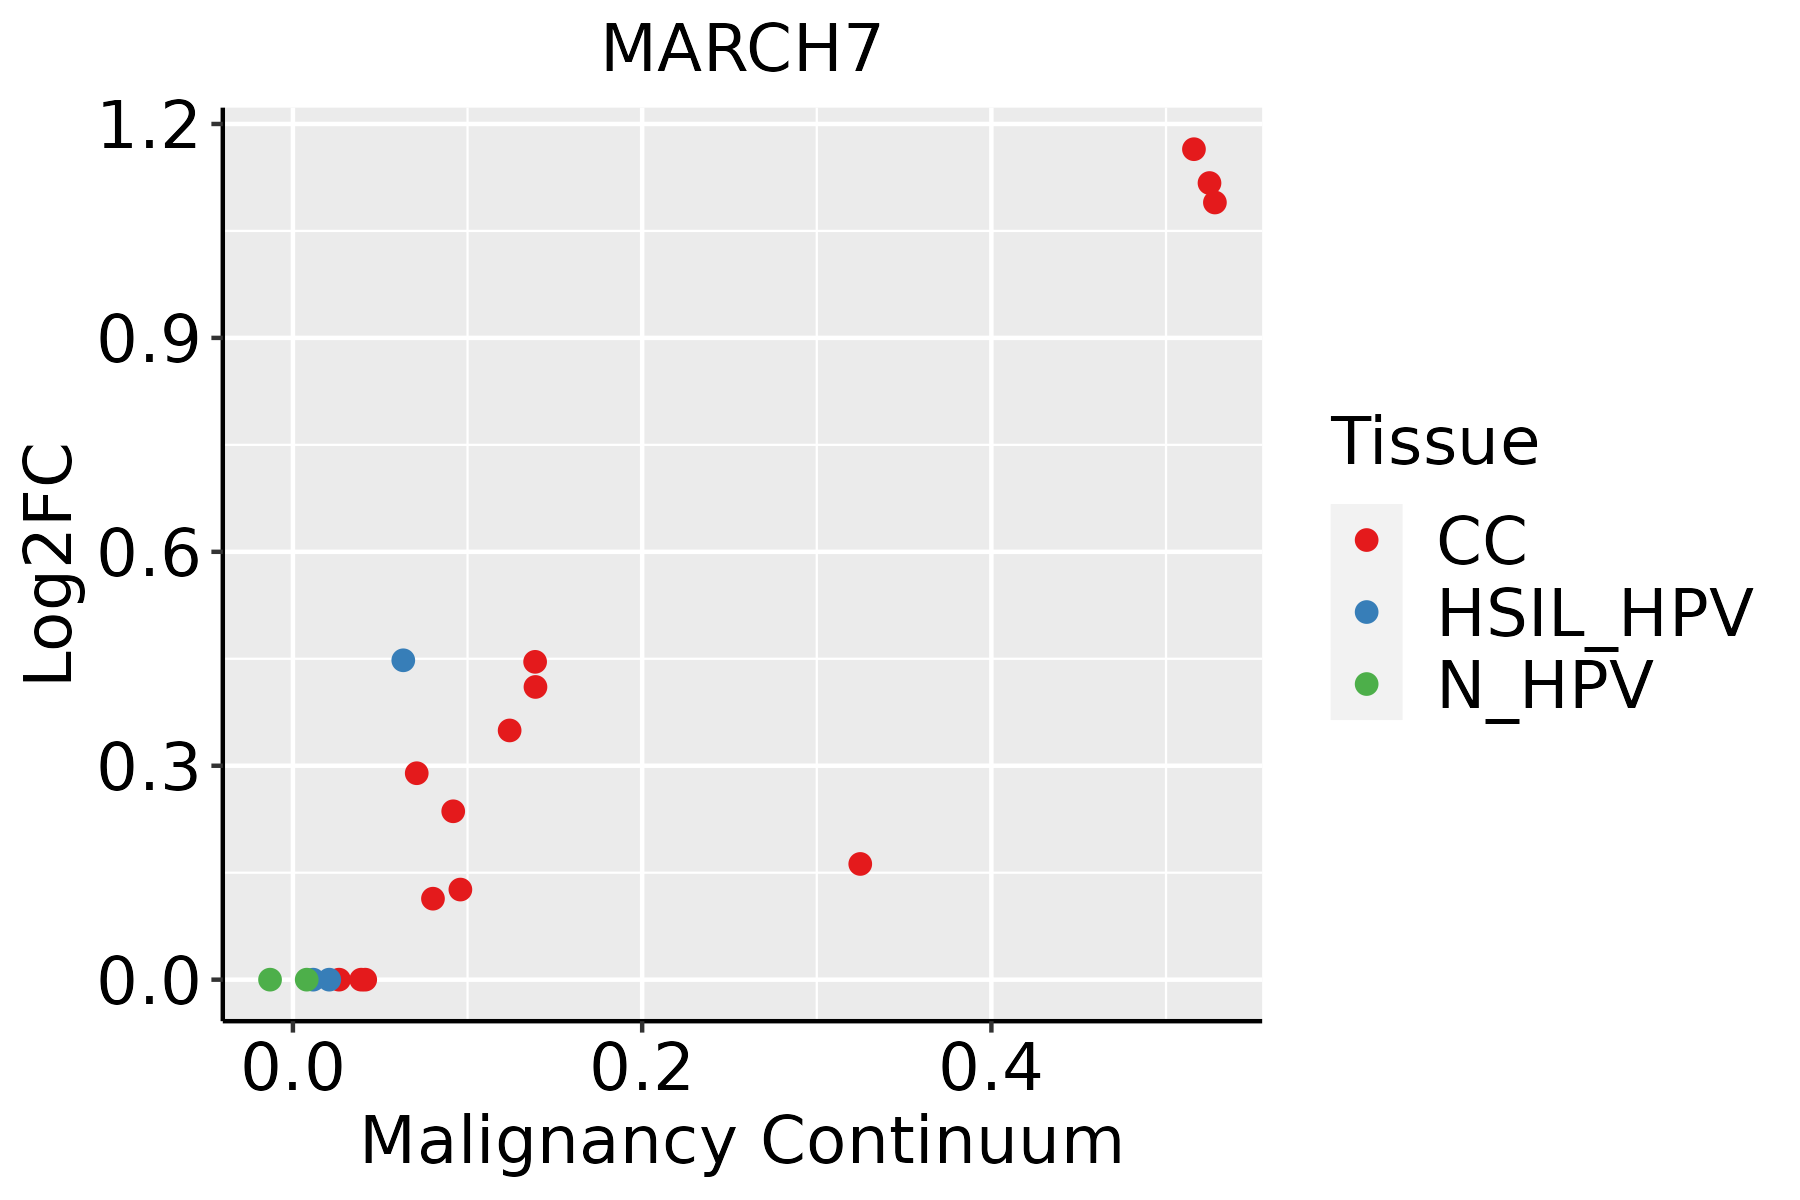 | CC: Cervix cancer |
| HSIL_HPV: HPV-infected high-grade squamous intraepithelial lesions | ||
| N_HPV: HPV-infected normal cervix | ||
| Colorectum (GSE201348) |  | FAP: Familial adenomatous polyposis |
| CRC: Colorectal cancer | ||
| Colorectum (HTA11) |  | AD: Adenomas |
| SER: Sessile serrated lesions | ||
| MSI-H: Microsatellite-high colorectal cancer | ||
| MSS: Microsatellite stable colorectal cancer | ||
| Esophagus | 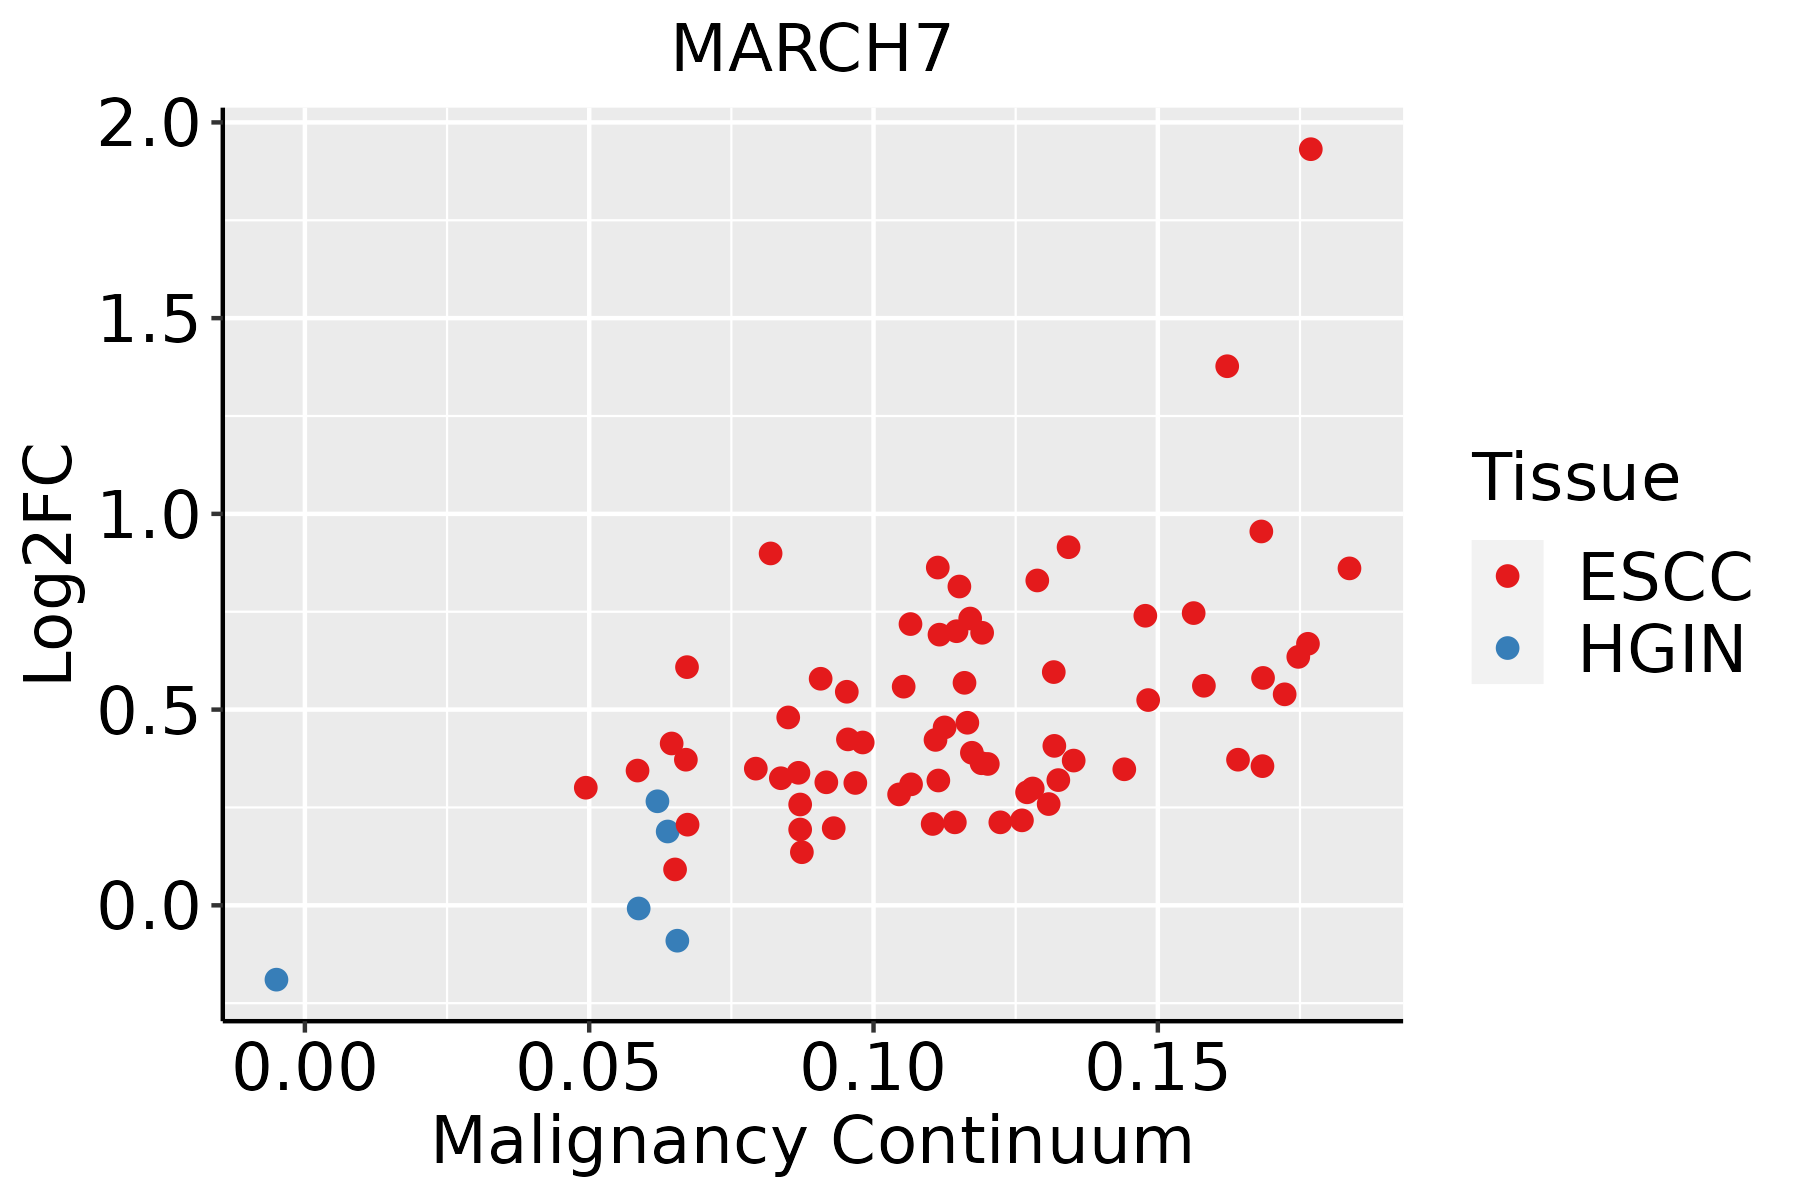 | ESCC: Esophageal squamous cell carcinoma |
| HGIN: High-grade intraepithelial neoplasias | ||
| LGIN: Low-grade intraepithelial neoplasias | ||
| Oral Cavity | 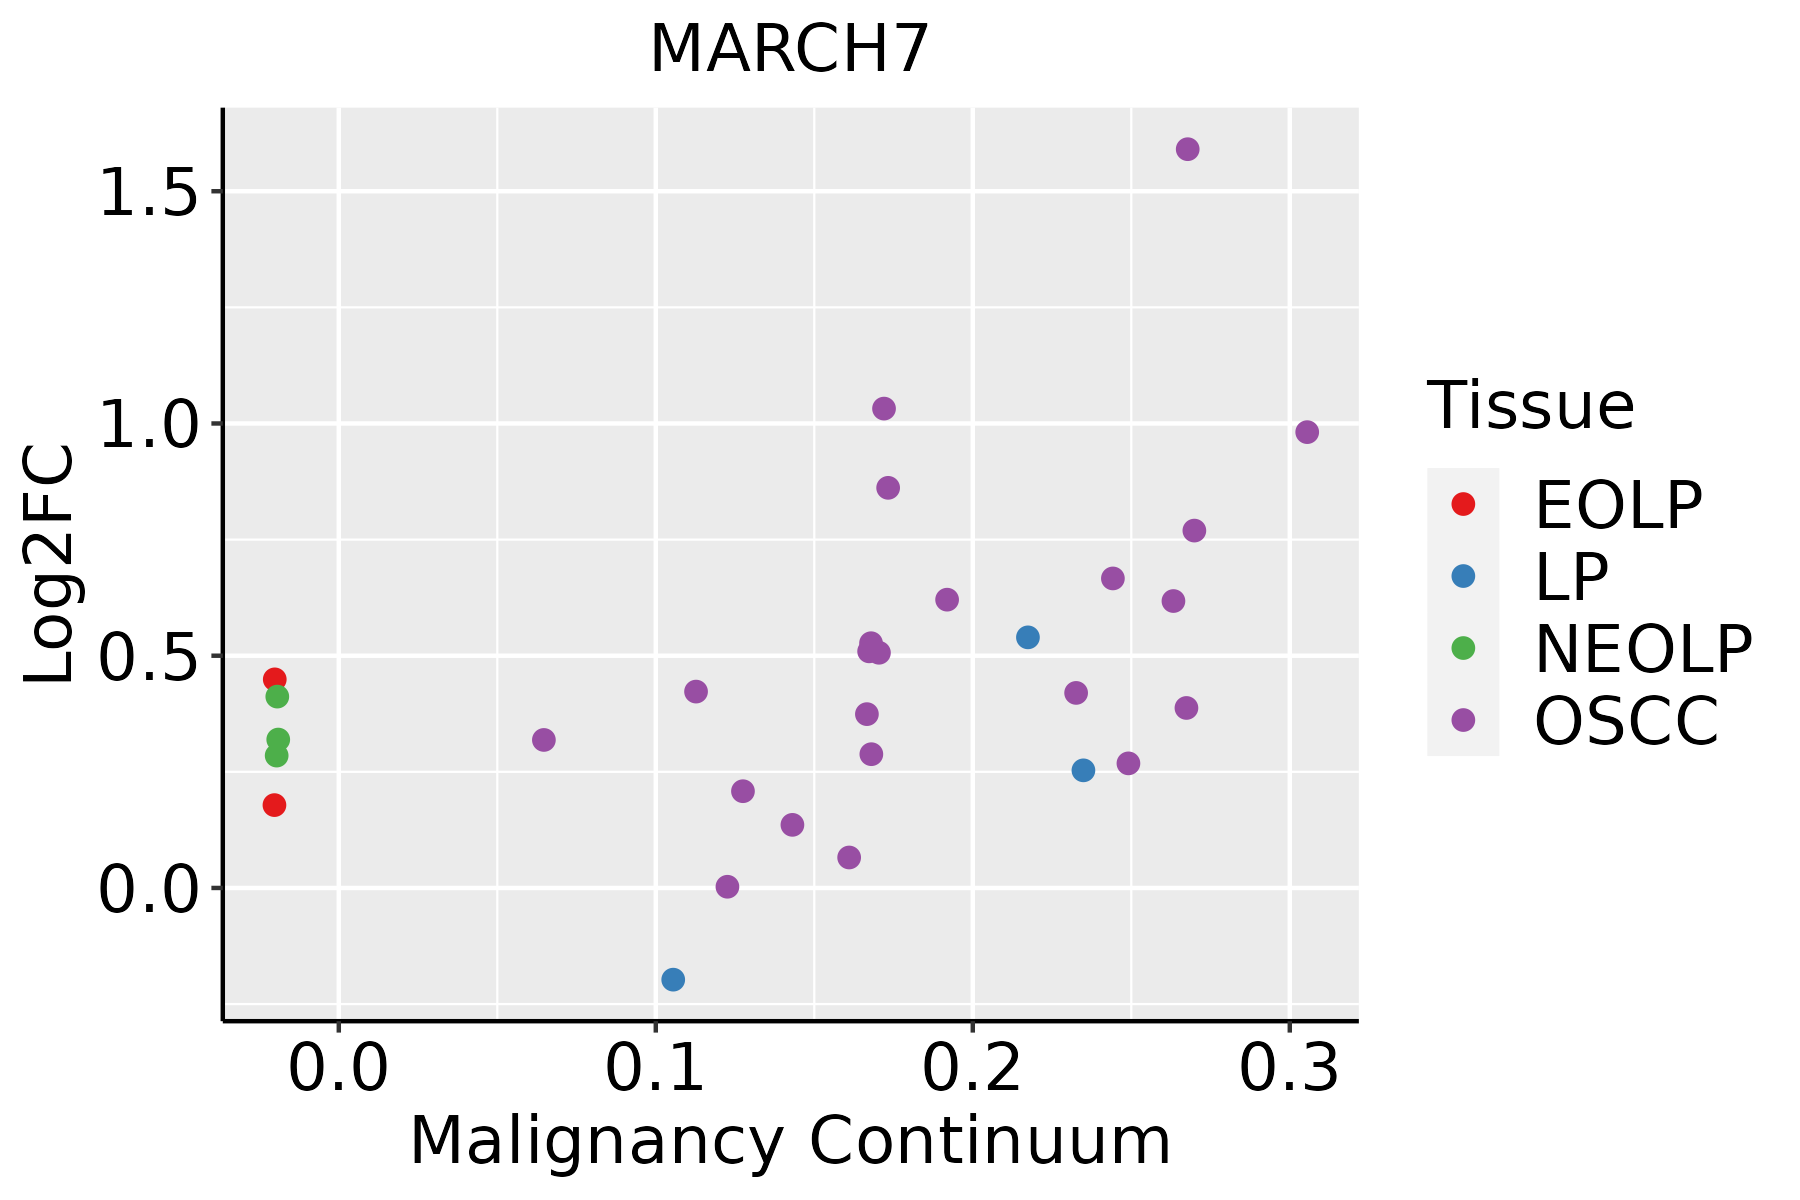 | EOLP: Erosive Oral lichen planus |
| LP: leukoplakia | ||
| NEOLP: Non-erosive oral lichen planus | ||
| OSCC: Oral squamous cell carcinoma | ||
| Prostate | 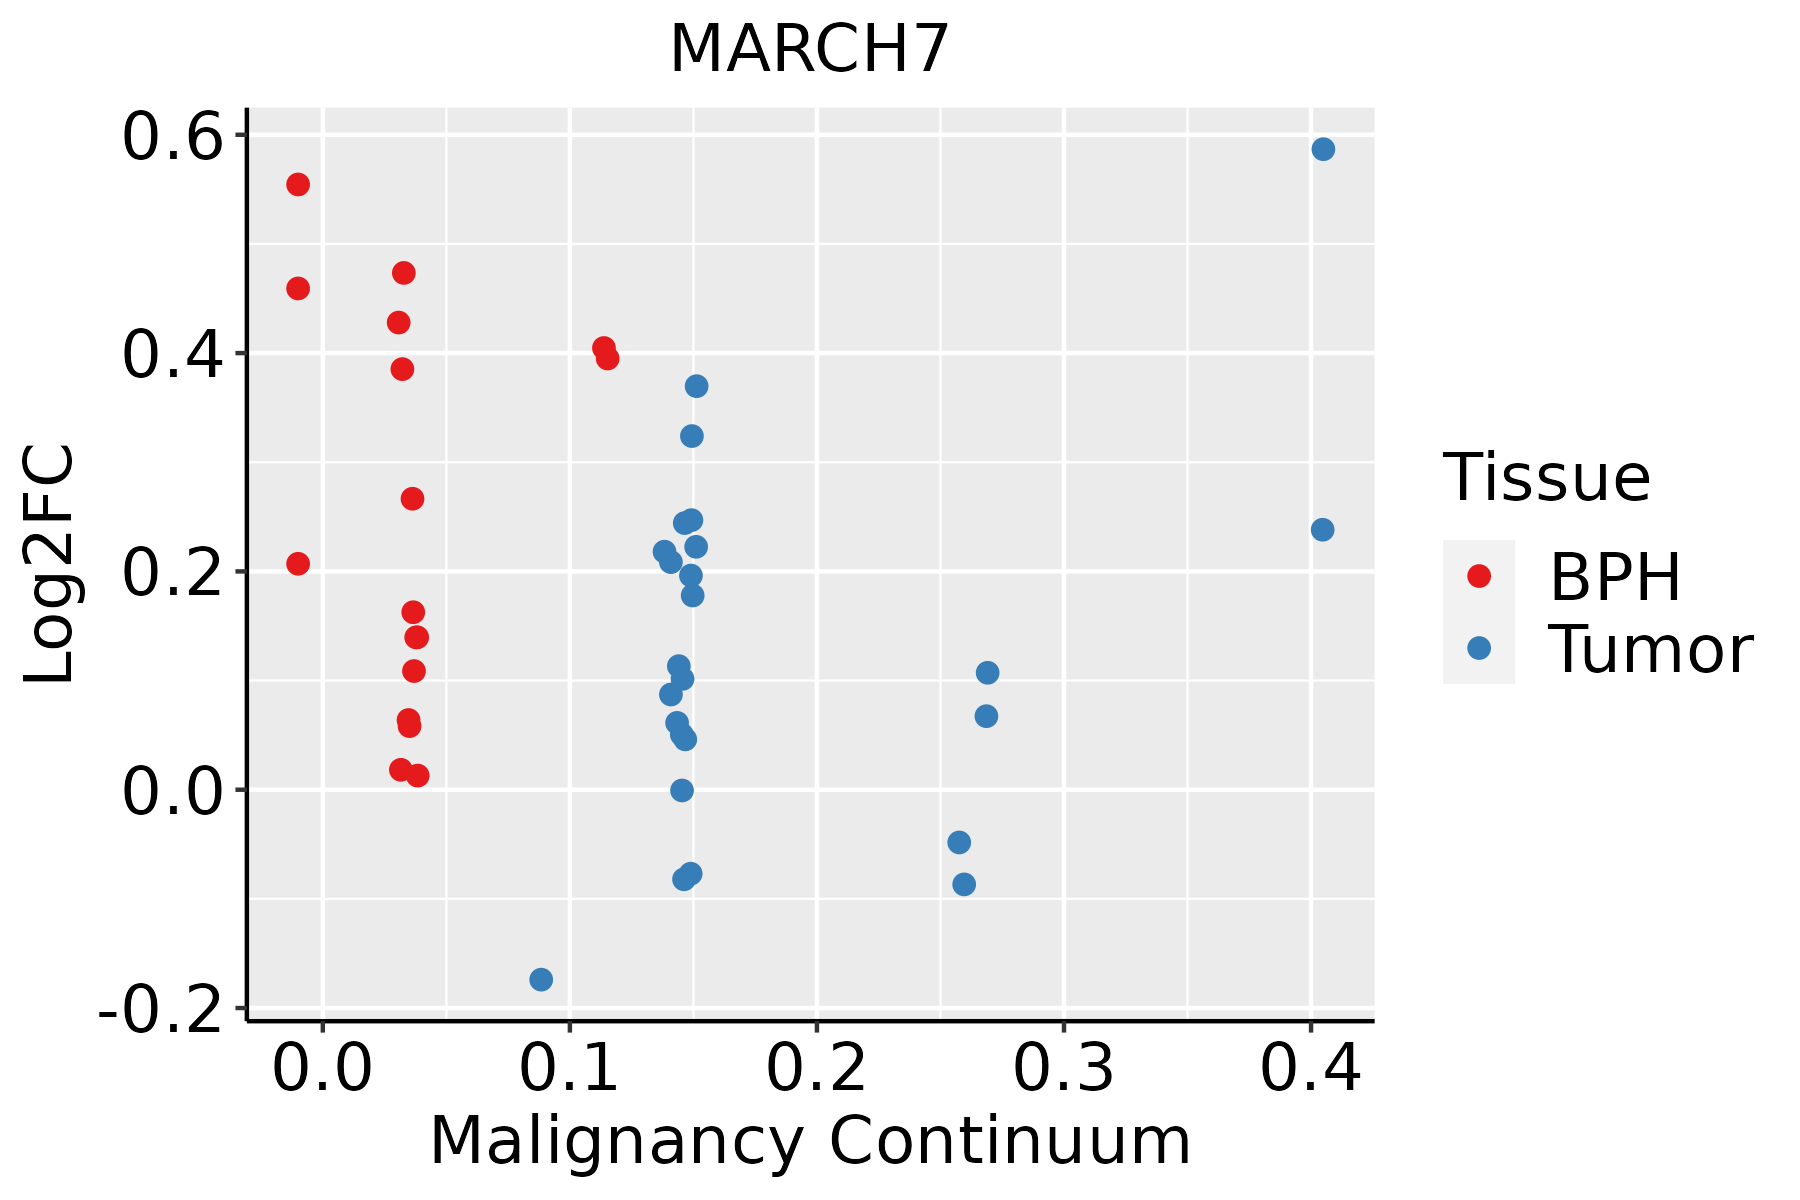 | BPH: Benign Prostatic Hyperplasia |
| Skin | 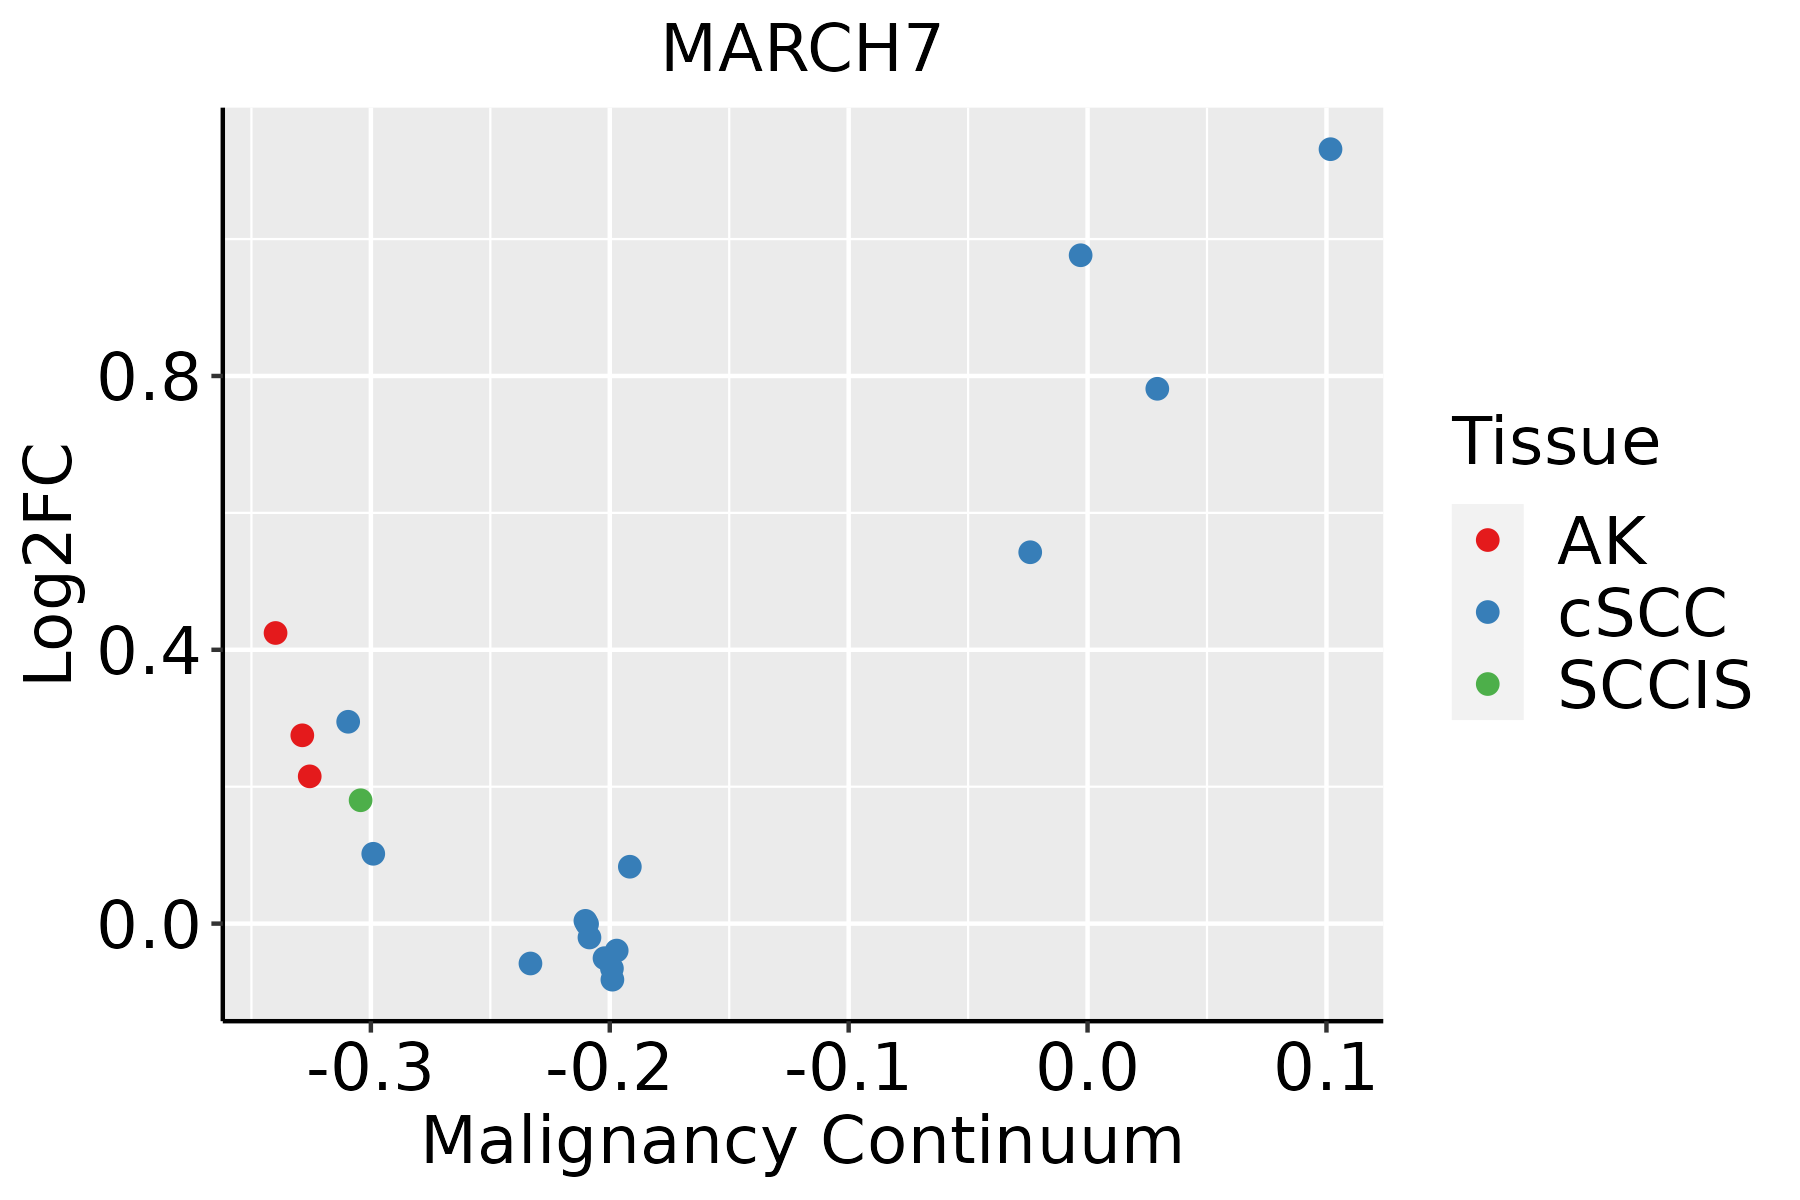 | AK: Actinic keratosis |
| cSCC: Cutaneous squamous cell carcinoma | ||
| SCCIS:squamous cell carcinoma in situ | ||
| Thyroid | 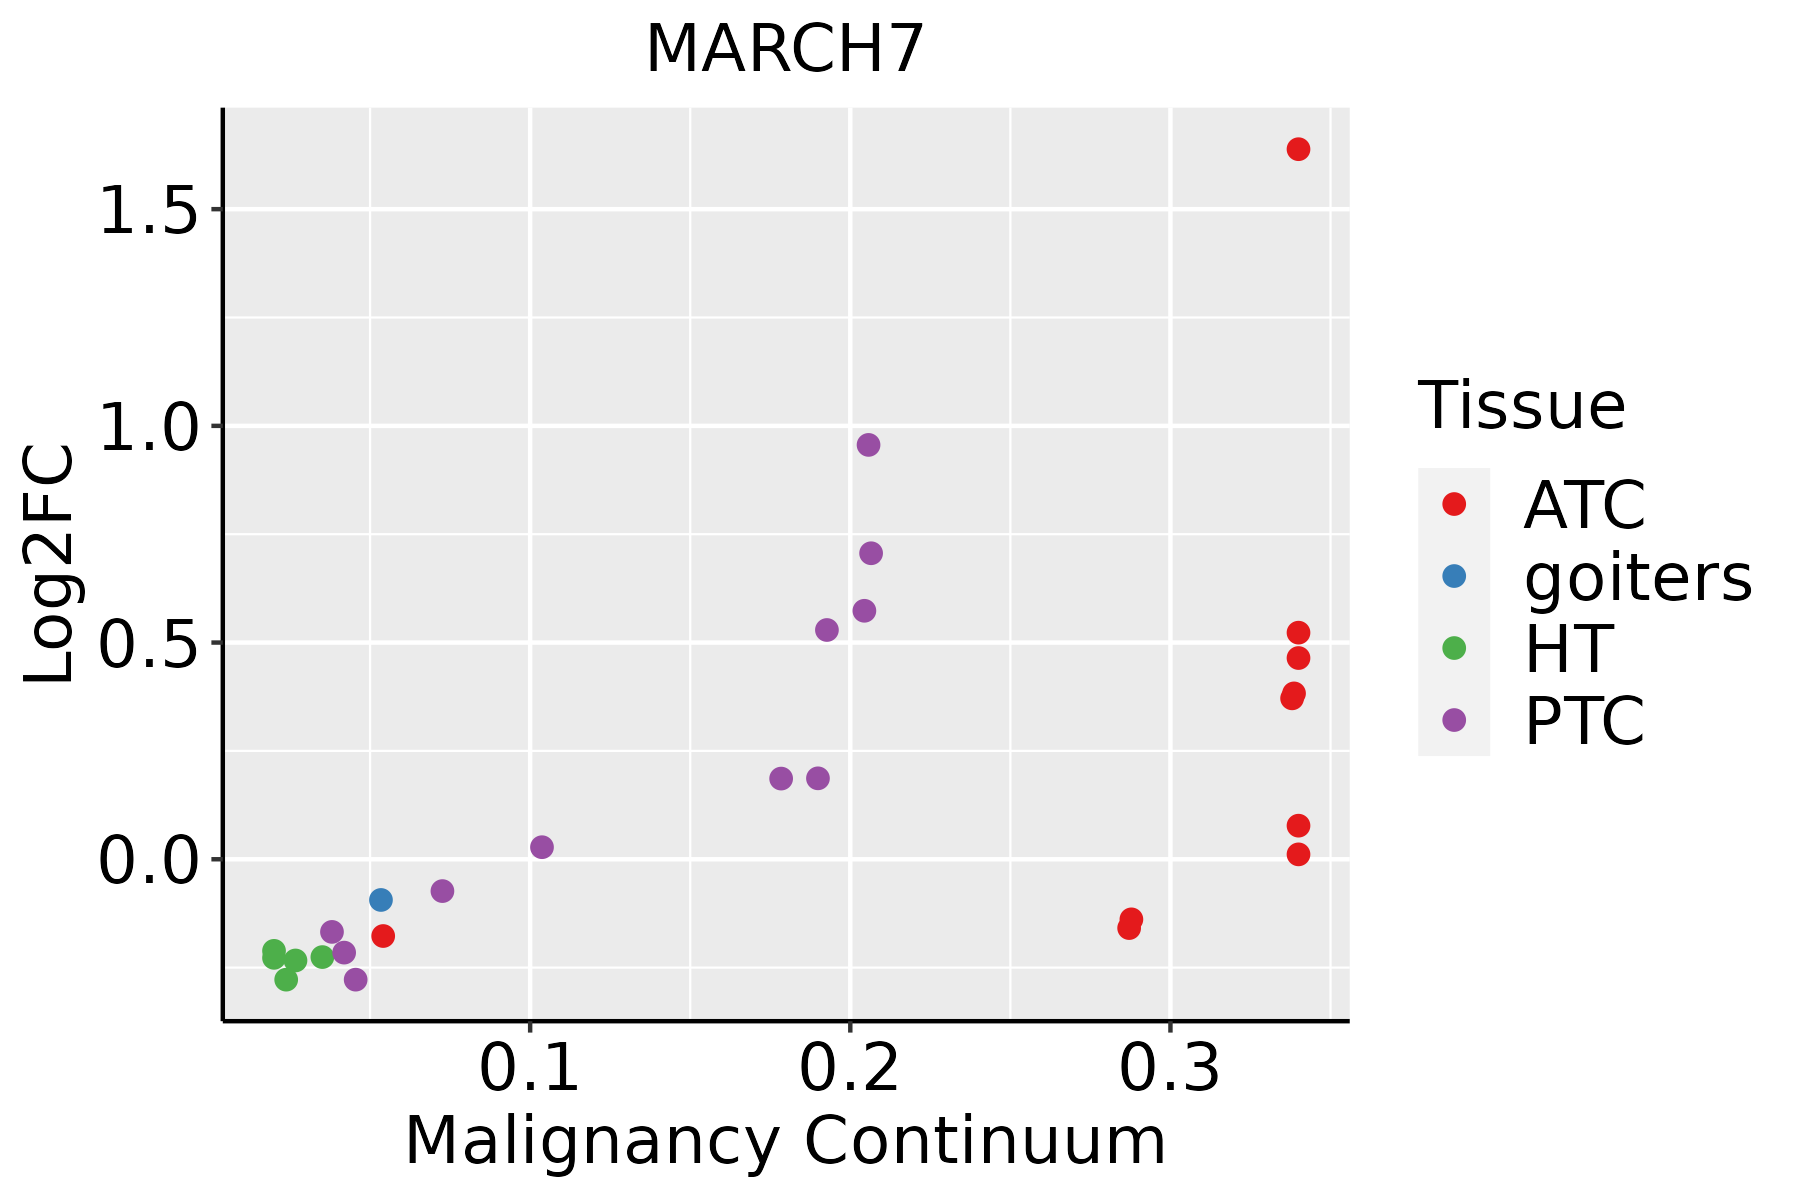 | ATC: Anaplastic thyroid cancer |
| HT: Hashimoto's thyroiditis | ||
| PTC: Papillary thyroid cancer |
| ∗log2FC in expression of this searched gene in stem-like cells from each diseased tissue sample relative to stem-like cells in normal samples in each tissue plotted against the malignancy continuum. Samples are colored based on if they are from different disease stage. |
Top |
Malignant transformation related pathway analysis |
| Find out the enriched GO biological processes and KEGG pathways involved in transition from healthy to precancer to cancer |
| Tissue | Disease Stage | Enriched GO biological Processes |
| Colorectum | AD |  |
| Colorectum | SER |  |
| Colorectum | MSS |  |
| Colorectum | MSI-H |  |
| Colorectum | FAP |  |
| ∗Top 15 enriched GO BP terms are showed in the bar plot of each disease state in each tissue. Each row represents a significant GO biological process which is colored according to the -log10(p.adjust). |
| Page: 1 2 3 4 5 6 7 8 9 |
| GO ID | Tissue | Disease Stage | Description | Gene Ratio | Bg Ratio | pvalue | p.adjust | Count |
| Page: 1 |
| Pathway ID | Tissue | Disease Stage | Description | Gene Ratio | Bg Ratio | pvalue | p.adjust | qvalue | Count |
| Page: 1 |
Top |
Cell-cell communication analysis |
| Identification of potential cell-cell interactions between two cell types and their ligand-receptor pairs for different disease states |
| Ligand | Receptor | LRpair | Pathway | Tissue | Disease Stage |
| Page: 1 |
Top |
Single-cell gene regulatory network inference analysis |
| Find out the significant the regulons (TFs) and the target genes of each regulon across cell types for different disease states |
| TF | Cell Type | Tissue | Disease Stage | Target Gene | RSS | Regulon Activity |
| ∗The dot plots of a searched regulon are shown for all cell subpopulations in each disease state of each tissue based on the regulon specific score inferred using pySCENIC and by calculating the average expression. |
| Page: 1 |
Top |
Somatic mutation of malignant transformation related genes |
| Annotation of somatic variants for genes involved in malignant transformation |
| Hugo Symbol | Variant Class | Variant Classification | dbSNP RS | HGVSc | HGVSp | HGVSp Short | SWISSPROT | BIOTYPE | SIFT | PolyPhen | Tumor Sample Barcode | Tissue | Histology | Sex | Age | Stage | Therapy Types | Drugs | Outcome |
| MARCH7 | SNV | Missense_Mutation | c.145G>C | p.Glu49Gln | p.E49Q | Q9H992 | protein_coding | tolerated(0.38) | benign(0.134) | TCGA-A1-A0SH-01 | Breast | breast invasive carcinoma | Female | <65 | I/II | Chemotherapy | tc | SD | |
| MARCH7 | SNV | Missense_Mutation | c.1349N>T | p.Ala450Val | p.A450V | Q9H992 | protein_coding | tolerated(0.37) | benign(0) | TCGA-A8-A07O-01 | Breast | breast invasive carcinoma | Female | <65 | I/II | Chemotherapy | CR | ||
| MARCH7 | SNV | Missense_Mutation | c.1752N>A | p.Met584Ile | p.M584I | Q9H992 | protein_coding | tolerated(0.54) | probably_damaging(0.968) | TCGA-AO-A0J3-01 | Breast | breast invasive carcinoma | Female | >=65 | I/II | Chemotherapy | cyclophosphamide | SD | |
| MARCH7 | SNV | Missense_Mutation | novel | c.1571N>G | p.Ala524Gly | p.A524G | Q9H992 | protein_coding | tolerated(0.39) | benign(0.061) | TCGA-AQ-A7U7-01 | Breast | breast invasive carcinoma | Female | <65 | III/IV | Targeted Molecular therapy | rituximab | CR |
| MARCH7 | SNV | Missense_Mutation | c.1903N>C | p.Glu635Gln | p.E635Q | Q9H992 | protein_coding | deleterious(0) | probably_damaging(0.986) | TCGA-D8-A1J9-01 | Breast | breast invasive carcinoma | Female | <65 | I/II | Unknown | Unknown | SD | |
| MARCH7 | insertion | In_Frame_Ins | novel | c.1517_1518insCCA | p.Ile506_Ile507insHis | p.I506_I507insH | Q9H992 | protein_coding | TCGA-A8-A08G-01 | Breast | breast invasive carcinoma | Female | <65 | I/II | Chemotherapy | 5-fluorouracil | CR | ||
| MARCH7 | insertion | Nonsense_Mutation | novel | c.1518_1519insACTAAGTTCTAGGGACTCCAGAAATTCTTTAAGATCAA | p.Ile507ThrfsTer4 | p.I507Tfs*4 | Q9H992 | protein_coding | TCGA-A8-A08G-01 | Breast | breast invasive carcinoma | Female | <65 | I/II | Chemotherapy | 5-fluorouracil | CR | ||
| MARCH7 | deletion | Frame_Shift_Del | c.879delN | p.Ser296HisfsTer9 | p.S296Hfs*9 | Q9H992 | protein_coding | TCGA-AN-A0AK-01 | Breast | breast invasive carcinoma | Female | >=65 | I/II | Unknown | Unknown | SD | |||
| MARCH7 | SNV | Missense_Mutation | novel | c.1090N>G | p.His364Asp | p.H364D | Q9H992 | protein_coding | tolerated(0.19) | benign(0.031) | TCGA-VS-A952-01 | Cervix | cervical & endocervical cancer | Female | >=65 | I/II | Unknown | Unknown | SD |
| MARCH7 | SNV | Missense_Mutation | rs756972494 | c.1526N>T | p.Ser509Leu | p.S509L | Q9H992 | protein_coding | tolerated(0.16) | probably_damaging(0.977) | TCGA-VS-A952-01 | Cervix | cervical & endocervical cancer | Female | >=65 | I/II | Unknown | Unknown | SD |
| Page: 1 2 3 4 5 6 7 8 |
Top |
Related drugs of malignant transformation related genes |
| Identification of chemicals and drugs interact with genes involved in malignant transfromation |
| (DGIdb 4.0) |
| Entrez ID | Symbol | Category | Interaction Types | Drug Claim Name | Drug Name | PMIDs |
| Page: 1 |

Copyright 2023-Present -The University of Texas Health Science Center at Houston |