
|
|||||
|
 | |
| |
| |
| |
| |
| |
|
Gene: MARCH6 |
Gene summary for MARCH6 |
| Gene information | Species | Human | Gene symbol | MARCH6 | Gene ID | 10299 |
| Gene name | membrane associated ring-CH-type finger 6 | |
| Gene Alias | DOA10 | |
| Cytomap | 5p15.2 | |
| Gene Type | protein-coding | GO ID | GO:0000209 | UniProtAcc | O60337 |
Top |
Malignant transformation analysis |
| Identification of the aberrant gene expression in precancerous and cancerous lesions by comparing the gene expression of stem-like cells in diseased tissues with normal stem cells |
| Entrez ID | Symbol | Replicates | Species | Organ | Tissue | Adj P-value | Log2FC | Malignancy |
| 10299 | MARCH6 | CCI_1 | Human | Cervix | CC | 4.60e-28 | 1.12e+00 | 0.528 |
| 10299 | MARCH6 | CCI_2 | Human | Cervix | CC | 1.47e-29 | 1.71e+00 | 0.5249 |
| 10299 | MARCH6 | CCI_3 | Human | Cervix | CC | 2.60e-41 | 1.41e+00 | 0.516 |
| 10299 | MARCH6 | CCII_1 | Human | Cervix | CC | 2.83e-13 | 3.36e-01 | 0.3249 |
| 10299 | MARCH6 | Tumor | Human | Cervix | CC | 5.84e-20 | 3.47e-01 | 0.1241 |
| 10299 | MARCH6 | sample1 | Human | Cervix | CC | 1.79e-10 | 3.26e-01 | 0.0959 |
| 10299 | MARCH6 | sample3 | Human | Cervix | CC | 1.49e-37 | 4.82e-01 | 0.1387 |
| 10299 | MARCH6 | H2 | Human | Cervix | HSIL_HPV | 6.70e-14 | 2.99e-01 | 0.0632 |
| 10299 | MARCH6 | L1 | Human | Cervix | CC | 2.42e-03 | 2.28e-01 | 0.0802 |
| 10299 | MARCH6 | T1 | Human | Cervix | CC | 2.35e-17 | 3.48e-01 | 0.0918 |
| 10299 | MARCH6 | T2 | Human | Cervix | CC | 1.25e-04 | 2.37e-01 | 0.0709 |
| 10299 | MARCH6 | T3 | Human | Cervix | CC | 3.08e-34 | 4.59e-01 | 0.1389 |
| 10299 | MARCH6 | HTA11_3410_2000001011 | Human | Colorectum | AD | 5.92e-37 | -8.33e-01 | 0.0155 |
| 10299 | MARCH6 | HTA11_2487_2000001011 | Human | Colorectum | SER | 1.36e-22 | -8.33e-01 | -0.1808 |
| 10299 | MARCH6 | HTA11_2951_2000001011 | Human | Colorectum | AD | 1.22e-05 | -8.33e-01 | 0.0216 |
| 10299 | MARCH6 | HTA11_1938_2000001011 | Human | Colorectum | AD | 1.78e-17 | -8.33e-01 | -0.0811 |
| 10299 | MARCH6 | HTA11_78_2000001011 | Human | Colorectum | AD | 2.50e-26 | -8.33e-01 | -0.1088 |
| 10299 | MARCH6 | HTA11_347_2000001011 | Human | Colorectum | AD | 1.61e-39 | -8.33e-01 | -0.1954 |
| 10299 | MARCH6 | HTA11_411_2000001011 | Human | Colorectum | SER | 2.11e-03 | -8.33e-01 | -0.2602 |
| 10299 | MARCH6 | HTA11_2112_2000001011 | Human | Colorectum | SER | 7.71e-05 | -8.33e-01 | -0.2196 |
| Page: 1 2 3 4 5 6 7 8 9 10 11 12 |
| Tissue | Expression Dynamics | Abbreviation |
| Cervix | 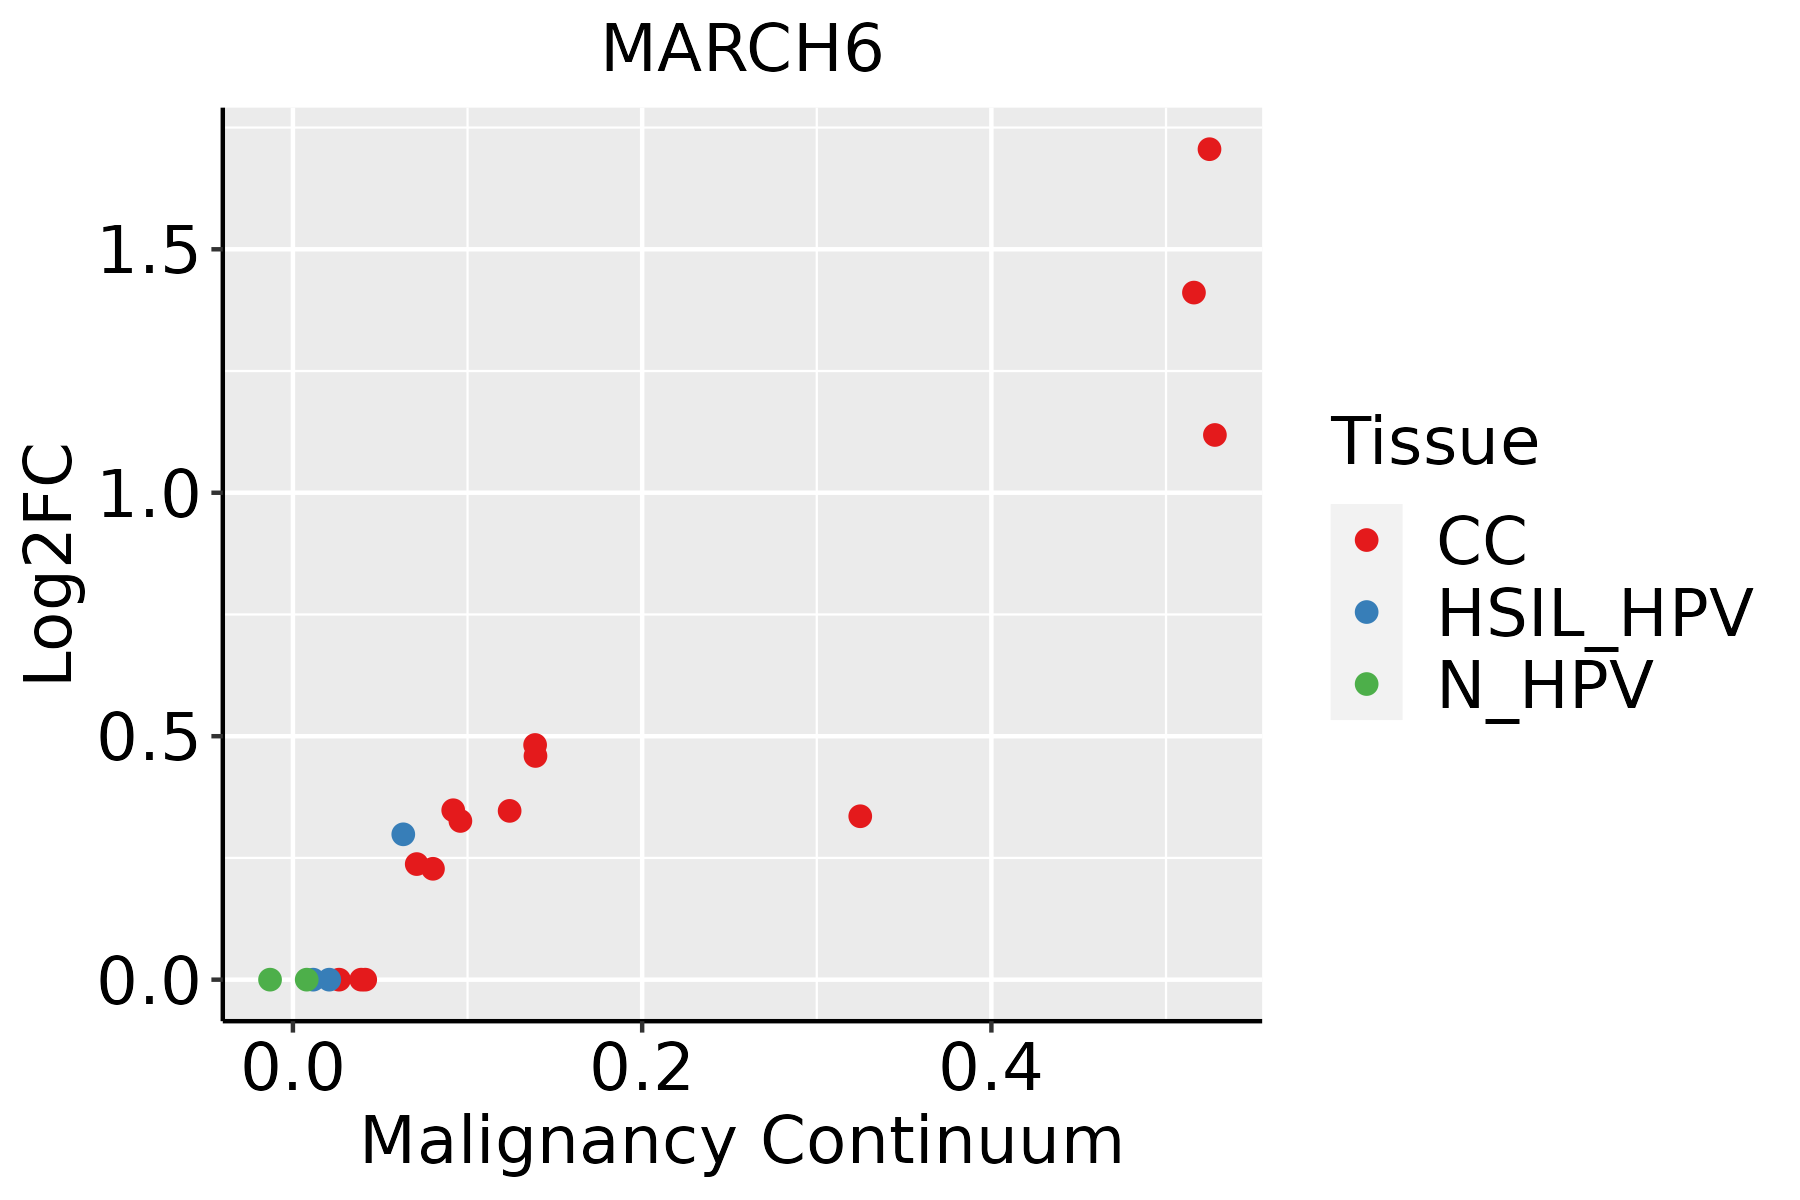 | CC: Cervix cancer |
| HSIL_HPV: HPV-infected high-grade squamous intraepithelial lesions | ||
| N_HPV: HPV-infected normal cervix | ||
| Colorectum (GSE201348) |  | FAP: Familial adenomatous polyposis |
| CRC: Colorectal cancer | ||
| Colorectum (HTA11) |  | AD: Adenomas |
| SER: Sessile serrated lesions | ||
| MSI-H: Microsatellite-high colorectal cancer | ||
| MSS: Microsatellite stable colorectal cancer | ||
| Esophagus |  | ESCC: Esophageal squamous cell carcinoma |
| HGIN: High-grade intraepithelial neoplasias | ||
| LGIN: Low-grade intraepithelial neoplasias | ||
| Liver | 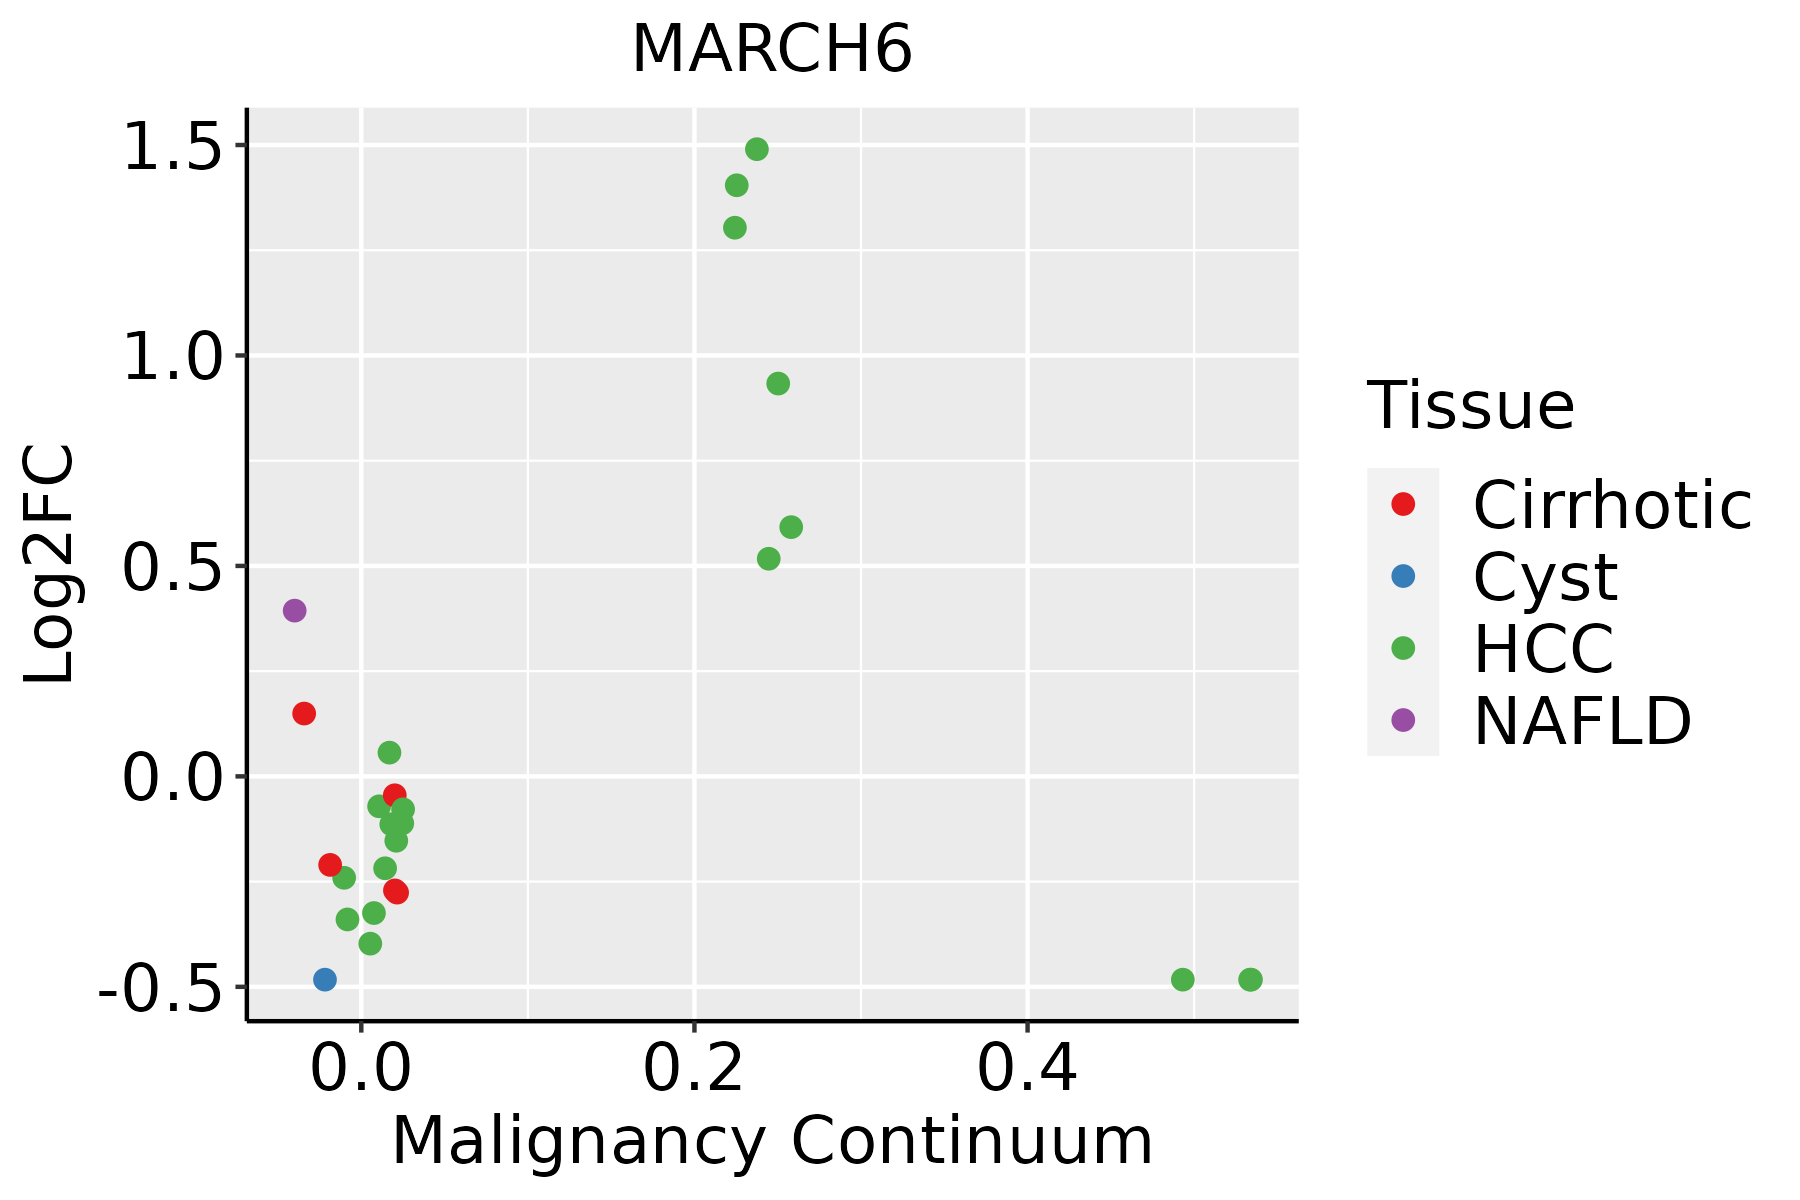 | HCC: Hepatocellular carcinoma |
| NAFLD: Non-alcoholic fatty liver disease | ||
| Lung |  | AAH: Atypical adenomatous hyperplasia |
| AIS: Adenocarcinoma in situ | ||
| IAC: Invasive lung adenocarcinoma | ||
| MIA: Minimally invasive adenocarcinoma | ||
| Oral Cavity | 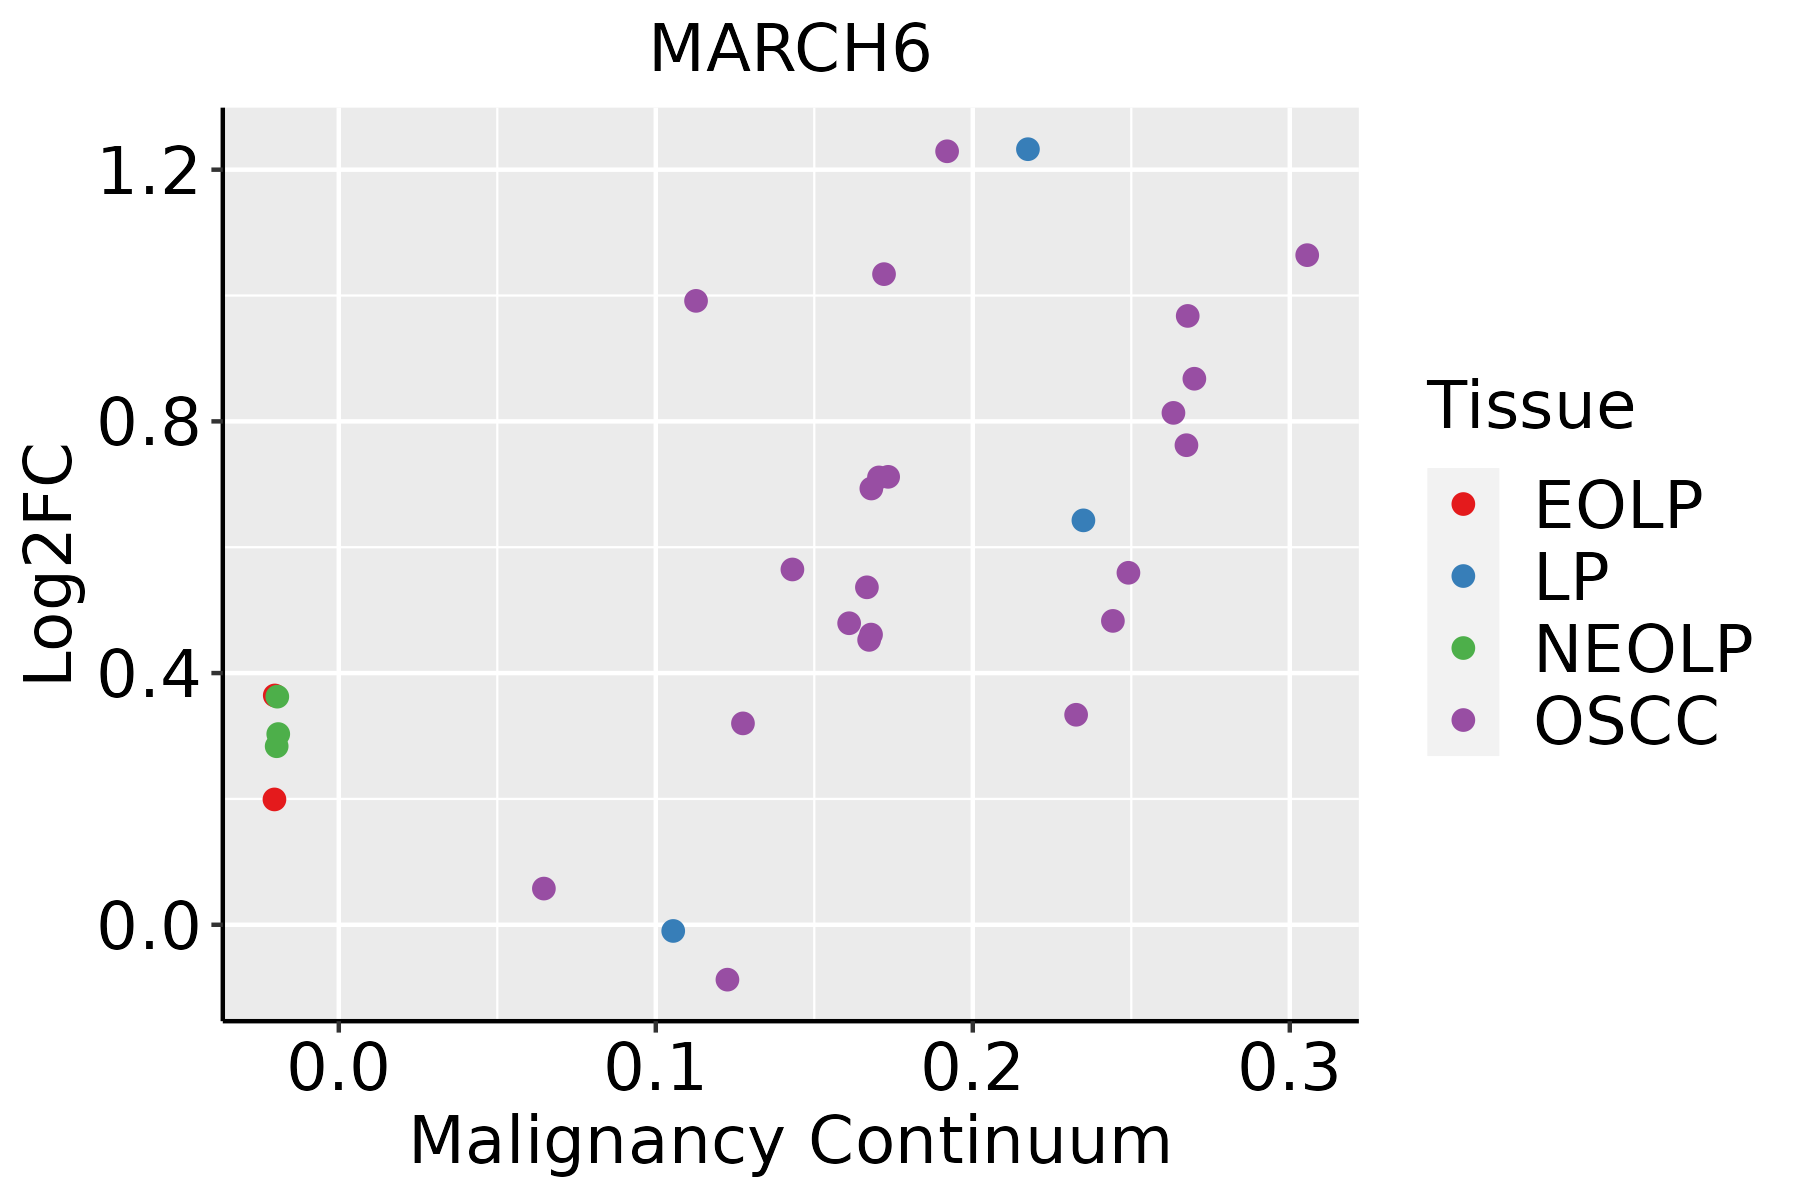 | EOLP: Erosive Oral lichen planus |
| LP: leukoplakia | ||
| NEOLP: Non-erosive oral lichen planus | ||
| OSCC: Oral squamous cell carcinoma | ||
| Prostate | 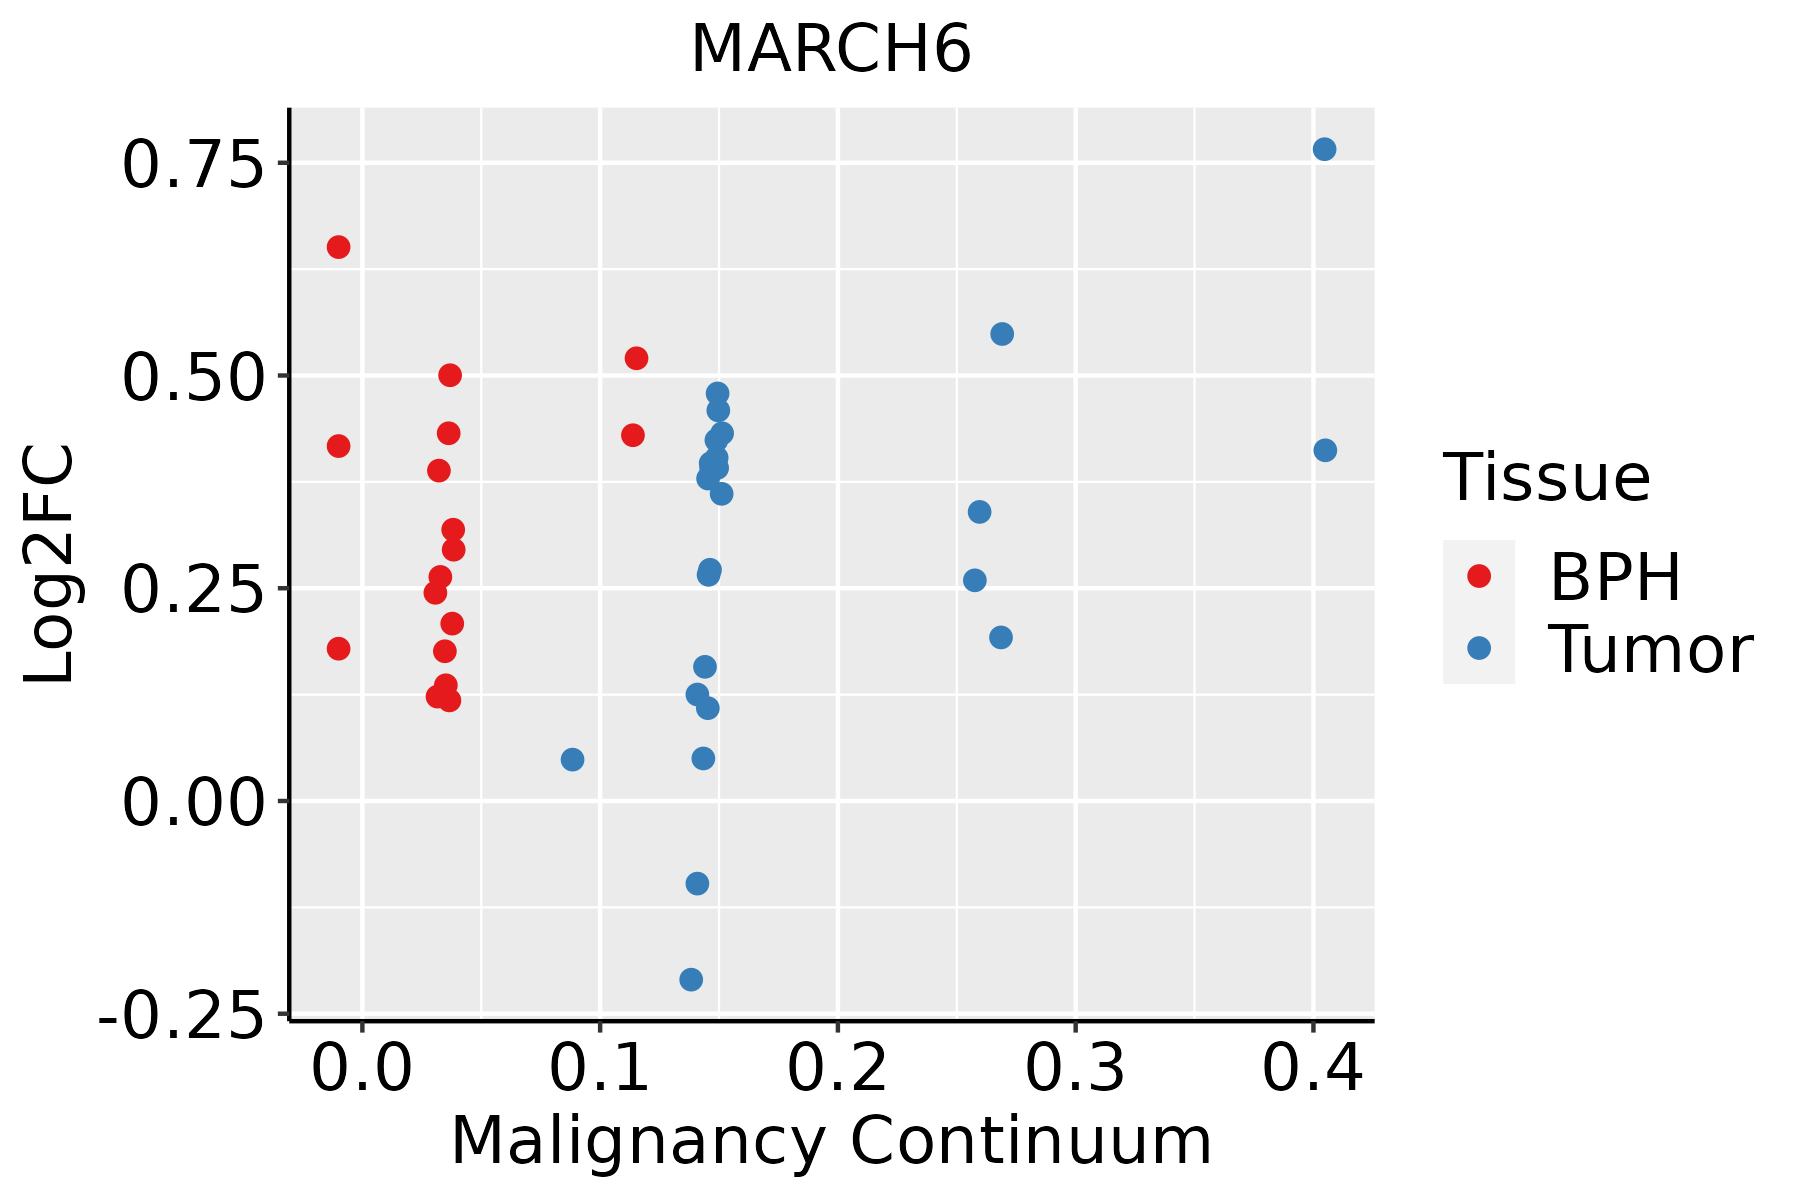 | BPH: Benign Prostatic Hyperplasia |
| Skin |  | AK: Actinic keratosis |
| cSCC: Cutaneous squamous cell carcinoma | ||
| SCCIS:squamous cell carcinoma in situ | ||
| Thyroid | 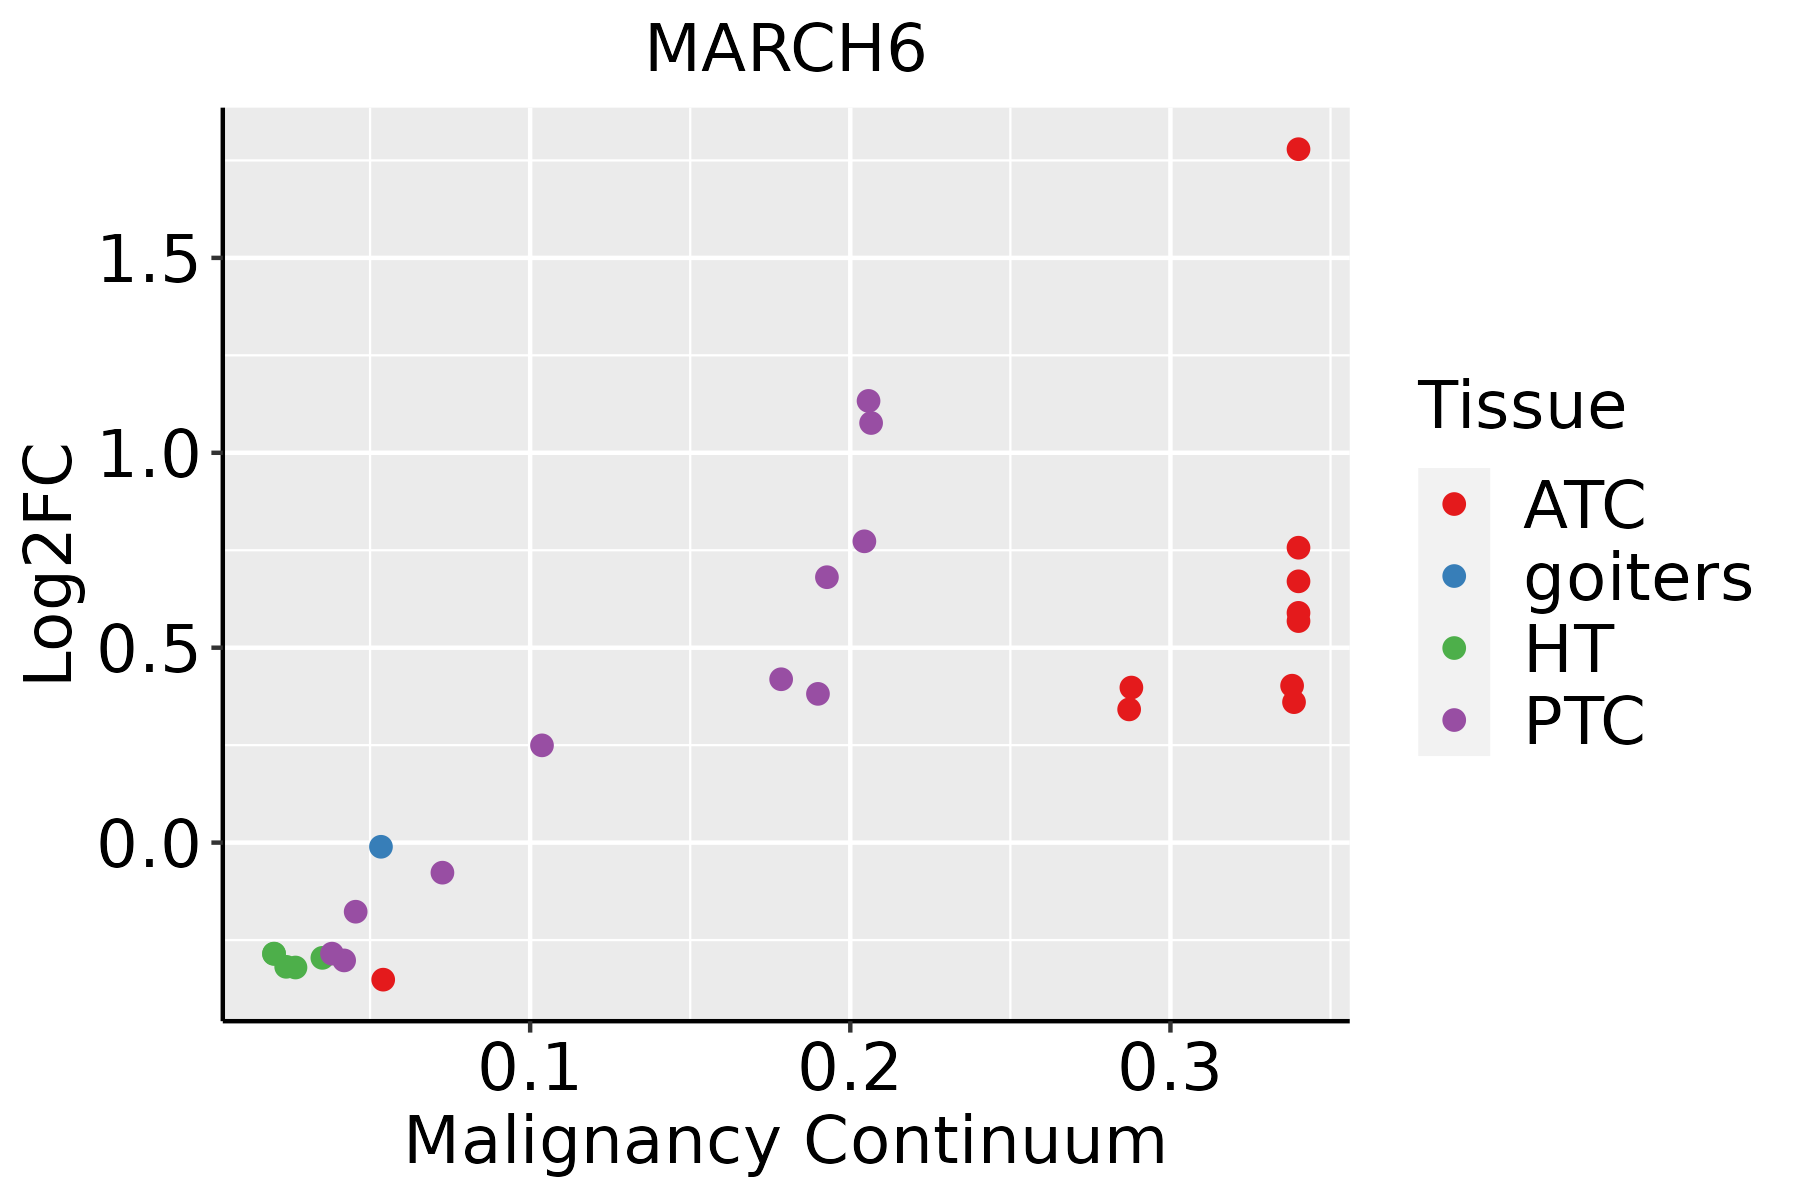 | ATC: Anaplastic thyroid cancer |
| HT: Hashimoto's thyroiditis | ||
| PTC: Papillary thyroid cancer |
| ∗log2FC in expression of this searched gene in stem-like cells from each diseased tissue sample relative to stem-like cells in normal samples in each tissue plotted against the malignancy continuum. Samples are colored based on if they are from different disease stage. |
Top |
Malignant transformation related pathway analysis |
| Find out the enriched GO biological processes and KEGG pathways involved in transition from healthy to precancer to cancer |
| Tissue | Disease Stage | Enriched GO biological Processes |
| Colorectum | AD |  |
| Colorectum | SER |  |
| Colorectum | MSS |  |
| Colorectum | MSI-H |  |
| Colorectum | FAP |  |
| ∗Top 15 enriched GO BP terms are showed in the bar plot of each disease state in each tissue. Each row represents a significant GO biological process which is colored according to the -log10(p.adjust). |
| Page: 1 2 3 4 5 6 7 8 9 |
| GO ID | Tissue | Disease Stage | Description | Gene Ratio | Bg Ratio | pvalue | p.adjust | Count |
| Page: 1 |
| Pathway ID | Tissue | Disease Stage | Description | Gene Ratio | Bg Ratio | pvalue | p.adjust | qvalue | Count |
| hsa04141 | Colorectum | AD | Protein processing in endoplasmic reticulum | 80/2092 | 174/8465 | 5.96e-10 | 1.25e-08 | 7.96e-09 | 80 |
| hsa041411 | Colorectum | AD | Protein processing in endoplasmic reticulum | 80/2092 | 174/8465 | 5.96e-10 | 1.25e-08 | 7.96e-09 | 80 |
| hsa041412 | Colorectum | SER | Protein processing in endoplasmic reticulum | 60/1580 | 174/8465 | 4.20e-07 | 7.33e-06 | 5.32e-06 | 60 |
| hsa041413 | Colorectum | SER | Protein processing in endoplasmic reticulum | 60/1580 | 174/8465 | 4.20e-07 | 7.33e-06 | 5.32e-06 | 60 |
| Page: 1 |
Top |
Cell-cell communication analysis |
| Identification of potential cell-cell interactions between two cell types and their ligand-receptor pairs for different disease states |
| Ligand | Receptor | LRpair | Pathway | Tissue | Disease Stage |
| Page: 1 |
Top |
Single-cell gene regulatory network inference analysis |
| Find out the significant the regulons (TFs) and the target genes of each regulon across cell types for different disease states |
| TF | Cell Type | Tissue | Disease Stage | Target Gene | RSS | Regulon Activity |
| ∗The dot plots of a searched regulon are shown for all cell subpopulations in each disease state of each tissue based on the regulon specific score inferred using pySCENIC and by calculating the average expression. |
| Page: 1 |
Top |
Somatic mutation of malignant transformation related genes |
| Annotation of somatic variants for genes involved in malignant transformation |
| Hugo Symbol | Variant Class | Variant Classification | dbSNP RS | HGVSc | HGVSp | HGVSp Short | SWISSPROT | BIOTYPE | SIFT | PolyPhen | Tumor Sample Barcode | Tissue | Histology | Sex | Age | Stage | Therapy Types | Drugs | Outcome |
| MARCH6 | SNV | Missense_Mutation | novel | c.838N>G | p.Leu280Val | p.L280V | O60337 | protein_coding | deleterious(0) | probably_damaging(0.999) | TCGA-AR-A251-01 | Breast | breast invasive carcinoma | Female | <65 | III/IV | Chemotherapy | doxorubicin | SD |
| MARCH6 | insertion | Frame_Shift_Ins | novel | c.1410_1411insAAAGTGTTATTTAATT | p.Leu471LysfsTer10 | p.L471Kfs*10 | O60337 | protein_coding | TCGA-AR-A0TY-01 | Breast | breast invasive carcinoma | Female | <65 | I/II | Unspecific | Paclitaxel | PD | ||
| MARCH6 | insertion | Frame_Shift_Ins | novel | c.1526_1527insCAGAAGAAGAAATTACATAGTTAAA | p.Leu510ArgfsTer18 | p.L510Rfs*18 | O60337 | protein_coding | TCGA-BH-A0H9-01 | Breast | breast invasive carcinoma | Female | >=65 | I/II | Hormone Therapy | arimidex | SD | ||
| MARCH6 | insertion | Frame_Shift_Ins | novel | c.2558dupT | p.Leu853PhefsTer19 | p.L853Ffs*19 | O60337 | protein_coding | TCGA-BH-A18G-01 | Breast | breast invasive carcinoma | Female | >=65 | I/II | Unknown | Unknown | SD | ||
| MARCH6 | SNV | Missense_Mutation | c.922C>T | p.Pro308Ser | p.P308S | O60337 | protein_coding | deleterious(0) | probably_damaging(0.992) | TCGA-2W-A8YY-01 | Cervix | cervical & endocervical cancer | Female | <65 | I/II | Chemotherapy | cisplatin | CR | |
| MARCH6 | SNV | Missense_Mutation | c.55N>A | p.Glu19Lys | p.E19K | O60337 | protein_coding | deleterious(0) | benign(0.052) | TCGA-BI-A0VR-01 | Cervix | cervical & endocervical cancer | Female | <65 | III/IV | Unknown | Unknown | SD | |
| MARCH6 | SNV | Missense_Mutation | c.2263C>G | p.Pro755Ala | p.P755A | O60337 | protein_coding | deleterious(0.01) | possibly_damaging(0.527) | TCGA-C5-A1M6-01 | Cervix | cervical & endocervical cancer | Female | <65 | I/II | Chemotherapy | cisplatin | PD | |
| MARCH6 | SNV | Missense_Mutation | c.1979N>A | p.Arg660His | p.R660H | O60337 | protein_coding | deleterious(0) | probably_damaging(0.998) | TCGA-C5-A1MN-01 | Cervix | cervical & endocervical cancer | Female | <65 | III/IV | Chemotherapy | cisplatin | SD | |
| MARCH6 | SNV | Missense_Mutation | novel | c.565N>T | p.His189Tyr | p.H189Y | O60337 | protein_coding | deleterious(0.05) | benign(0.003) | TCGA-HM-A4S6-01 | Cervix | cervical & endocervical cancer | Female | <65 | III/IV | Chemotherapy | cisplatin | CR |
| MARCH6 | SNV | Missense_Mutation | c.55N>C | p.Glu19Gln | p.E19Q | O60337 | protein_coding | deleterious(0) | benign(0.096) | TCGA-IR-A3LK-01 | Cervix | cervical & endocervical cancer | Female | >=65 | I/II | Chemotherapy | cisplatin | PD |
| Page: 1 2 3 4 5 6 7 8 9 10 11 |
Top |
Related drugs of malignant transformation related genes |
| Identification of chemicals and drugs interact with genes involved in malignant transfromation |
| (DGIdb 4.0) |
| Entrez ID | Symbol | Category | Interaction Types | Drug Claim Name | Drug Name | PMIDs |
| Page: 1 |

Copyright 2023-Present -The University of Texas Health Science Center at Houston |