
|
|||||
|
 | |
| |
| |
| |
| |
| |
|
Gene: MARCH2 |
Gene summary for MARCH2 |
| Gene information | Species | Human | Gene symbol | MARCH2 | Gene ID | 51257 |
| Gene name | membrane associated ring-CH-type finger 2 | |
| Gene Alias | HSPC240 | |
| Cytomap | 19p13.2 | |
| Gene Type | protein-coding | GO ID | GO:0006464 | UniProtAcc | Q9P0N8 |
Top |
Malignant transformation analysis |
| Identification of the aberrant gene expression in precancerous and cancerous lesions by comparing the gene expression of stem-like cells in diseased tissues with normal stem cells |
| Entrez ID | Symbol | Replicates | Species | Organ | Tissue | Adj P-value | Log2FC | Malignancy |
| 51257 | MARCH2 | P1T-E | Human | Esophagus | ESCC | 5.41e-03 | 2.05e-01 | 0.0875 |
| 51257 | MARCH2 | P4T-E | Human | Esophagus | ESCC | 4.05e-06 | 1.59e-01 | 0.1323 |
| 51257 | MARCH2 | P5T-E | Human | Esophagus | ESCC | 2.98e-04 | 9.57e-02 | 0.1327 |
| 51257 | MARCH2 | P8T-E | Human | Esophagus | ESCC | 2.52e-06 | 1.13e-01 | 0.0889 |
| 51257 | MARCH2 | P9T-E | Human | Esophagus | ESCC | 2.33e-10 | 2.72e-01 | 0.1131 |
| 51257 | MARCH2 | P10T-E | Human | Esophagus | ESCC | 4.77e-08 | 1.07e-01 | 0.116 |
| 51257 | MARCH2 | P11T-E | Human | Esophagus | ESCC | 1.36e-02 | 2.05e-01 | 0.1426 |
| 51257 | MARCH2 | P12T-E | Human | Esophagus | ESCC | 1.15e-03 | 7.46e-02 | 0.1122 |
| 51257 | MARCH2 | P15T-E | Human | Esophagus | ESCC | 3.95e-02 | 9.31e-02 | 0.1149 |
| 51257 | MARCH2 | P21T-E | Human | Esophagus | ESCC | 2.88e-05 | 9.31e-02 | 0.1617 |
| 51257 | MARCH2 | P23T-E | Human | Esophagus | ESCC | 7.94e-12 | 3.32e-01 | 0.108 |
| 51257 | MARCH2 | P24T-E | Human | Esophagus | ESCC | 6.69e-11 | 1.93e-01 | 0.1287 |
| 51257 | MARCH2 | P26T-E | Human | Esophagus | ESCC | 2.10e-04 | 9.20e-02 | 0.1276 |
| 51257 | MARCH2 | P27T-E | Human | Esophagus | ESCC | 3.39e-05 | 1.40e-01 | 0.1055 |
| 51257 | MARCH2 | P28T-E | Human | Esophagus | ESCC | 4.23e-18 | 3.70e-01 | 0.1149 |
| 51257 | MARCH2 | P30T-E | Human | Esophagus | ESCC | 2.26e-05 | 2.63e-01 | 0.137 |
| 51257 | MARCH2 | P32T-E | Human | Esophagus | ESCC | 1.96e-02 | 6.12e-02 | 0.1666 |
| 51257 | MARCH2 | P39T-E | Human | Esophagus | ESCC | 9.19e-08 | 2.15e-01 | 0.0894 |
| 51257 | MARCH2 | P40T-E | Human | Esophagus | ESCC | 6.47e-09 | 2.81e-01 | 0.109 |
| 51257 | MARCH2 | P47T-E | Human | Esophagus | ESCC | 3.90e-16 | 1.40e-01 | 0.1067 |
| Page: 1 2 3 |
| Tissue | Expression Dynamics | Abbreviation |
| Esophagus |  | ESCC: Esophageal squamous cell carcinoma |
| HGIN: High-grade intraepithelial neoplasias | ||
| LGIN: Low-grade intraepithelial neoplasias | ||
| Oral Cavity | 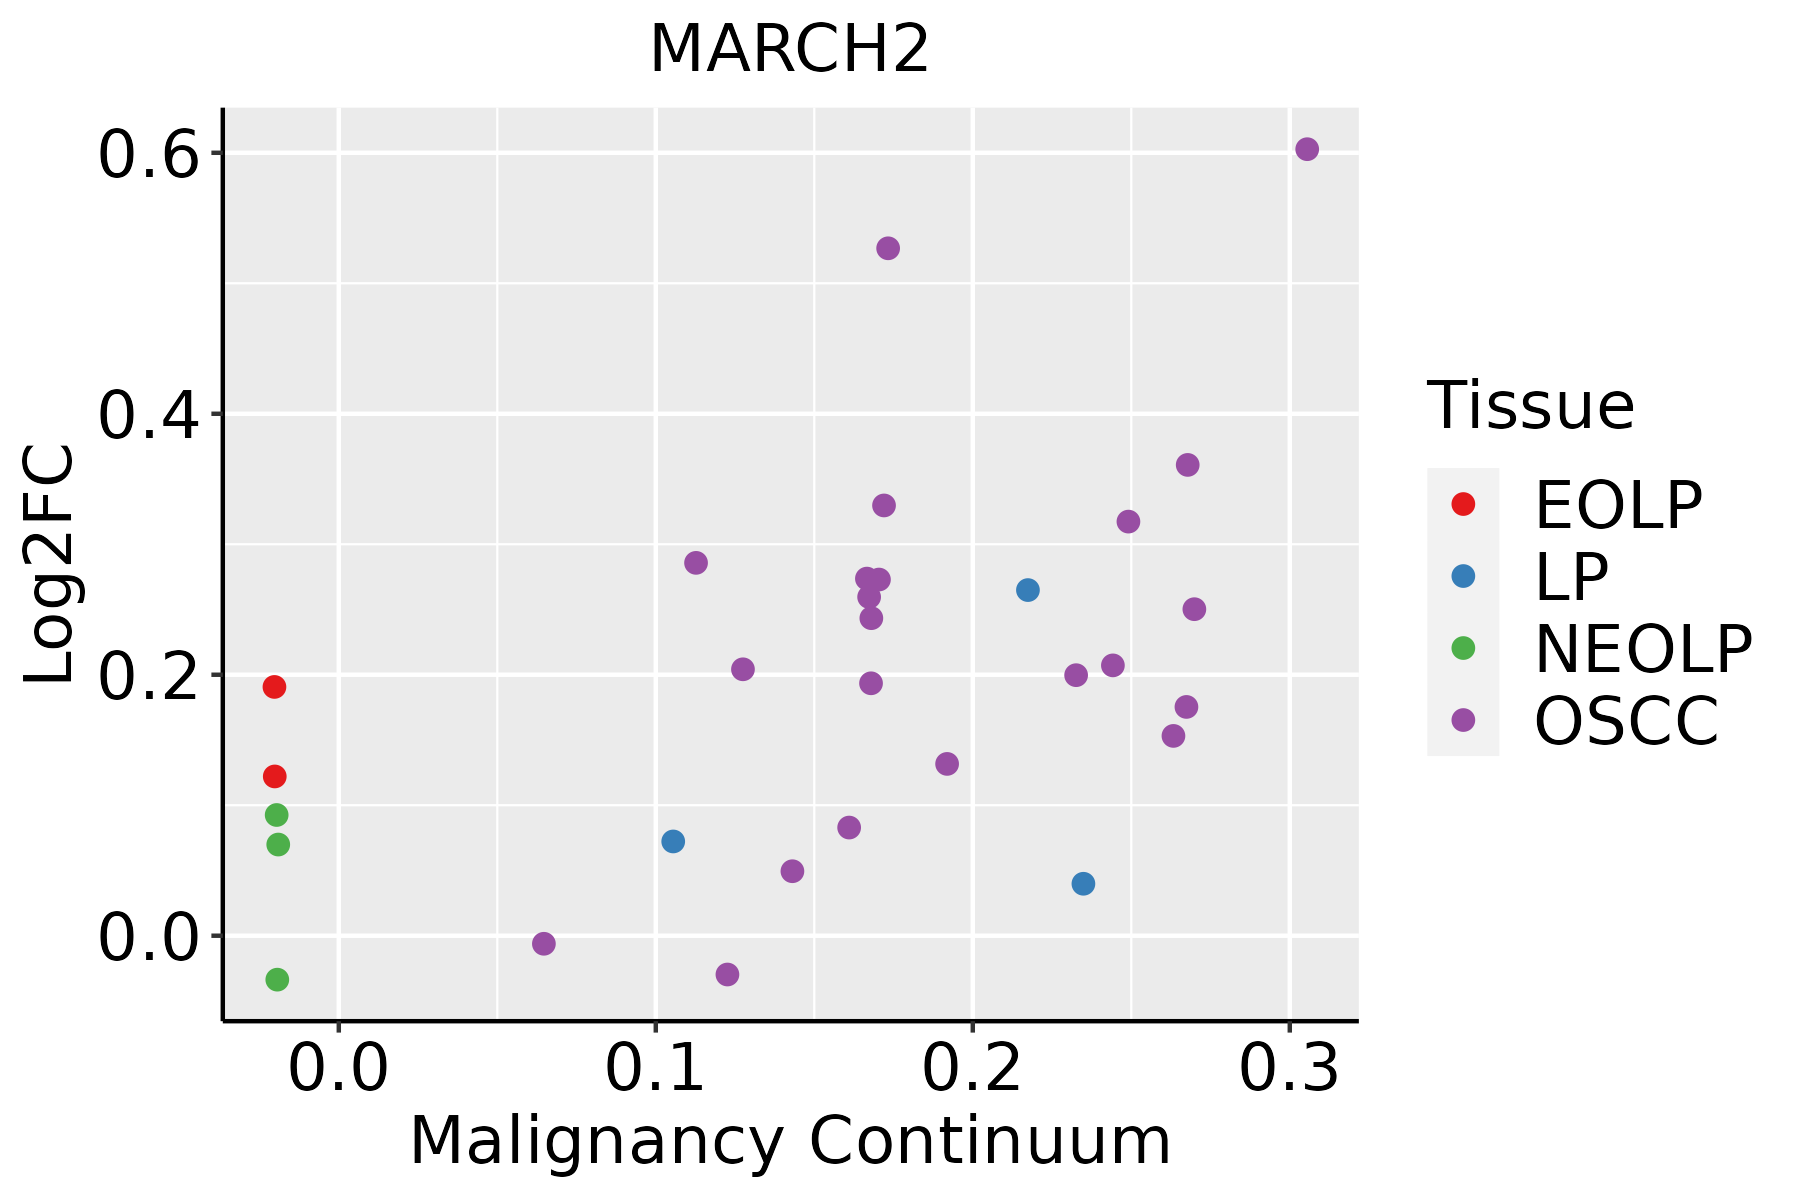 | EOLP: Erosive Oral lichen planus |
| LP: leukoplakia | ||
| NEOLP: Non-erosive oral lichen planus | ||
| OSCC: Oral squamous cell carcinoma | ||
| Thyroid | 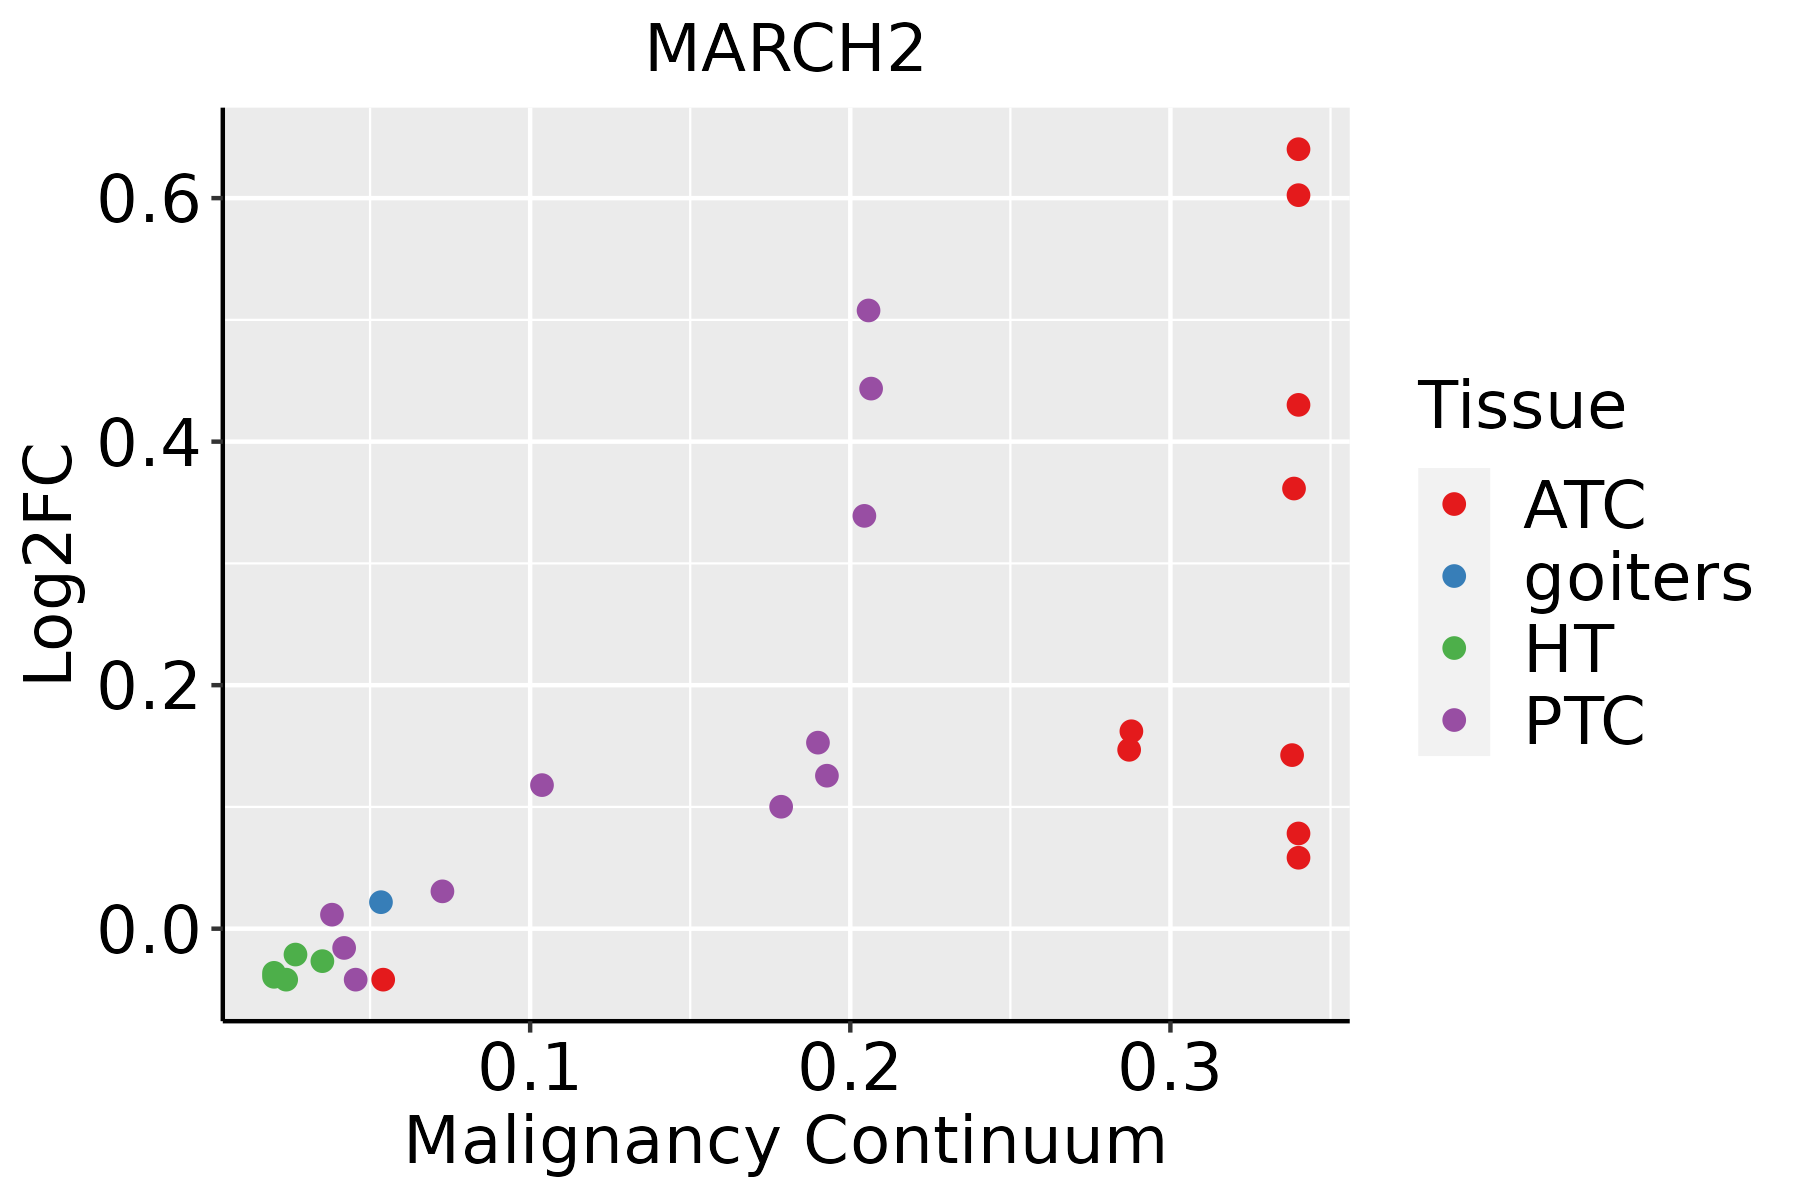 | ATC: Anaplastic thyroid cancer |
| HT: Hashimoto's thyroiditis | ||
| PTC: Papillary thyroid cancer |
| ∗log2FC in expression of this searched gene in stem-like cells from each diseased tissue sample relative to stem-like cells in normal samples in each tissue plotted against the malignancy continuum. Samples are colored based on if they are from different disease stage. |
Top |
Malignant transformation related pathway analysis |
| Find out the enriched GO biological processes and KEGG pathways involved in transition from healthy to precancer to cancer |
| Tissue | Disease Stage | Enriched GO biological Processes |
| Colorectum | AD |  |
| Colorectum | SER |  |
| Colorectum | MSS |  |
| Colorectum | MSI-H |  |
| Colorectum | FAP |  |
| ∗Top 15 enriched GO BP terms are showed in the bar plot of each disease state in each tissue. Each row represents a significant GO biological process which is colored according to the -log10(p.adjust). |
| Page: 1 2 3 4 5 6 7 8 9 |
| GO ID | Tissue | Disease Stage | Description | Gene Ratio | Bg Ratio | pvalue | p.adjust | Count |
| Page: 1 |
| Pathway ID | Tissue | Disease Stage | Description | Gene Ratio | Bg Ratio | pvalue | p.adjust | qvalue | Count |
| Page: 1 |
Top |
Cell-cell communication analysis |
| Identification of potential cell-cell interactions between two cell types and their ligand-receptor pairs for different disease states |
| Ligand | Receptor | LRpair | Pathway | Tissue | Disease Stage |
| Page: 1 |
Top |
Single-cell gene regulatory network inference analysis |
| Find out the significant the regulons (TFs) and the target genes of each regulon across cell types for different disease states |
| TF | Cell Type | Tissue | Disease Stage | Target Gene | RSS | Regulon Activity |
| ∗The dot plots of a searched regulon are shown for all cell subpopulations in each disease state of each tissue based on the regulon specific score inferred using pySCENIC and by calculating the average expression. |
| Page: 1 |
Top |
Somatic mutation of malignant transformation related genes |
| Annotation of somatic variants for genes involved in malignant transformation |
| Hugo Symbol | Variant Class | Variant Classification | dbSNP RS | HGVSc | HGVSp | HGVSp Short | SWISSPROT | BIOTYPE | SIFT | PolyPhen | Tumor Sample Barcode | Tissue | Histology | Sex | Age | Stage | Therapy Types | Drugs | Outcome |
| MARCH2 | SNV | Missense_Mutation | rs756353048 | c.644N>A | p.Arg215His | p.R215H | Q9P0N8 | protein_coding | tolerated(0.16) | benign(0.019) | TCGA-2W-A8YY-01 | Cervix | cervical & endocervical cancer | Female | <65 | I/II | Chemotherapy | cisplatin | CR |
| MARCH2 | SNV | Missense_Mutation | c.207N>T | p.Glu69Asp | p.E69D | Q9P0N8 | protein_coding | tolerated(0.12) | possibly_damaging(0.85) | TCGA-AD-6889-01 | Colorectum | colon adenocarcinoma | Male | >=65 | I/II | Chemotherapy | xeloda | PD | |
| MARCH2 | SNV | Missense_Mutation | c.484N>A | p.Gly162Arg | p.G162R | Q9P0N8 | protein_coding | deleterious(0) | possibly_damaging(0.88) | TCGA-QG-A5Z2-01 | Colorectum | colon adenocarcinoma | Male | <65 | I/II | Unknown | Unknown | SD | |
| MARCH2 | SNV | Missense_Mutation | rs141281179 | c.52N>A | p.Gly18Ser | p.G18S | Q9P0N8 | protein_coding | tolerated_low_confidence(0.39) | benign(0) | TCGA-WS-AB45-01 | Colorectum | colon adenocarcinoma | Female | <65 | I/II | Unknown | Unknown | SD |
| MARCH2 | SNV | Missense_Mutation | rs766297047 | c.105N>T | p.Gln35His | p.Q35H | Q9P0N8 | protein_coding | deleterious(0.05) | possibly_damaging(0.781) | TCGA-A5-A1OF-01 | Endometrium | uterine corpus endometrioid carcinoma | Female | <65 | I/II | Unknown | Unknown | SD |
| MARCH2 | SNV | Missense_Mutation | novel | c.636N>T | p.Gln212His | p.Q212H | Q9P0N8 | protein_coding | deleterious(0.02) | possibly_damaging(0.754) | TCGA-AX-A2HC-01 | Endometrium | uterine corpus endometrioid carcinoma | Female | <65 | III/IV | Chemotherapy | paclitaxel | PD |
| MARCH2 | SNV | Missense_Mutation | c.662C>T | p.Ala221Val | p.A221V | Q9P0N8 | protein_coding | tolerated(0.14) | benign(0) | TCGA-B5-A0K9-01 | Endometrium | uterine corpus endometrioid carcinoma | Female | >=65 | I/II | Unknown | Unknown | SD | |
| MARCH2 | SNV | Missense_Mutation | novel | c.371N>G | p.Glu124Gly | p.E124G | Q9P0N8 | protein_coding | deleterious(0) | benign(0.081) | TCGA-B5-A1MX-01 | Endometrium | uterine corpus endometrioid carcinoma | Female | <65 | I/II | Hormone Therapy | megace | SD |
| MARCH2 | SNV | Missense_Mutation | rs773208899 | c.265N>A | p.Val89Met | p.V89M | Q9P0N8 | protein_coding | deleterious(0.01) | probably_damaging(0.999) | TCGA-D1-A103-01 | Endometrium | uterine corpus endometrioid carcinoma | Female | >=65 | I/II | Unknown | Unknown | SD |
| MARCH2 | SNV | Missense_Mutation | rs752865793 | c.643N>T | p.Arg215Cys | p.R215C | Q9P0N8 | protein_coding | tolerated(0.06) | possibly_damaging(0.745) | TCGA-D1-A103-01 | Endometrium | uterine corpus endometrioid carcinoma | Female | >=65 | I/II | Unknown | Unknown | SD |
| Page: 1 2 |
Top |
Related drugs of malignant transformation related genes |
| Identification of chemicals and drugs interact with genes involved in malignant transfromation |
| (DGIdb 4.0) |
| Entrez ID | Symbol | Category | Interaction Types | Drug Claim Name | Drug Name | PMIDs |
| Page: 1 |

Copyright 2023-Present -The University of Texas Health Science Center at Houston |