
|
|||||
|
 | |
| |
| |
| |
| |
| |
|
Gene: MAPT |
Gene summary for MAPT |
| Gene information | Species | Human | Gene symbol | MAPT | Gene ID | 4137 |
| Gene name | microtubule associated protein tau | |
| Gene Alias | DDPAC | |
| Cytomap | 17q21.31 | |
| Gene Type | protein-coding | GO ID | GO:0000226 | UniProtAcc | P10636 |
Top |
Malignant transformation analysis |
| Identification of the aberrant gene expression in precancerous and cancerous lesions by comparing the gene expression of stem-like cells in diseased tissues with normal stem cells |
| Entrez ID | Symbol | Replicates | Species | Organ | Tissue | Adj P-value | Log2FC | Malignancy |
| 4137 | MAPT | HCC1_Meng | Human | Liver | HCC | 4.34e-02 | 3.80e-03 | 0.0246 |
| 4137 | MAPT | HCC2 | Human | Liver | HCC | 6.87e-10 | 2.91e+00 | 0.5341 |
| 4137 | MAPT | Pt13.b | Human | Liver | HCC | 3.88e-02 | 5.85e-02 | 0.0251 |
| 4137 | MAPT | S014 | Human | Liver | HCC | 2.80e-11 | 4.75e-01 | 0.2254 |
| 4137 | MAPT | S015 | Human | Liver | HCC | 2.23e-09 | 4.70e-01 | 0.2375 |
| 4137 | MAPT | S016 | Human | Liver | HCC | 5.22e-18 | 5.05e-01 | 0.2243 |
| 4137 | MAPT | S028 | Human | Liver | HCC | 6.19e-15 | 4.54e-01 | 0.2503 |
| 4137 | MAPT | S029 | Human | Liver | HCC | 9.92e-09 | 3.27e-01 | 0.2581 |
| Page: 1 |
| Tissue | Expression Dynamics | Abbreviation |
| Liver | 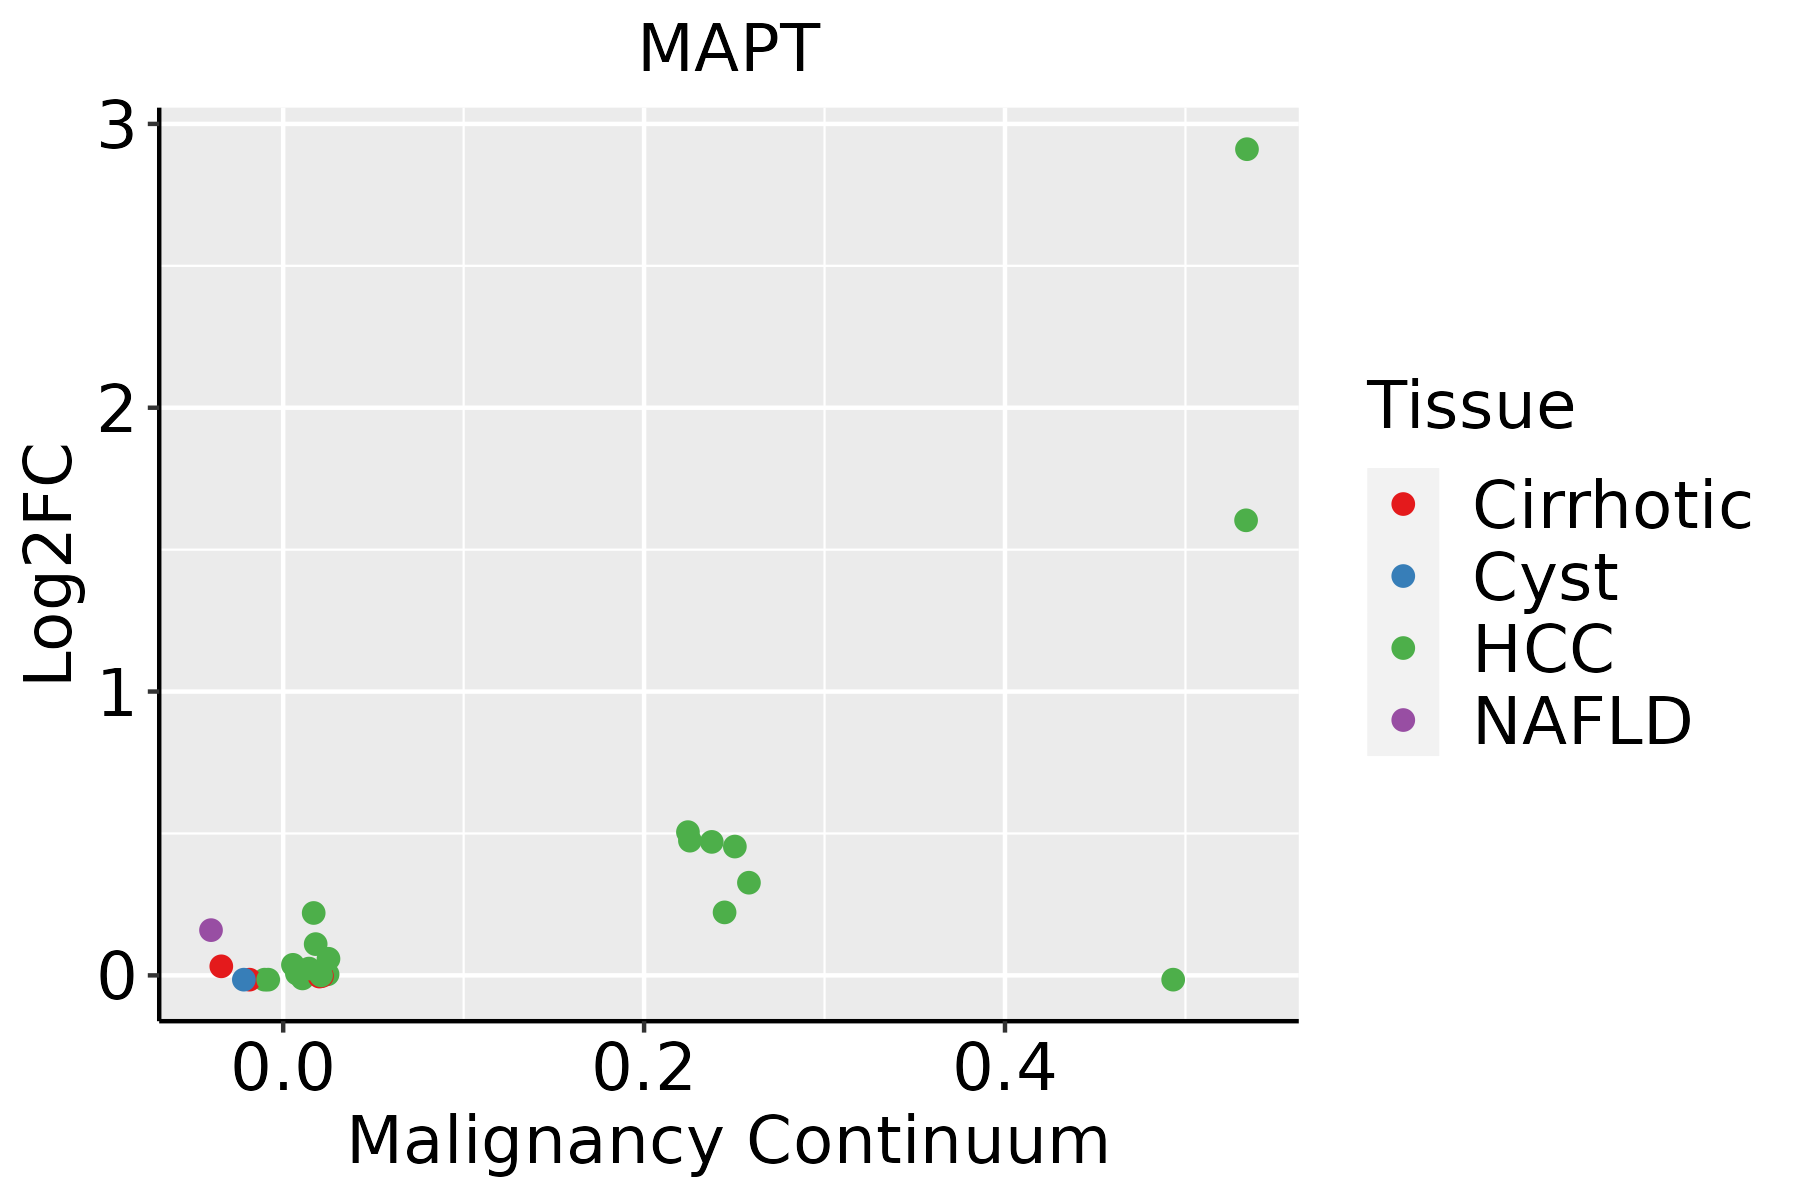 | HCC: Hepatocellular carcinoma |
| NAFLD: Non-alcoholic fatty liver disease |
| ∗log2FC in expression of this searched gene in stem-like cells from each diseased tissue sample relative to stem-like cells in normal samples in each tissue plotted against the malignancy continuum. Samples are colored based on if they are from different disease stage. |
Top |
Malignant transformation related pathway analysis |
| Find out the enriched GO biological processes and KEGG pathways involved in transition from healthy to precancer to cancer |
| Tissue | Disease Stage | Enriched GO biological Processes |
| Colorectum | AD |  |
| Colorectum | SER |  |
| Colorectum | MSS |  |
| Colorectum | MSI-H |  |
| Colorectum | FAP |  |
| ∗Top 15 enriched GO BP terms are showed in the bar plot of each disease state in each tissue. Each row represents a significant GO biological process which is colored according to the -log10(p.adjust). |
| Page: 1 2 3 4 5 6 7 8 9 |
| GO ID | Tissue | Disease Stage | Description | Gene Ratio | Bg Ratio | pvalue | p.adjust | Count |
| GO:001607212 | Liver | HCC | rRNA metabolic process | 193/7958 | 236/18723 | 1.26e-35 | 1.14e-32 | 193 |
| GO:007259422 | Liver | HCC | establishment of protein localization to organelle | 299/7958 | 422/18723 | 1.06e-32 | 6.10e-30 | 299 |
| GO:00346601 | Liver | HCC | ncRNA metabolic process | 332/7958 | 485/18723 | 1.48e-31 | 7.80e-29 | 332 |
| GO:190382922 | Liver | HCC | positive regulation of cellular protein localization | 199/7958 | 276/18723 | 1.15e-23 | 2.62e-21 | 199 |
| GO:000697922 | Liver | HCC | response to oxidative stress | 281/7958 | 446/18723 | 9.75e-19 | 1.24e-16 | 281 |
| GO:007265512 | Liver | HCC | establishment of protein localization to mitochondrion | 98/7958 | 120/18723 | 1.18e-18 | 1.46e-16 | 98 |
| GO:007058512 | Liver | HCC | protein localization to mitochondrion | 101/7958 | 125/18723 | 1.53e-18 | 1.86e-16 | 101 |
| GO:001050621 | Liver | HCC | regulation of autophagy | 210/7958 | 317/18723 | 7.59e-18 | 8.45e-16 | 210 |
| GO:004325422 | Liver | HCC | regulation of protein-containing complex assembly | 264/7958 | 428/18723 | 5.47e-16 | 4.39e-14 | 264 |
| GO:006219722 | Liver | HCC | cellular response to chemical stress | 216/7958 | 337/18723 | 6.86e-16 | 5.44e-14 | 216 |
| GO:004586222 | Liver | HCC | positive regulation of proteolysis | 232/7958 | 372/18723 | 5.66e-15 | 3.98e-13 | 232 |
| GO:003459922 | Liver | HCC | cellular response to oxidative stress | 183/7958 | 288/18723 | 3.65e-13 | 1.93e-11 | 183 |
| GO:00064732 | Liver | HCC | protein acetylation | 135/7958 | 201/18723 | 1.20e-12 | 5.92e-11 | 135 |
| GO:00435432 | Liver | HCC | protein acylation | 157/7958 | 243/18723 | 2.40e-12 | 1.12e-10 | 157 |
| GO:001056322 | Liver | HCC | negative regulation of phosphorus metabolic process | 259/7958 | 442/18723 | 4.29e-12 | 1.92e-10 | 259 |
| GO:004593622 | Liver | HCC | negative regulation of phosphate metabolic process | 258/7958 | 441/18723 | 6.00e-12 | 2.60e-10 | 258 |
| GO:000030222 | Liver | HCC | response to reactive oxygen species | 144/7958 | 222/18723 | 1.24e-11 | 5.09e-10 | 144 |
| GO:003304421 | Liver | HCC | regulation of chromosome organization | 125/7958 | 187/18723 | 1.35e-11 | 5.40e-10 | 125 |
| GO:004232622 | Liver | HCC | negative regulation of phosphorylation | 227/7958 | 385/18723 | 3.98e-11 | 1.52e-09 | 227 |
| GO:005125822 | Liver | HCC | protein polymerization | 182/7958 | 297/18723 | 4.17e-11 | 1.58e-09 | 182 |
| Page: 1 2 3 4 5 6 |
| Pathway ID | Tissue | Disease Stage | Description | Gene Ratio | Bg Ratio | pvalue | p.adjust | qvalue | Count |
| hsa0501222 | Liver | HCC | Parkinson disease | 198/4020 | 266/8465 | 9.40e-20 | 1.58e-17 | 8.76e-18 | 198 |
| hsa0501022 | Liver | HCC | Alzheimer disease | 254/4020 | 384/8465 | 3.75e-14 | 8.97e-13 | 4.99e-13 | 254 |
| hsa0502222 | Liver | HCC | Pathways of neurodegeneration - multiple diseases | 298/4020 | 476/8465 | 6.59e-12 | 1.30e-10 | 7.22e-11 | 298 |
| hsa0501232 | Liver | HCC | Parkinson disease | 198/4020 | 266/8465 | 9.40e-20 | 1.58e-17 | 8.76e-18 | 198 |
| hsa0501032 | Liver | HCC | Alzheimer disease | 254/4020 | 384/8465 | 3.75e-14 | 8.97e-13 | 4.99e-13 | 254 |
| hsa0502232 | Liver | HCC | Pathways of neurodegeneration - multiple diseases | 298/4020 | 476/8465 | 6.59e-12 | 1.30e-10 | 7.22e-11 | 298 |
| Page: 1 |
Top |
Cell-cell communication analysis |
| Identification of potential cell-cell interactions between two cell types and their ligand-receptor pairs for different disease states |
| Ligand | Receptor | LRpair | Pathway | Tissue | Disease Stage |
| Page: 1 |
Top |
Single-cell gene regulatory network inference analysis |
| Find out the significant the regulons (TFs) and the target genes of each regulon across cell types for different disease states |
| TF | Cell Type | Tissue | Disease Stage | Target Gene | RSS | Regulon Activity |
| ∗The dot plots of a searched regulon are shown for all cell subpopulations in each disease state of each tissue based on the regulon specific score inferred using pySCENIC and by calculating the average expression. |
| Page: 1 |
Top |
Somatic mutation of malignant transformation related genes |
| Annotation of somatic variants for genes involved in malignant transformation |
| Hugo Symbol | Variant Class | Variant Classification | dbSNP RS | HGVSc | HGVSp | HGVSp Short | SWISSPROT | BIOTYPE | SIFT | PolyPhen | Tumor Sample Barcode | Tissue | Histology | Sex | Age | Stage | Therapy Types | Drugs | Outcome |
| MAPT | SNV | Missense_Mutation | c.348C>G | p.Asp116Glu | p.D116E | P10636 | protein_coding | deleterious(0) | probably_damaging(0.999) | TCGA-B6-A0RE-01 | Breast | breast invasive carcinoma | Female | <65 | I/II | Unknown | Unknown | SD | |
| MAPT | SNV | Missense_Mutation | rs369217369 | c.1747N>A | p.Val583Met | p.V583M | P10636 | protein_coding | deleterious(0.03) | probably_damaging(0.926) | TCGA-BH-A0C0-01 | Breast | breast invasive carcinoma | Female | <65 | I/II | Chemotherapy | carboplatin | SD |
| MAPT | SNV | Missense_Mutation | c.1669N>C | p.Glu557Gln | p.E557Q | P10636 | protein_coding | tolerated(0.1) | probably_damaging(0.998) | TCGA-D8-A1XJ-01 | Breast | breast invasive carcinoma | Female | >=65 | III/IV | Hormone Therapy | tamoxiphen | SD | |
| MAPT | SNV | Missense_Mutation | c.248G>A | p.Gly83Glu | p.G83E | P10636 | protein_coding | tolerated(0.1) | benign(0.1) | TCGA-D8-A27G-01 | Breast | breast invasive carcinoma | Female | >=65 | I/II | Unknown | Unknown | SD | |
| MAPT | SNV | Missense_Mutation | c.1355C>G | p.Ser452Cys | p.S452C | P10636 | protein_coding | deleterious(0) | possibly_damaging(0.891) | TCGA-E2-A1IN-01 | Breast | breast invasive carcinoma | Female | <65 | I/II | Hormone Therapy | arimidex | SD | |
| MAPT | SNV | Missense_Mutation | rs546607985 | c.665G>A | p.Arg222His | p.R222H | P10636 | protein_coding | deleterious(0) | possibly_damaging(0.754) | TCGA-E9-A1N9-01 | Breast | breast invasive carcinoma | Female | <65 | I/II | Chemotherapy | doxorubicin | SD |
| MAPT | SNV | Missense_Mutation | c.1328C>T | p.Ser443Phe | p.S443F | P10636 | protein_coding | deleterious(0) | possibly_damaging(0.804) | TCGA-EW-A1OV-01 | Breast | breast invasive carcinoma | Female | <65 | I/II | Chemotherapy | epirubicin | SD | |
| MAPT | insertion | Frame_Shift_Ins | novel | c.2329_2330insAAAACAACAGCTCCTGGCCAGGCGCAGTG | p.Ter777%3D | p.*777%3D | P10636 | protein_coding | TCGA-BH-A0B4-01 | Breast | breast invasive carcinoma | Male | >=65 | III/IV | Hormone Therapy | tamoxiphen | SD | ||
| MAPT | SNV | Missense_Mutation | novel | c.295N>A | p.Glu99Lys | p.E99K | P10636 | protein_coding | deleterious(0.03) | probably_damaging(0.996) | TCGA-DS-A1OB-01 | Cervix | cervical & endocervical cancer | Female | <65 | I/II | Chemotherapy | carboplatin | PD |
| MAPT | SNV | Missense_Mutation | rs63750991 | c.2285C>T | p.Thr762Met | p.T762M | P10636 | protein_coding | deleterious(0.01) | probably_damaging(0.999) | TCGA-JX-A3Q0-01 | Cervix | cervical & endocervical cancer | Female | <65 | III/IV | Unknown | Unknown | SD |
| Page: 1 2 3 4 5 6 7 8 9 10 11 |
Top |
Related drugs of malignant transformation related genes |
| Identification of chemicals and drugs interact with genes involved in malignant transfromation |
| (DGIdb 4.0) |
| Entrez ID | Symbol | Category | Interaction Types | Drug Claim Name | Drug Name | PMIDs |
| 4137 | MAPT | DRUGGABLE GENOME | DIHYDROXANTHOHUMOL | DIHYDROXANTHOHUMOL | ||
| 4137 | MAPT | DRUGGABLE GENOME | ERGOCRYPTINE | ERGOCRYPTINE | ||
| 4137 | MAPT | DRUGGABLE GENOME | FENRETINIDE | FENRETINIDE | ||
| 4137 | MAPT | DRUGGABLE GENOME | RALOXIFENE | RALOXIFENE | ||
| 4137 | MAPT | DRUGGABLE GENOME | GNF-PF-5134 | CHEMBL602969 | ||
| 4137 | MAPT | DRUGGABLE GENOME | RHEIN | RHEIN | ||
| 4137 | MAPT | DRUGGABLE GENOME | BIIB092 | GOSURANEMAB | ||
| 4137 | MAPT | DRUGGABLE GENOME | PYRANTEL PAMOATE | PYRANTEL PAMOATE | ||
| 4137 | MAPT | DRUGGABLE GENOME | MMV007396 | CHEMBL582286 | ||
| 4137 | MAPT | DRUGGABLE GENOME | CARBIDOPA | CARBIDOPA |
| Page: 1 2 3 4 5 6 7 8 9 10 11 12 13 14 15 16 17 18 19 20 21 22 23 24 25 26 27 28 29 30 31 32 33 34 35 36 37 38 39 40 41 42 43 44 45 |

Copyright 2023-Present -The University of Texas Health Science Center at Houston |