
|
|||||
|
 | |
| |
| |
| |
| |
| |
|
Gene: MAPRE3 |
Gene summary for MAPRE3 |
| Gene information | Species | Human | Gene symbol | MAPRE3 | Gene ID | 22924 |
| Gene name | microtubule associated protein RP/EB family member 3 | |
| Gene Alias | EB3 | |
| Cytomap | 2p23.3 | |
| Gene Type | protein-coding | GO ID | GO:0000079 | UniProtAcc | Q9UPY8 |
Top |
Malignant transformation analysis |
| Identification of the aberrant gene expression in precancerous and cancerous lesions by comparing the gene expression of stem-like cells in diseased tissues with normal stem cells |
| Entrez ID | Symbol | Replicates | Species | Organ | Tissue | Adj P-value | Log2FC | Malignancy |
| 22924 | MAPRE3 | LZE4T | Human | Esophagus | ESCC | 7.48e-12 | 4.06e-01 | 0.0811 |
| 22924 | MAPRE3 | LZE7T | Human | Esophagus | ESCC | 1.30e-05 | 4.11e-01 | 0.0667 |
| 22924 | MAPRE3 | LZE24T | Human | Esophagus | ESCC | 6.94e-14 | 4.60e-01 | 0.0596 |
| 22924 | MAPRE3 | P1T-E | Human | Esophagus | ESCC | 2.70e-04 | 3.80e-01 | 0.0875 |
| 22924 | MAPRE3 | P2T-E | Human | Esophagus | ESCC | 1.39e-35 | 6.70e-01 | 0.1177 |
| 22924 | MAPRE3 | P4T-E | Human | Esophagus | ESCC | 5.88e-12 | 3.11e-01 | 0.1323 |
| 22924 | MAPRE3 | P5T-E | Human | Esophagus | ESCC | 9.26e-11 | 1.96e-01 | 0.1327 |
| 22924 | MAPRE3 | P8T-E | Human | Esophagus | ESCC | 8.00e-11 | 1.00e-01 | 0.0889 |
| 22924 | MAPRE3 | P10T-E | Human | Esophagus | ESCC | 7.21e-16 | 3.20e-01 | 0.116 |
| 22924 | MAPRE3 | P11T-E | Human | Esophagus | ESCC | 1.31e-05 | 3.54e-01 | 0.1426 |
| 22924 | MAPRE3 | P12T-E | Human | Esophagus | ESCC | 2.90e-02 | 1.36e-01 | 0.1122 |
| 22924 | MAPRE3 | P15T-E | Human | Esophagus | ESCC | 4.66e-04 | 2.33e-01 | 0.1149 |
| 22924 | MAPRE3 | P16T-E | Human | Esophagus | ESCC | 8.63e-15 | 2.61e-01 | 0.1153 |
| 22924 | MAPRE3 | P17T-E | Human | Esophagus | ESCC | 2.04e-03 | 2.19e-01 | 0.1278 |
| 22924 | MAPRE3 | P19T-E | Human | Esophagus | ESCC | 2.05e-13 | 5.88e-01 | 0.1662 |
| 22924 | MAPRE3 | P21T-E | Human | Esophagus | ESCC | 2.00e-07 | 1.28e-01 | 0.1617 |
| 22924 | MAPRE3 | P22T-E | Human | Esophagus | ESCC | 2.48e-39 | 5.97e-01 | 0.1236 |
| 22924 | MAPRE3 | P23T-E | Human | Esophagus | ESCC | 9.57e-05 | 1.36e-01 | 0.108 |
| 22924 | MAPRE3 | P24T-E | Human | Esophagus | ESCC | 5.25e-10 | 2.26e-01 | 0.1287 |
| 22924 | MAPRE3 | P26T-E | Human | Esophagus | ESCC | 9.99e-42 | 7.27e-01 | 0.1276 |
| Page: 1 2 3 |
| Tissue | Expression Dynamics | Abbreviation |
| Esophagus | 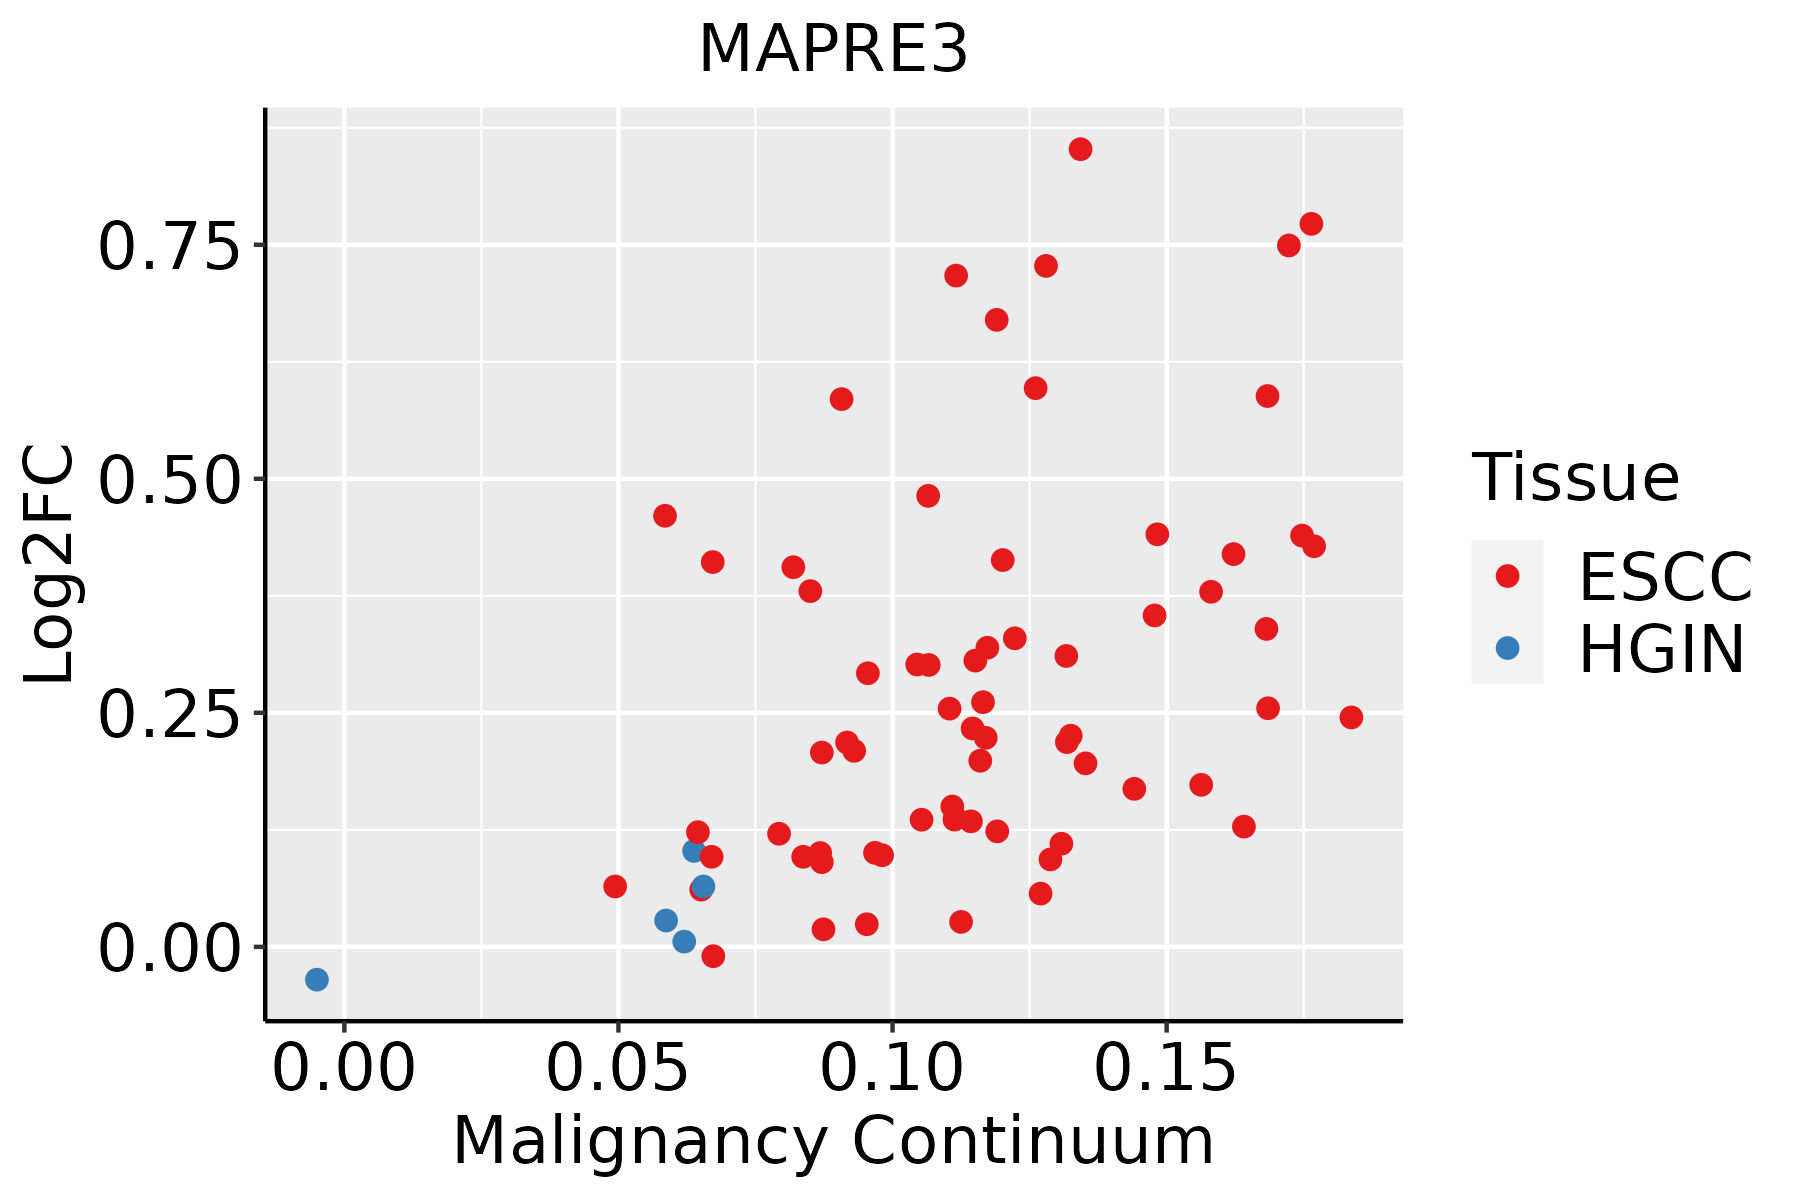 | ESCC: Esophageal squamous cell carcinoma |
| HGIN: High-grade intraepithelial neoplasias | ||
| LGIN: Low-grade intraepithelial neoplasias | ||
| Oral Cavity |  | EOLP: Erosive Oral lichen planus |
| LP: leukoplakia | ||
| NEOLP: Non-erosive oral lichen planus | ||
| OSCC: Oral squamous cell carcinoma |
| ∗log2FC in expression of this searched gene in stem-like cells from each diseased tissue sample relative to stem-like cells in normal samples in each tissue plotted against the malignancy continuum. Samples are colored based on if they are from different disease stage. |
Top |
Malignant transformation related pathway analysis |
| Find out the enriched GO biological processes and KEGG pathways involved in transition from healthy to precancer to cancer |
| Tissue | Disease Stage | Enriched GO biological Processes |
| Colorectum | AD |  |
| Colorectum | SER |  |
| Colorectum | MSS |  |
| Colorectum | MSI-H |  |
| Colorectum | FAP |  |
| ∗Top 15 enriched GO BP terms are showed in the bar plot of each disease state in each tissue. Each row represents a significant GO biological process which is colored according to the -log10(p.adjust). |
| Page: 1 2 3 4 5 6 7 8 9 |
| GO ID | Tissue | Disease Stage | Description | Gene Ratio | Bg Ratio | pvalue | p.adjust | Count |
| GO:0051098111 | Esophagus | ESCC | regulation of binding | 251/8552 | 363/18723 | 6.73e-20 | 8.46e-18 | 251 |
| GO:0043254111 | Esophagus | ESCC | regulation of protein-containing complex assembly | 278/8552 | 428/18723 | 3.81e-16 | 2.77e-14 | 278 |
| GO:000705114 | Esophagus | ESCC | spindle organization | 134/8552 | 184/18723 | 5.70e-14 | 2.87e-12 | 134 |
| GO:007190016 | Esophagus | ESCC | regulation of protein serine/threonine kinase activity | 227/8552 | 359/18723 | 1.12e-11 | 4.10e-10 | 227 |
| GO:0051099111 | Esophagus | ESCC | positive regulation of binding | 122/8552 | 173/18723 | 2.79e-11 | 9.45e-10 | 122 |
| GO:004339320 | Esophagus | ESCC | regulation of protein binding | 135/8552 | 196/18723 | 3.69e-11 | 1.22e-09 | 135 |
| GO:1902903111 | Esophagus | ESCC | regulation of supramolecular fiber organization | 237/8552 | 383/18723 | 9.06e-11 | 2.75e-09 | 237 |
| GO:004578710 | Esophagus | ESCC | positive regulation of cell cycle | 196/8552 | 313/18723 | 9.27e-10 | 2.24e-08 | 196 |
| GO:00512256 | Esophagus | ESCC | spindle assembly | 85/8552 | 117/18723 | 2.72e-09 | 5.98e-08 | 85 |
| GO:0051258111 | Esophagus | ESCC | protein polymerization | 183/8552 | 297/18723 | 1.94e-08 | 3.75e-07 | 183 |
| GO:00705078 | Esophagus | ESCC | regulation of microtubule cytoskeleton organization | 99/8552 | 148/18723 | 1.43e-07 | 2.29e-06 | 99 |
| GO:00726985 | Esophagus | ESCC | protein localization to microtubule cytoskeleton | 43/8552 | 54/18723 | 3.28e-07 | 4.61e-06 | 43 |
| GO:19040294 | Esophagus | ESCC | regulation of cyclin-dependent protein kinase activity | 69/8552 | 98/18723 | 6.04e-07 | 7.91e-06 | 69 |
| GO:00443804 | Esophagus | ESCC | protein localization to cytoskeleton | 45/8552 | 58/18723 | 6.89e-07 | 8.99e-06 | 45 |
| GO:0032271111 | Esophagus | ESCC | regulation of protein polymerization | 143/8552 | 233/18723 | 9.21e-07 | 1.17e-05 | 143 |
| GO:00000794 | Esophagus | ESCC | regulation of cyclin-dependent protein serine/threonine kinase activity | 66/8552 | 94/18723 | 1.24e-06 | 1.53e-05 | 66 |
| GO:00719029 | Esophagus | ESCC | positive regulation of protein serine/threonine kinase activity | 124/8552 | 200/18723 | 2.27e-06 | 2.61e-05 | 124 |
| GO:003209216 | Esophagus | ESCC | positive regulation of protein binding | 60/8552 | 85/18723 | 2.83e-06 | 3.22e-05 | 60 |
| GO:004586018 | Esophagus | ESCC | positive regulation of protein kinase activity | 219/8552 | 386/18723 | 6.91e-06 | 6.97e-05 | 219 |
| GO:003367420 | Esophagus | ESCC | positive regulation of kinase activity | 260/8552 | 467/18723 | 7.26e-06 | 7.22e-05 | 260 |
| Page: 1 2 3 |
| Pathway ID | Tissue | Disease Stage | Description | Gene Ratio | Bg Ratio | pvalue | p.adjust | qvalue | Count |
| Page: 1 |
Top |
Cell-cell communication analysis |
| Identification of potential cell-cell interactions between two cell types and their ligand-receptor pairs for different disease states |
| Ligand | Receptor | LRpair | Pathway | Tissue | Disease Stage |
| Page: 1 |
Top |
Single-cell gene regulatory network inference analysis |
| Find out the significant the regulons (TFs) and the target genes of each regulon across cell types for different disease states |
| TF | Cell Type | Tissue | Disease Stage | Target Gene | RSS | Regulon Activity |
| ∗The dot plots of a searched regulon are shown for all cell subpopulations in each disease state of each tissue based on the regulon specific score inferred using pySCENIC and by calculating the average expression. |
| Page: 1 |
Top |
Somatic mutation of malignant transformation related genes |
| Annotation of somatic variants for genes involved in malignant transformation |
| Hugo Symbol | Variant Class | Variant Classification | dbSNP RS | HGVSc | HGVSp | HGVSp Short | SWISSPROT | BIOTYPE | SIFT | PolyPhen | Tumor Sample Barcode | Tissue | Histology | Sex | Age | Stage | Therapy Types | Drugs | Outcome |
| MAPRE3 | SNV | Missense_Mutation | novel | c.595G>A | p.Asp199Asn | p.D199N | Q9UPY8 | protein_coding | tolerated(0.16) | benign(0.009) | TCGA-5L-AAT1-01 | Breast | breast invasive carcinoma | Female | <65 | III/IV | Hormone Therapy | letrozol | SD |
| MAPRE3 | SNV | Missense_Mutation | c.644N>T | p.Thr215Ile | p.T215I | Q9UPY8 | protein_coding | deleterious(0.04) | benign(0.212) | TCGA-A8-A09Z-01 | Breast | breast invasive carcinoma | Female | >=65 | I/II | Unknown | Unknown | SD | |
| MAPRE3 | SNV | Missense_Mutation | c.412C>G | p.Pro138Ala | p.P138A | Q9UPY8 | protein_coding | tolerated(0.74) | benign(0) | TCGA-AN-A0FW-01 | Breast | breast invasive carcinoma | Female | >=65 | III/IV | Unknown | Unknown | SD | |
| MAPRE3 | insertion | Frame_Shift_Ins | rs777328830 | c.535_536insC | p.Cys182LeufsTer16 | p.C182Lfs*16 | Q9UPY8 | protein_coding | TCGA-AN-A0FY-01 | Breast | breast invasive carcinoma | Female | <65 | I/II | Unknown | Unknown | SD | ||
| MAPRE3 | SNV | Missense_Mutation | c.388C>T | p.Arg130Trp | p.R130W | Q9UPY8 | protein_coding | deleterious(0) | probably_damaging(0.993) | TCGA-2W-A8YY-01 | Cervix | cervical & endocervical cancer | Female | <65 | I/II | Chemotherapy | cisplatin | CR | |
| MAPRE3 | SNV | Missense_Mutation | novel | c.707T>C | p.Ile236Thr | p.I236T | Q9UPY8 | protein_coding | deleterious(0.01) | possibly_damaging(0.457) | TCGA-DS-A1OB-01 | Cervix | cervical & endocervical cancer | Female | <65 | I/II | Chemotherapy | carboplatin | PD |
| MAPRE3 | SNV | Missense_Mutation | novel | c.10N>G | p.Asn4Asp | p.N4D | Q9UPY8 | protein_coding | deleterious(0) | probably_damaging(0.977) | TCGA-EA-A3HS-01 | Cervix | cervical & endocervical cancer | Female | <65 | I/II | Unknown | Unknown | SD |
| MAPRE3 | insertion | In_Frame_Ins | novel | c.710_711insTTG | p.Cys237dup | p.C237dup | Q9UPY8 | protein_coding | TCGA-DS-A1OB-01 | Cervix | cervical & endocervical cancer | Female | <65 | I/II | Chemotherapy | carboplatin | PD | ||
| MAPRE3 | SNV | Missense_Mutation | c.565C>A | p.Pro189Thr | p.P189T | Q9UPY8 | protein_coding | tolerated(0.11) | benign(0.003) | TCGA-A6-6141-01 | Colorectum | colon adenocarcinoma | Male | <65 | I/II | Chemotherapy | 5-fu | SD | |
| MAPRE3 | SNV | Missense_Mutation | c.787N>A | p.Ala263Thr | p.A263T | Q9UPY8 | protein_coding | deleterious(0.01) | benign(0.284) | TCGA-AA-A01R-01 | Colorectum | colon adenocarcinoma | Male | <65 | III/IV | Chemotherapy | 5-fluorouracil | PD |
| Page: 1 2 3 4 |
Top |
Related drugs of malignant transformation related genes |
| Identification of chemicals and drugs interact with genes involved in malignant transfromation |
| (DGIdb 4.0) |
| Entrez ID | Symbol | Category | Interaction Types | Drug Claim Name | Drug Name | PMIDs |
| Page: 1 |

Copyright 2023-Present -The University of Texas Health Science Center at Houston |