
|
|||||
|
 | |
| |
| |
| |
| |
| |
|
Gene: MAPKBP1 |
Gene summary for MAPKBP1 |
| Gene information | Species | Human | Gene symbol | MAPKBP1 | Gene ID | 23005 |
| Gene name | mitogen-activated protein kinase binding protein 1 | |
| Gene Alias | JNKBP-1 | |
| Cytomap | 15q15.1 | |
| Gene Type | protein-coding | GO ID | GO:0001816 | UniProtAcc | O60336 |
Top |
Malignant transformation analysis |
| Identification of the aberrant gene expression in precancerous and cancerous lesions by comparing the gene expression of stem-like cells in diseased tissues with normal stem cells |
| Entrez ID | Symbol | Replicates | Species | Organ | Tissue | Adj P-value | Log2FC | Malignancy |
| 23005 | MAPKBP1 | CCI_1 | Human | Cervix | CC | 1.97e-04 | 7.96e-01 | 0.528 |
| 23005 | MAPKBP1 | CCI_2 | Human | Cervix | CC | 1.48e-04 | 7.22e-01 | 0.5249 |
| 23005 | MAPKBP1 | CCI_3 | Human | Cervix | CC | 1.35e-05 | 4.51e-01 | 0.516 |
| 23005 | MAPKBP1 | LZE4T | Human | Esophagus | ESCC | 3.38e-05 | 2.77e-01 | 0.0811 |
| 23005 | MAPKBP1 | LZE8T | Human | Esophagus | ESCC | 3.61e-07 | 2.54e-01 | 0.067 |
| 23005 | MAPKBP1 | LZE24T | Human | Esophagus | ESCC | 1.10e-03 | 9.30e-02 | 0.0596 |
| 23005 | MAPKBP1 | P2T-E | Human | Esophagus | ESCC | 2.66e-12 | 1.16e-01 | 0.1177 |
| 23005 | MAPKBP1 | P4T-E | Human | Esophagus | ESCC | 2.20e-11 | 2.39e-01 | 0.1323 |
| 23005 | MAPKBP1 | P5T-E | Human | Esophagus | ESCC | 9.04e-08 | -5.48e-03 | 0.1327 |
| 23005 | MAPKBP1 | P8T-E | Human | Esophagus | ESCC | 1.54e-06 | -8.63e-03 | 0.0889 |
| 23005 | MAPKBP1 | P9T-E | Human | Esophagus | ESCC | 1.32e-03 | 6.99e-02 | 0.1131 |
| 23005 | MAPKBP1 | P10T-E | Human | Esophagus | ESCC | 1.08e-21 | 2.19e-01 | 0.116 |
| 23005 | MAPKBP1 | P11T-E | Human | Esophagus | ESCC | 4.02e-03 | 2.23e-01 | 0.1426 |
| 23005 | MAPKBP1 | P12T-E | Human | Esophagus | ESCC | 1.76e-11 | 2.42e-01 | 0.1122 |
| 23005 | MAPKBP1 | P15T-E | Human | Esophagus | ESCC | 1.26e-06 | 1.88e-01 | 0.1149 |
| 23005 | MAPKBP1 | P16T-E | Human | Esophagus | ESCC | 1.41e-13 | 1.68e-01 | 0.1153 |
| 23005 | MAPKBP1 | P20T-E | Human | Esophagus | ESCC | 7.76e-07 | 1.95e-01 | 0.1124 |
| 23005 | MAPKBP1 | P21T-E | Human | Esophagus | ESCC | 1.03e-18 | 2.57e-01 | 0.1617 |
| 23005 | MAPKBP1 | P22T-E | Human | Esophagus | ESCC | 9.15e-17 | 1.17e-01 | 0.1236 |
| 23005 | MAPKBP1 | P23T-E | Human | Esophagus | ESCC | 1.77e-07 | 2.69e-01 | 0.108 |
| Page: 1 2 3 4 |
| Tissue | Expression Dynamics | Abbreviation |
| Cervix |  | CC: Cervix cancer |
| HSIL_HPV: HPV-infected high-grade squamous intraepithelial lesions | ||
| N_HPV: HPV-infected normal cervix | ||
| Esophagus | 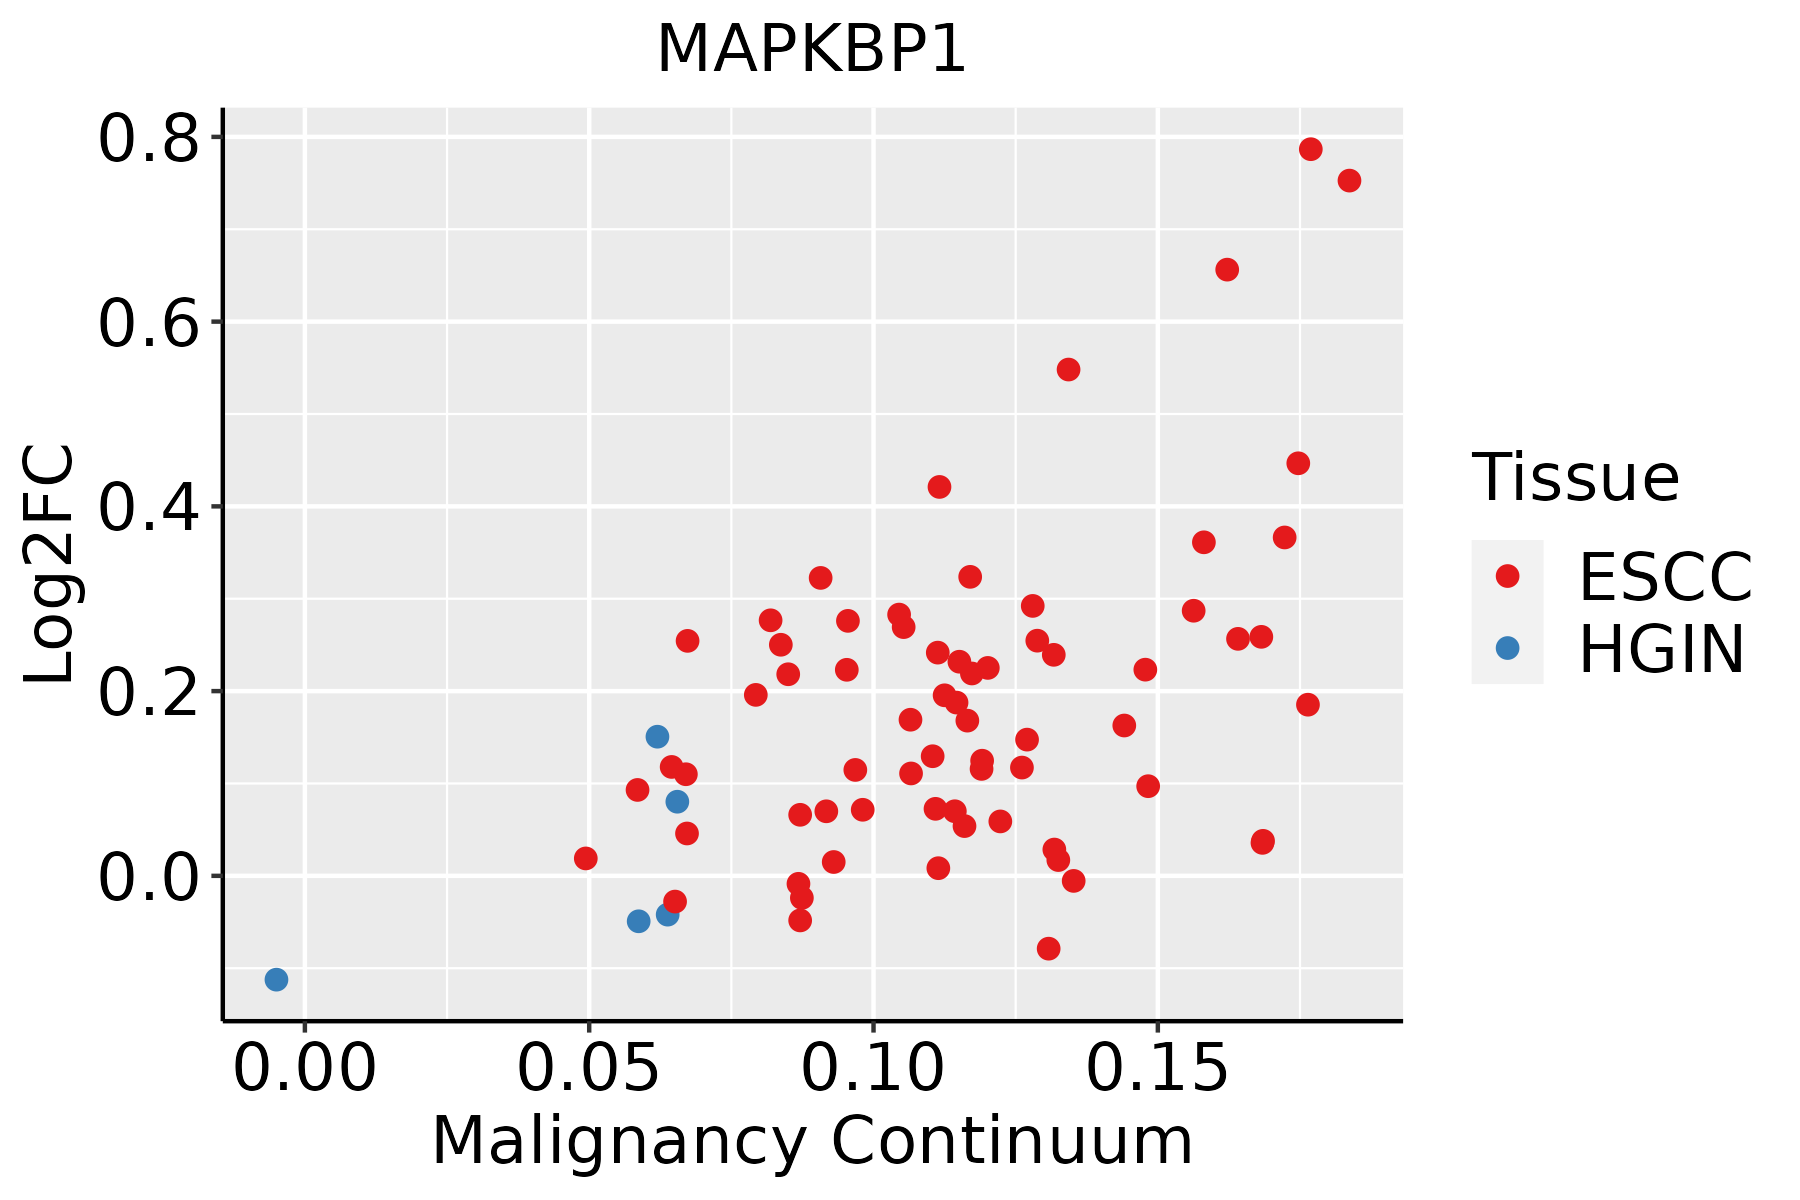 | ESCC: Esophageal squamous cell carcinoma |
| HGIN: High-grade intraepithelial neoplasias | ||
| LGIN: Low-grade intraepithelial neoplasias | ||
| Oral Cavity | 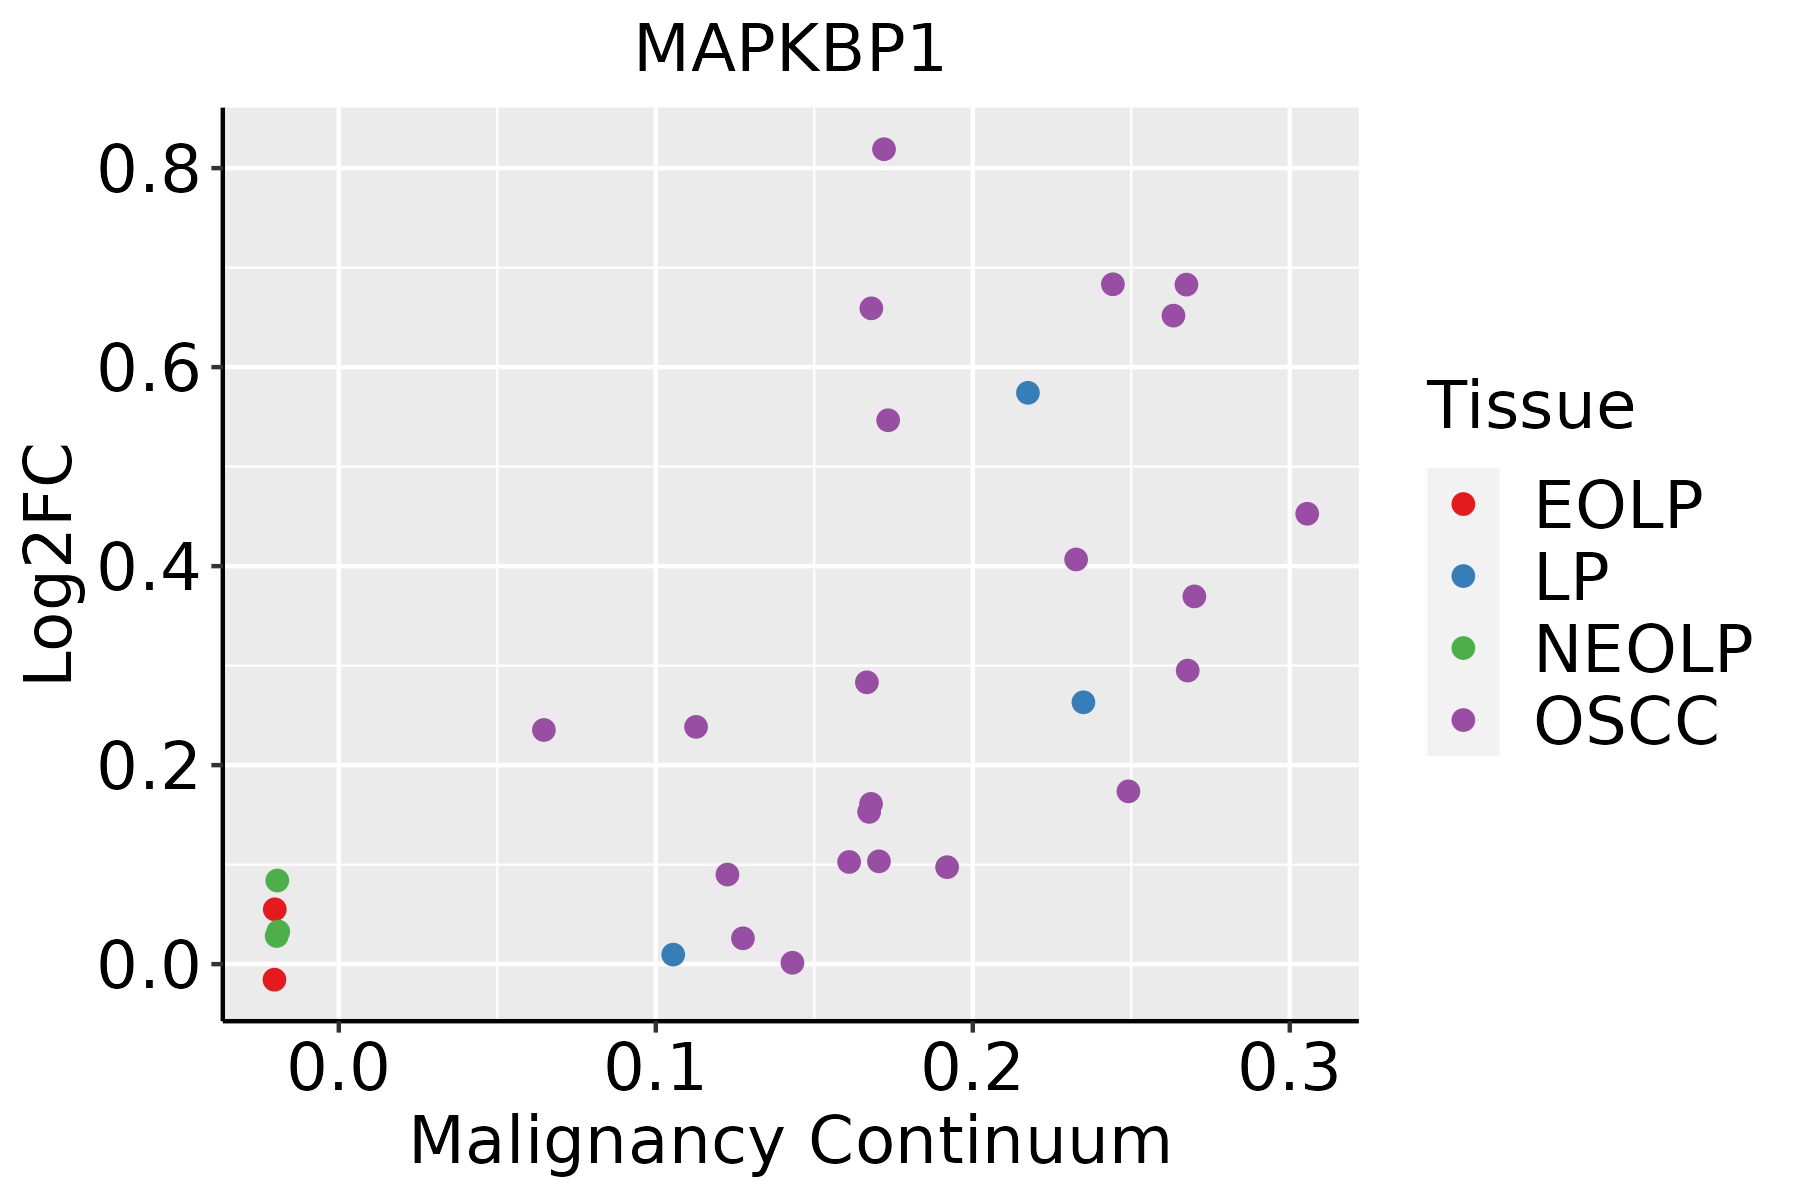 | EOLP: Erosive Oral lichen planus |
| LP: leukoplakia | ||
| NEOLP: Non-erosive oral lichen planus | ||
| OSCC: Oral squamous cell carcinoma |
| ∗log2FC in expression of this searched gene in stem-like cells from each diseased tissue sample relative to stem-like cells in normal samples in each tissue plotted against the malignancy continuum. Samples are colored based on if they are from different disease stage. |
Top |
Malignant transformation related pathway analysis |
| Find out the enriched GO biological processes and KEGG pathways involved in transition from healthy to precancer to cancer |
| Tissue | Disease Stage | Enriched GO biological Processes |
| Colorectum | AD |  |
| Colorectum | SER |  |
| Colorectum | MSS |  |
| Colorectum | MSI-H |  |
| Colorectum | FAP |  |
| ∗Top 15 enriched GO BP terms are showed in the bar plot of each disease state in each tissue. Each row represents a significant GO biological process which is colored according to the -log10(p.adjust). |
| Page: 1 2 3 4 5 6 7 8 9 |
| GO ID | Tissue | Disease Stage | Description | Gene Ratio | Bg Ratio | pvalue | p.adjust | Count |
| GO:00026837 | Cervix | CC | negative regulation of immune system process | 94/2311 | 434/18723 | 2.63e-08 | 1.87e-06 | 94 |
| GO:00028315 | Cervix | CC | regulation of response to biotic stimulus | 67/2311 | 327/18723 | 1.79e-05 | 3.36e-04 | 67 |
| GO:00431228 | Cervix | CC | regulation of I-kappaB kinase/NF-kappaB signaling | 53/2311 | 249/18723 | 4.50e-05 | 6.87e-04 | 53 |
| GO:00072497 | Cervix | CC | I-kappaB kinase/NF-kappaB signaling | 56/2311 | 281/18723 | 1.81e-04 | 2.12e-03 | 56 |
| GO:00028322 | Cervix | CC | negative regulation of response to biotic stimulus | 27/2311 | 108/18723 | 2.27e-04 | 2.55e-03 | 27 |
| GO:00507773 | Cervix | CC | negative regulation of immune response | 41/2311 | 194/18723 | 3.63e-04 | 3.76e-03 | 41 |
| GO:00321022 | Cervix | CC | negative regulation of response to external stimulus | 75/2311 | 420/18723 | 5.96e-04 | 5.61e-03 | 75 |
| GO:0031348 | Cervix | CC | negative regulation of defense response | 48/2311 | 258/18723 | 2.30e-03 | 1.65e-02 | 48 |
| GO:0043122110 | Esophagus | ESCC | regulation of I-kappaB kinase/NF-kappaB signaling | 167/8552 | 249/18723 | 6.11e-12 | 2.32e-10 | 167 |
| GO:000724919 | Esophagus | ESCC | I-kappaB kinase/NF-kappaB signaling | 183/8552 | 281/18723 | 3.02e-11 | 1.01e-09 | 183 |
| GO:00028318 | Esophagus | ESCC | regulation of response to biotic stimulus | 191/8552 | 327/18723 | 2.12e-06 | 2.45e-05 | 191 |
| GO:000283212 | Esophagus | ESCC | negative regulation of response to biotic stimulus | 72/8552 | 108/18723 | 8.36e-06 | 8.11e-05 | 72 |
| GO:00507775 | Esophagus | ESCC | negative regulation of immune response | 112/8552 | 194/18723 | 4.67e-04 | 2.62e-03 | 112 |
| GO:000268316 | Esophagus | ESCC | negative regulation of immune system process | 231/8552 | 434/18723 | 8.48e-04 | 4.36e-03 | 231 |
| GO:004312218 | Oral cavity | OSCC | regulation of I-kappaB kinase/NF-kappaB signaling | 155/7305 | 249/18723 | 7.79e-14 | 4.14e-12 | 155 |
| GO:000724910 | Oral cavity | OSCC | I-kappaB kinase/NF-kappaB signaling | 169/7305 | 281/18723 | 4.69e-13 | 2.25e-11 | 169 |
| GO:00028317 | Oral cavity | OSCC | regulation of response to biotic stimulus | 177/7305 | 327/18723 | 1.73e-08 | 3.43e-07 | 177 |
| GO:00028324 | Oral cavity | OSCC | negative regulation of response to biotic stimulus | 65/7305 | 108/18723 | 6.62e-06 | 7.29e-05 | 65 |
| GO:000268310 | Oral cavity | OSCC | negative regulation of immune system process | 204/7305 | 434/18723 | 3.72e-04 | 2.27e-03 | 204 |
| GO:00507774 | Oral cavity | OSCC | negative regulation of immune response | 97/7305 | 194/18723 | 1.16e-03 | 5.91e-03 | 97 |
| Page: 1 |
| Pathway ID | Tissue | Disease Stage | Description | Gene Ratio | Bg Ratio | pvalue | p.adjust | qvalue | Count |
| Page: 1 |
Top |
Cell-cell communication analysis |
| Identification of potential cell-cell interactions between two cell types and their ligand-receptor pairs for different disease states |
| Ligand | Receptor | LRpair | Pathway | Tissue | Disease Stage |
| Page: 1 |
Top |
Single-cell gene regulatory network inference analysis |
| Find out the significant the regulons (TFs) and the target genes of each regulon across cell types for different disease states |
| TF | Cell Type | Tissue | Disease Stage | Target Gene | RSS | Regulon Activity |
| ∗The dot plots of a searched regulon are shown for all cell subpopulations in each disease state of each tissue based on the regulon specific score inferred using pySCENIC and by calculating the average expression. |
| Page: 1 |
Top |
Somatic mutation of malignant transformation related genes |
| Annotation of somatic variants for genes involved in malignant transformation |
| Hugo Symbol | Variant Class | Variant Classification | dbSNP RS | HGVSc | HGVSp | HGVSp Short | SWISSPROT | BIOTYPE | SIFT | PolyPhen | Tumor Sample Barcode | Tissue | Histology | Sex | Age | Stage | Therapy Types | Drugs | Outcome |
| MAPKBP1 | SNV | Missense_Mutation | novel | c.1100N>T | p.Ser367Ile | p.S367I | O60336 | protein_coding | deleterious(0) | probably_damaging(0.999) | TCGA-A7-A0CE-01 | Breast | breast invasive carcinoma | Female | <65 | I/II | Chemotherapy | adriamycin | SD |
| MAPKBP1 | SNV | Missense_Mutation | rs765800997 | c.3970G>A | p.Glu1324Lys | p.E1324K | O60336 | protein_coding | tolerated(0.25) | benign(0.28) | TCGA-AC-A23H-01 | Breast | breast invasive carcinoma | Female | >=65 | I/II | Unknown | Unknown | PD |
| MAPKBP1 | SNV | Missense_Mutation | rs759447759 | c.436N>A | p.Ala146Thr | p.A146T | O60336 | protein_coding | deleterious(0.04) | benign(0.104) | TCGA-AR-A0U3-01 | Breast | breast invasive carcinoma | Female | <65 | I/II | Chemotherapy | doxorubicin | SD |
| MAPKBP1 | SNV | Missense_Mutation | rs150872011 | c.953G>A | p.Arg318Gln | p.R318Q | O60336 | protein_coding | deleterious(0) | possibly_damaging(0.552) | TCGA-BH-A0HF-01 | Breast | breast invasive carcinoma | Female | >=65 | I/II | Hormone Therapy | arimidex | SD |
| MAPKBP1 | SNV | Missense_Mutation | c.559G>A | p.Glu187Lys | p.E187K | O60336 | protein_coding | deleterious(0.01) | benign(0.297) | TCGA-BH-A0W7-01 | Breast | breast invasive carcinoma | Female | <65 | I/II | Chemotherapy | taxotere | CR | |
| MAPKBP1 | SNV | Missense_Mutation | c.3086N>C | p.Ile1029Thr | p.I1029T | O60336 | protein_coding | tolerated(0.39) | benign(0.007) | TCGA-BH-A18G-01 | Breast | breast invasive carcinoma | Female | >=65 | I/II | Unknown | Unknown | SD | |
| MAPKBP1 | SNV | Missense_Mutation | c.2311N>T | p.His771Tyr | p.H771Y | O60336 | protein_coding | tolerated(0.24) | benign(0.228) | TCGA-E9-A1N4-01 | Breast | breast invasive carcinoma | Female | <65 | III/IV | Chemotherapy | doxorubicin | SD | |
| MAPKBP1 | SNV | Missense_Mutation | rs765800997 | c.3970G>A | p.Glu1324Lys | p.E1324K | O60336 | protein_coding | tolerated(0.25) | benign(0.28) | TCGA-XX-A89A-01 | Breast | breast invasive carcinoma | Female | >=65 | I/II | Unknown | Unknown | SD |
| MAPKBP1 | insertion | Nonsense_Mutation | novel | c.1318_1319insCTGTACTCTCCTAGGGCCCAGTTTCCAGGGGCA | p.His439_Arg440insProValLeuSerTerGlyProValSerArgGly | p.H439_R440insPVLS*GPVSRG | O60336 | protein_coding | TCGA-A8-A0A1-01 | Breast | breast invasive carcinoma | Female | >=65 | I/II | Hormone Therapy | tamoxiphen | SD | ||
| MAPKBP1 | insertion | Frame_Shift_Ins | novel | c.2650_2651insCTCACTTAAGCCCCCTGTGCTTCAGTCTCCTCATCTGTAA | p.Asp884AlafsTer16 | p.D884Afs*16 | O60336 | protein_coding | TCGA-B6-A0RE-01 | Breast | breast invasive carcinoma | Female | <65 | I/II | Unknown | Unknown | SD |
| Page: 1 2 3 4 5 6 7 8 9 10 11 12 13 |
Top |
Related drugs of malignant transformation related genes |
| Identification of chemicals and drugs interact with genes involved in malignant transfromation |
| (DGIdb 4.0) |
| Entrez ID | Symbol | Category | Interaction Types | Drug Claim Name | Drug Name | PMIDs |
| Page: 1 |

Copyright 2023-Present -The University of Texas Health Science Center at Houston |