
|
|||||
|
 | |
| |
| |
| |
| |
| |
|
Gene: MAPKAPK2 |
Gene summary for MAPKAPK2 |
| Gene information | Species | Human | Gene symbol | MAPKAPK2 | Gene ID | 9261 |
| Gene name | MAPK activated protein kinase 2 | |
| Gene Alias | MAPKAP-K2 | |
| Cytomap | 1q32.1 | |
| Gene Type | protein-coding | GO ID | GO:0000165 | UniProtAcc | P49137 |
Top |
Malignant transformation analysis |
| Identification of the aberrant gene expression in precancerous and cancerous lesions by comparing the gene expression of stem-like cells in diseased tissues with normal stem cells |
| Entrez ID | Symbol | Replicates | Species | Organ | Tissue | Adj P-value | Log2FC | Malignancy |
| 9261 | MAPKAPK2 | HTA11_2487_2000001011 | Human | Colorectum | SER | 2.37e-05 | 4.49e-01 | -0.1808 |
| 9261 | MAPKAPK2 | HTA11_1938_2000001011 | Human | Colorectum | AD | 1.29e-02 | 3.56e-01 | -0.0811 |
| 9261 | MAPKAPK2 | HTA11_347_2000001011 | Human | Colorectum | AD | 2.86e-06 | 3.14e-01 | -0.1954 |
| 9261 | MAPKAPK2 | HTA11_411_2000001011 | Human | Colorectum | SER | 5.39e-03 | 8.00e-01 | -0.2602 |
| 9261 | MAPKAPK2 | HTA11_3361_2000001011 | Human | Colorectum | AD | 2.60e-10 | 6.73e-01 | -0.1207 |
| 9261 | MAPKAPK2 | HTA11_83_2000001011 | Human | Colorectum | SER | 1.71e-04 | 3.38e-01 | -0.1526 |
| 9261 | MAPKAPK2 | HTA11_696_2000001011 | Human | Colorectum | AD | 2.45e-06 | 3.99e-01 | -0.1464 |
| 9261 | MAPKAPK2 | HTA11_1391_2000001011 | Human | Colorectum | AD | 4.17e-12 | 5.69e-01 | -0.059 |
| 9261 | MAPKAPK2 | HTA11_2992_2000001011 | Human | Colorectum | SER | 7.20e-04 | 6.88e-01 | -0.1706 |
| 9261 | MAPKAPK2 | HTA11_7663_2000001011 | Human | Colorectum | SER | 1.82e-03 | 6.84e-01 | 0.0131 |
| 9261 | MAPKAPK2 | HTA11_7696_3000711011 | Human | Colorectum | AD | 2.40e-04 | 2.56e-01 | 0.0674 |
| 9261 | MAPKAPK2 | HTA11_99999970781_79442 | Human | Colorectum | MSS | 7.93e-07 | 4.05e-01 | 0.294 |
| 9261 | MAPKAPK2 | HTA11_99999965062_69753 | Human | Colorectum | MSI-H | 2.21e-05 | 1.05e+00 | 0.3487 |
| 9261 | MAPKAPK2 | HTA11_99999965104_69814 | Human | Colorectum | MSS | 1.80e-28 | 1.18e+00 | 0.281 |
| 9261 | MAPKAPK2 | HTA11_99999971662_82457 | Human | Colorectum | MSS | 1.21e-13 | 6.67e-01 | 0.3859 |
| 9261 | MAPKAPK2 | A015-C-203 | Human | Colorectum | FAP | 1.03e-02 | -3.86e-02 | -0.1294 |
| 9261 | MAPKAPK2 | A002-C-205 | Human | Colorectum | FAP | 2.36e-02 | -1.80e-01 | -0.1236 |
| 9261 | MAPKAPK2 | A015-C-104 | Human | Colorectum | FAP | 9.42e-04 | -1.15e-01 | -0.1899 |
| 9261 | MAPKAPK2 | A002-C-116 | Human | Colorectum | FAP | 2.60e-04 | -1.43e-01 | -0.0452 |
| 9261 | MAPKAPK2 | A018-E-020 | Human | Colorectum | FAP | 9.68e-03 | -1.88e-01 | -0.2034 |
| Page: 1 2 3 |
| Tissue | Expression Dynamics | Abbreviation |
| Colorectum (GSE201348) |  | FAP: Familial adenomatous polyposis |
| CRC: Colorectal cancer | ||
| Colorectum (HTA11) |  | AD: Adenomas |
| SER: Sessile serrated lesions | ||
| MSI-H: Microsatellite-high colorectal cancer | ||
| MSS: Microsatellite stable colorectal cancer | ||
| Liver | 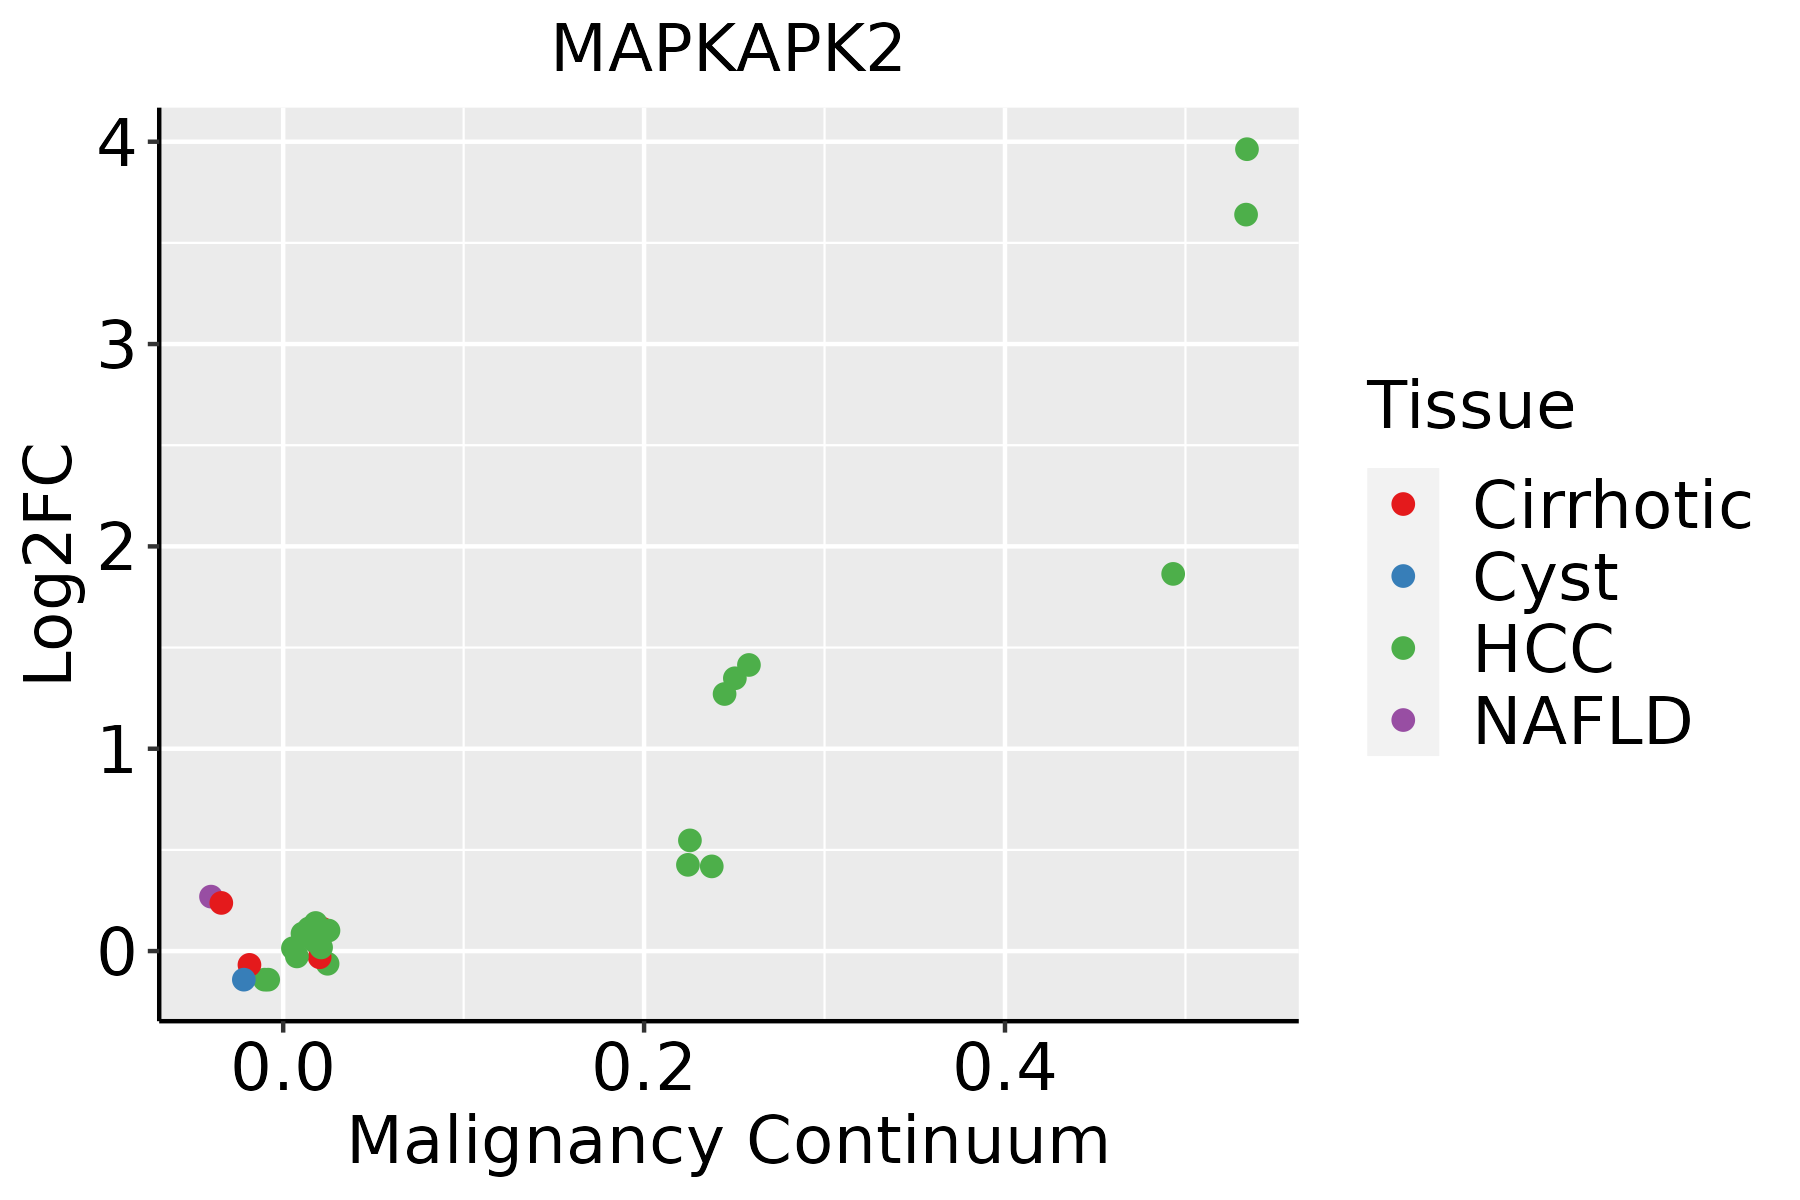 | HCC: Hepatocellular carcinoma |
| NAFLD: Non-alcoholic fatty liver disease | ||
| Lung | 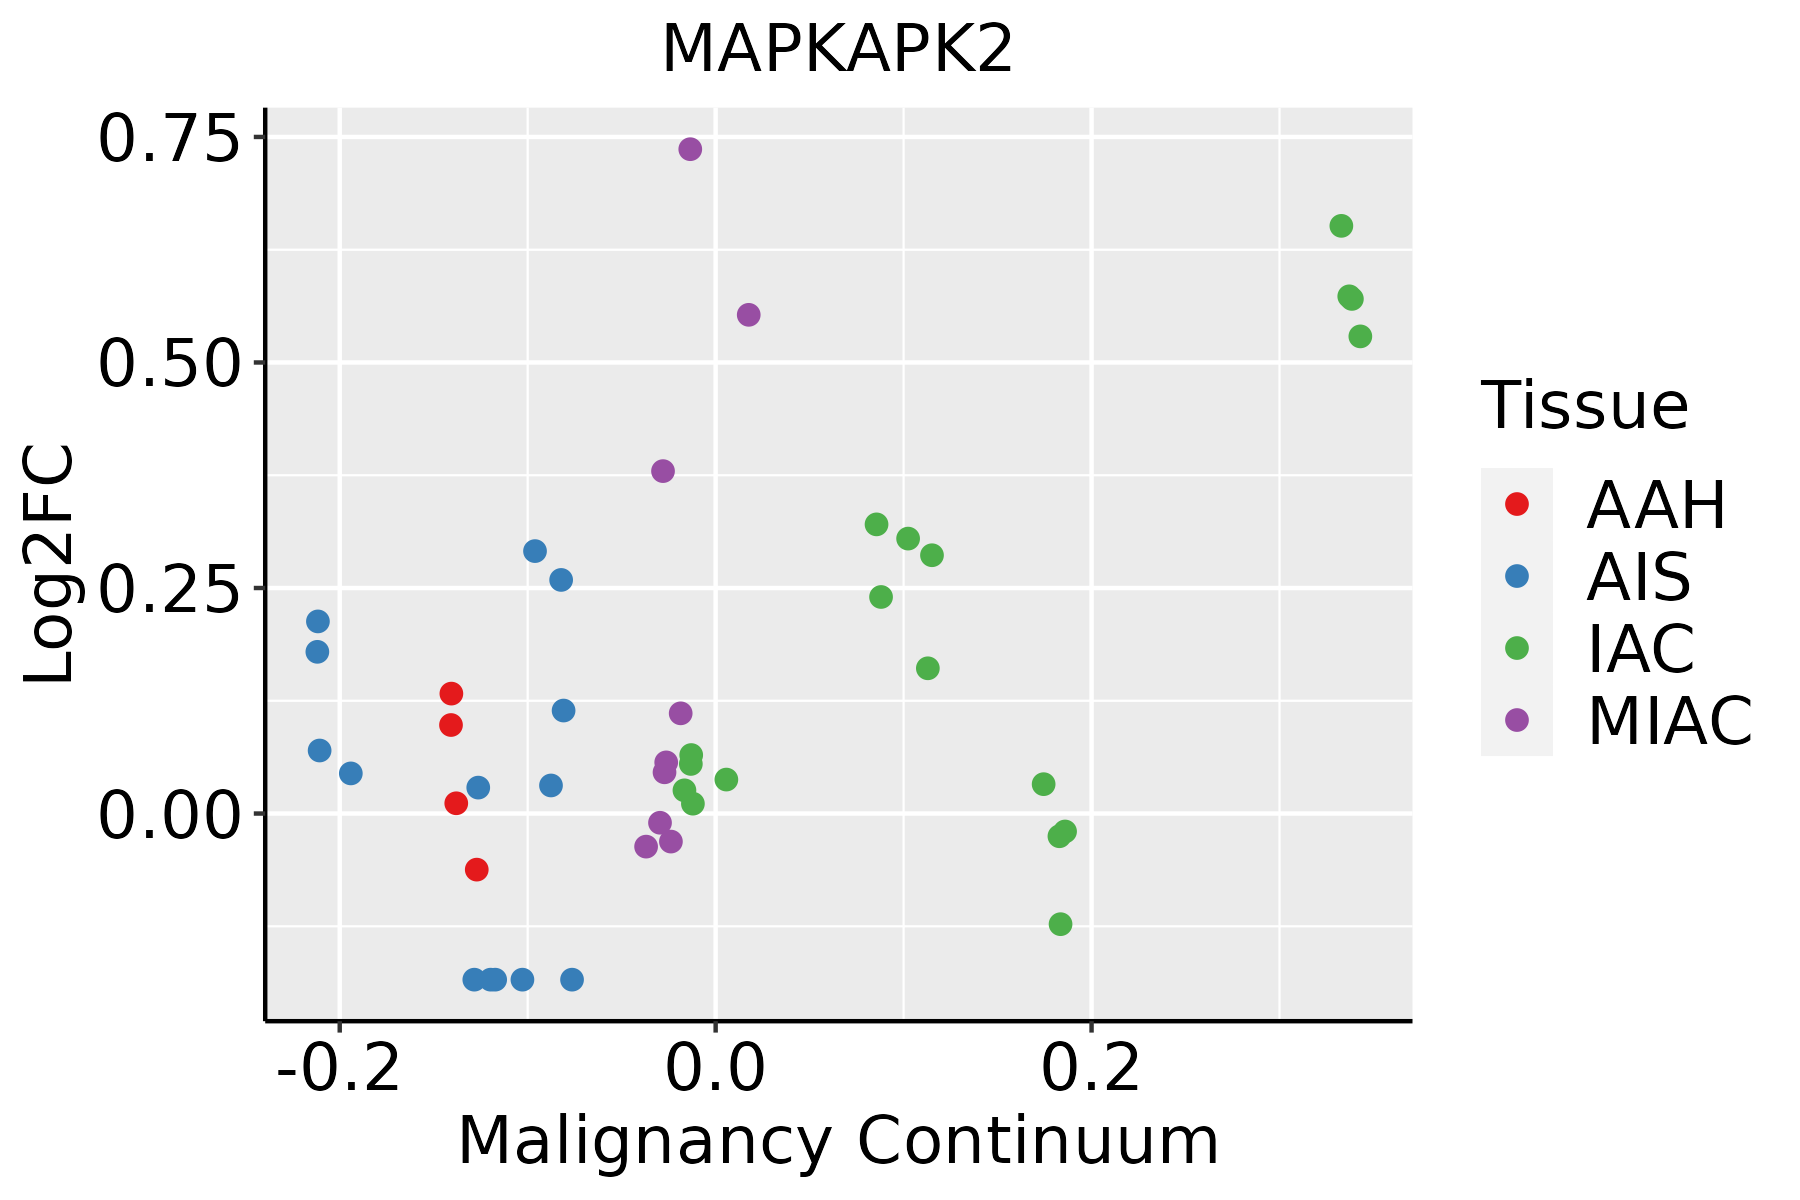 | AAH: Atypical adenomatous hyperplasia |
| AIS: Adenocarcinoma in situ | ||
| IAC: Invasive lung adenocarcinoma | ||
| MIA: Minimally invasive adenocarcinoma | ||
| Oral Cavity | 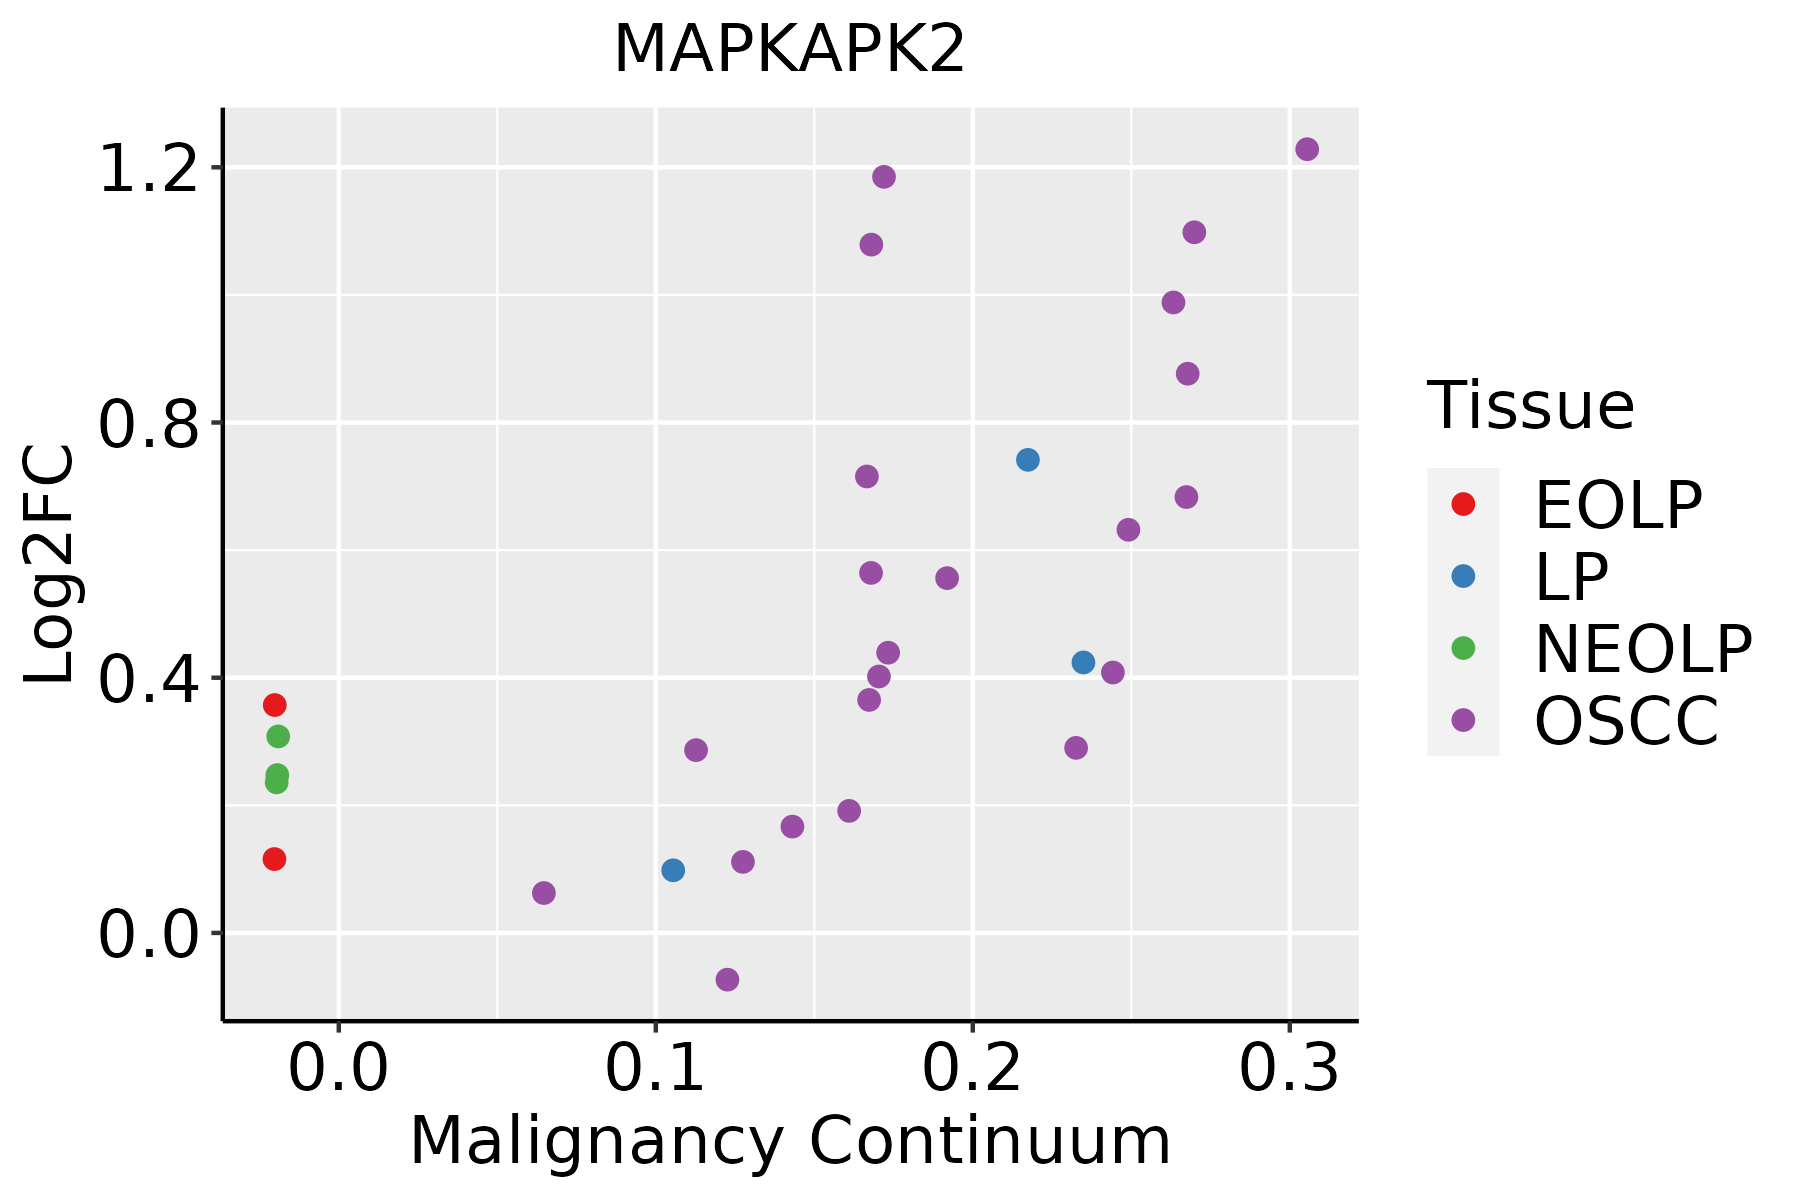 | EOLP: Erosive Oral lichen planus |
| LP: leukoplakia | ||
| NEOLP: Non-erosive oral lichen planus | ||
| OSCC: Oral squamous cell carcinoma |
| ∗log2FC in expression of this searched gene in stem-like cells from each diseased tissue sample relative to stem-like cells in normal samples in each tissue plotted against the malignancy continuum. Samples are colored based on if they are from different disease stage. |
Top |
Malignant transformation related pathway analysis |
| Find out the enriched GO biological processes and KEGG pathways involved in transition from healthy to precancer to cancer |
| Tissue | Disease Stage | Enriched GO biological Processes |
| Colorectum | AD |  |
| Colorectum | SER |  |
| Colorectum | MSS |  |
| Colorectum | MSI-H |  |
| Colorectum | FAP |  |
| ∗Top 15 enriched GO BP terms are showed in the bar plot of each disease state in each tissue. Each row represents a significant GO biological process which is colored according to the -log10(p.adjust). |
| Page: 1 2 3 4 5 6 7 8 9 |
| GO ID | Tissue | Disease Stage | Description | Gene Ratio | Bg Ratio | pvalue | p.adjust | Count |
| GO:1903311 | Colorectum | AD | regulation of mRNA metabolic process | 117/3918 | 288/18723 | 1.69e-14 | 4.23e-12 | 117 |
| GO:0009895 | Colorectum | AD | negative regulation of catabolic process | 124/3918 | 320/18723 | 1.66e-13 | 3.35e-11 | 124 |
| GO:0031330 | Colorectum | AD | negative regulation of cellular catabolic process | 104/3918 | 262/18723 | 2.66e-12 | 3.96e-10 | 104 |
| GO:0006401 | Colorectum | AD | RNA catabolic process | 102/3918 | 278/18723 | 8.64e-10 | 6.76e-08 | 102 |
| GO:0044270 | Colorectum | AD | cellular nitrogen compound catabolic process | 147/3918 | 451/18723 | 3.35e-09 | 2.23e-07 | 147 |
| GO:0046700 | Colorectum | AD | heterocycle catabolic process | 145/3918 | 445/18723 | 4.37e-09 | 2.84e-07 | 145 |
| GO:0006402 | Colorectum | AD | mRNA catabolic process | 87/3918 | 232/18723 | 4.40e-09 | 2.84e-07 | 87 |
| GO:0034655 | Colorectum | AD | nucleobase-containing compound catabolic process | 133/3918 | 407/18723 | 1.56e-08 | 9.12e-07 | 133 |
| GO:0019439 | Colorectum | AD | aromatic compound catabolic process | 146/3918 | 467/18723 | 7.48e-08 | 3.84e-06 | 146 |
| GO:1901361 | Colorectum | AD | organic cyclic compound catabolic process | 153/3918 | 495/18723 | 8.23e-08 | 4.18e-06 | 153 |
| GO:0061013 | Colorectum | AD | regulation of mRNA catabolic process | 64/3918 | 166/18723 | 1.44e-07 | 6.59e-06 | 64 |
| GO:0043487 | Colorectum | AD | regulation of RNA stability | 63/3918 | 170/18723 | 9.17e-07 | 3.12e-05 | 63 |
| GO:0043488 | Colorectum | AD | regulation of mRNA stability | 59/3918 | 158/18723 | 1.50e-06 | 4.66e-05 | 59 |
| GO:1903312 | Colorectum | AD | negative regulation of mRNA metabolic process | 37/3918 | 92/18723 | 1.95e-05 | 4.01e-04 | 37 |
| GO:0046777 | Colorectum | AD | protein autophosphorylation | 74/3918 | 227/18723 | 2.48e-05 | 4.76e-04 | 74 |
| GO:1902369 | Colorectum | AD | negative regulation of RNA catabolic process | 30/3918 | 75/18723 | 1.30e-04 | 1.87e-03 | 30 |
| GO:0051403 | Colorectum | AD | stress-activated MAPK cascade | 72/3918 | 239/18723 | 4.77e-04 | 5.25e-03 | 72 |
| GO:0031098 | Colorectum | AD | stress-activated protein kinase signaling cascade | 74/3918 | 247/18723 | 4.80e-04 | 5.27e-03 | 74 |
| GO:1902373 | Colorectum | AD | negative regulation of mRNA catabolic process | 24/3918 | 63/18723 | 1.34e-03 | 1.17e-02 | 24 |
| GO:0018105 | Colorectum | AD | peptidyl-serine phosphorylation | 88/3918 | 315/18723 | 1.73e-03 | 1.43e-02 | 88 |
| Page: 1 2 3 4 5 6 7 8 9 10 11 12 13 14 15 |
| Pathway ID | Tissue | Disease Stage | Description | Gene Ratio | Bg Ratio | pvalue | p.adjust | qvalue | Count |
| hsa04722 | Colorectum | AD | Neurotrophin signaling pathway | 50/2092 | 119/8465 | 2.28e-05 | 2.24e-04 | 1.43e-04 | 50 |
| hsa04218 | Colorectum | AD | Cellular senescence | 53/2092 | 156/8465 | 5.55e-03 | 2.48e-02 | 1.58e-02 | 53 |
| hsa047221 | Colorectum | AD | Neurotrophin signaling pathway | 50/2092 | 119/8465 | 2.28e-05 | 2.24e-04 | 1.43e-04 | 50 |
| hsa042181 | Colorectum | AD | Cellular senescence | 53/2092 | 156/8465 | 5.55e-03 | 2.48e-02 | 1.58e-02 | 53 |
| hsa047222 | Colorectum | SER | Neurotrophin signaling pathway | 35/1580 | 119/8465 | 2.80e-03 | 2.02e-02 | 1.47e-02 | 35 |
| hsa047223 | Colorectum | SER | Neurotrophin signaling pathway | 35/1580 | 119/8465 | 2.80e-03 | 2.02e-02 | 1.47e-02 | 35 |
| hsa047224 | Colorectum | MSS | Neurotrophin signaling pathway | 45/1875 | 119/8465 | 7.04e-05 | 6.55e-04 | 4.02e-04 | 45 |
| hsa042182 | Colorectum | MSS | Cellular senescence | 52/1875 | 156/8465 | 7.87e-04 | 5.07e-03 | 3.11e-03 | 52 |
| hsa05167 | Colorectum | MSS | Kaposi sarcoma-associated herpesvirus infection | 60/1875 | 194/8465 | 2.59e-03 | 1.27e-02 | 7.81e-03 | 60 |
| hsa047225 | Colorectum | MSS | Neurotrophin signaling pathway | 45/1875 | 119/8465 | 7.04e-05 | 6.55e-04 | 4.02e-04 | 45 |
| hsa042183 | Colorectum | MSS | Cellular senescence | 52/1875 | 156/8465 | 7.87e-04 | 5.07e-03 | 3.11e-03 | 52 |
| hsa051671 | Colorectum | MSS | Kaposi sarcoma-associated herpesvirus infection | 60/1875 | 194/8465 | 2.59e-03 | 1.27e-02 | 7.81e-03 | 60 |
| hsa047226 | Colorectum | FAP | Neurotrophin signaling pathway | 38/1404 | 119/8465 | 2.49e-05 | 2.78e-04 | 1.69e-04 | 38 |
| hsa042184 | Colorectum | FAP | Cellular senescence | 42/1404 | 156/8465 | 6.79e-04 | 4.63e-03 | 2.82e-03 | 42 |
| hsa04010 | Colorectum | FAP | MAPK signaling pathway | 68/1404 | 302/8465 | 4.00e-03 | 1.67e-02 | 1.02e-02 | 68 |
| hsa047227 | Colorectum | FAP | Neurotrophin signaling pathway | 38/1404 | 119/8465 | 2.49e-05 | 2.78e-04 | 1.69e-04 | 38 |
| hsa042185 | Colorectum | FAP | Cellular senescence | 42/1404 | 156/8465 | 6.79e-04 | 4.63e-03 | 2.82e-03 | 42 |
| hsa040101 | Colorectum | FAP | MAPK signaling pathway | 68/1404 | 302/8465 | 4.00e-03 | 1.67e-02 | 1.02e-02 | 68 |
| hsa042187 | Liver | Cirrhotic | Cellular senescence | 66/2530 | 156/8465 | 5.94e-04 | 3.60e-03 | 2.22e-03 | 66 |
| hsa0516714 | Liver | Cirrhotic | Kaposi sarcoma-associated herpesvirus infection | 73/2530 | 194/8465 | 1.17e-02 | 3.81e-02 | 2.35e-02 | 73 |
| Page: 1 2 3 4 5 |
Top |
Cell-cell communication analysis |
| Identification of potential cell-cell interactions between two cell types and their ligand-receptor pairs for different disease states |
| Ligand | Receptor | LRpair | Pathway | Tissue | Disease Stage |
| Page: 1 |
Top |
Single-cell gene regulatory network inference analysis |
| Find out the significant the regulons (TFs) and the target genes of each regulon across cell types for different disease states |
| TF | Cell Type | Tissue | Disease Stage | Target Gene | RSS | Regulon Activity |
| ∗The dot plots of a searched regulon are shown for all cell subpopulations in each disease state of each tissue based on the regulon specific score inferred using pySCENIC and by calculating the average expression. |
| Page: 1 |
Top |
Somatic mutation of malignant transformation related genes |
| Annotation of somatic variants for genes involved in malignant transformation |
| Hugo Symbol | Variant Class | Variant Classification | dbSNP RS | HGVSc | HGVSp | HGVSp Short | SWISSPROT | BIOTYPE | SIFT | PolyPhen | Tumor Sample Barcode | Tissue | Histology | Sex | Age | Stage | Therapy Types | Drugs | Outcome |
| MAPKAPK2 | SNV | Missense_Mutation | novel | c.1198N>T | p.His400Tyr | p.H400Y | P49137 | protein_coding | deleterious_low_confidence(0) | benign(0.193) | TCGA-PE-A5DC-01 | Breast | breast invasive carcinoma | Female | >=65 | III/IV | Unknown | Unknown | SD |
| MAPKAPK2 | SNV | Missense_Mutation | c.712N>A | p.Glu238Lys | p.E238K | P49137 | protein_coding | deleterious(0.02) | probably_damaging(0.95) | TCGA-IR-A3LI-01 | Cervix | cervical & endocervical cancer | Female | <65 | I/II | Chemotherapy | cisplatin | CR | |
| MAPKAPK2 | SNV | Missense_Mutation | c.880G>A | p.Val294Ile | p.V294I | P49137 | protein_coding | tolerated(0.13) | possibly_damaging(0.644) | TCGA-JX-A5QV-01 | Cervix | cervical & endocervical cancer | Female | <65 | I/II | Unknown | Unknown | SD | |
| MAPKAPK2 | SNV | Missense_Mutation | c.458N>A | p.Arg153Gln | p.R153Q | P49137 | protein_coding | tolerated(0.08) | benign(0.426) | TCGA-AA-3984-01 | Colorectum | colon adenocarcinoma | Female | <65 | I/II | Unknown | Unknown | SD | |
| MAPKAPK2 | SNV | Missense_Mutation | c.264N>T | p.Glu88Asp | p.E88D | P49137 | protein_coding | tolerated(0.25) | benign(0.003) | TCGA-CA-6718-01 | Colorectum | colon adenocarcinoma | Male | <65 | I/II | Unknown | Unknown | PD | |
| MAPKAPK2 | SNV | Missense_Mutation | c.714N>T | p.Glu238Asp | p.E238D | P49137 | protein_coding | deleterious(0.04) | benign(0.291) | TCGA-CA-6718-01 | Colorectum | colon adenocarcinoma | Male | <65 | I/II | Unknown | Unknown | PD | |
| MAPKAPK2 | SNV | Missense_Mutation | rs782149296 | c.601G>A | p.Ala201Thr | p.A201T | P49137 | protein_coding | tolerated(0.1) | benign(0.165) | TCGA-CK-4951-01 | Colorectum | colon adenocarcinoma | Female | >=65 | I/II | Unknown | Unknown | PD |
| MAPKAPK2 | SNV | Missense_Mutation | rs772956044 | c.493N>A | p.Glu165Lys | p.E165K | P49137 | protein_coding | tolerated(0.17) | benign(0.041) | TCGA-CK-5916-01 | Colorectum | colon adenocarcinoma | Female | >=65 | I/II | Unknown | Unknown | PD |
| MAPKAPK2 | SNV | Missense_Mutation | c.364G>T | p.Asp122Tyr | p.D122Y | P49137 | protein_coding | deleterious(0) | probably_damaging(0.998) | TCGA-EF-5830-01 | Colorectum | rectum adenocarcinoma | Male | <65 | I/II | Unknown | Unknown | SD | |
| MAPKAPK2 | SNV | Missense_Mutation | rs772956044 | c.493G>A | p.Glu165Lys | p.E165K | P49137 | protein_coding | tolerated(0.17) | benign(0.041) | TCGA-F5-6814-01 | Colorectum | rectum adenocarcinoma | Male | <65 | I/II | Unknown | Unknown | SD |
| Page: 1 2 3 4 |
Top |
Related drugs of malignant transformation related genes |
| Identification of chemicals and drugs interact with genes involved in malignant transfromation |
| (DGIdb 4.0) |
| Entrez ID | Symbol | Category | Interaction Types | Drug Claim Name | Drug Name | PMIDs |
| 9261 | MAPKAPK2 | DRUGGABLE GENOME, ENZYME, KINASE, SERINE THREONINE KINASE | inhibitor | 249565843 | ||
| 9261 | MAPKAPK2 | DRUGGABLE GENOME, ENZYME, KINASE, SERINE THREONINE KINASE | THEOPHYLLINE | THEOPHYLLINE | 10666409 | |
| 9261 | MAPKAPK2 | DRUGGABLE GENOME, ENZYME, KINASE, SERINE THREONINE KINASE | SB-203580 | SB-203580 | 17964780 | |
| 9261 | MAPKAPK2 | DRUGGABLE GENOME, ENZYME, KINASE, SERINE THREONINE KINASE | LAUROGUADINE | LAUROGUADINE | ||
| 9261 | MAPKAPK2 | DRUGGABLE GENOME, ENZYME, KINASE, SERINE THREONINE KINASE | inhibitor | 249565858 | ||
| 9261 | MAPKAPK2 | DRUGGABLE GENOME, ENZYME, KINASE, SERINE THREONINE KINASE | inhibitor | CHEMBL3544960 | AT-13148 | |
| 9261 | MAPKAPK2 | DRUGGABLE GENOME, ENZYME, KINASE, SERINE THREONINE KINASE | inhibitor | 249565857 | ||
| 9261 | MAPKAPK2 | DRUGGABLE GENOME, ENZYME, KINASE, SERINE THREONINE KINASE | inhibitor | 249565725 | ||
| 9261 | MAPKAPK2 | DRUGGABLE GENOME, ENZYME, KINASE, SERINE THREONINE KINASE | CBP-501 | CBP-501 | ||
| 9261 | MAPKAPK2 | DRUGGABLE GENOME, ENZYME, KINASE, SERINE THREONINE KINASE | inhibitor | 252827421 |
| Page: 1 2 |

Copyright 2023-Present -The University of Texas Health Science Center at Houston |