
|
|||||
|
 | |
| |
| |
| |
| |
| |
|
Gene: MAPK8IP3 |
Gene summary for MAPK8IP3 |
| Gene information | Species | Human | Gene symbol | MAPK8IP3 | Gene ID | 23162 |
| Gene name | mitogen-activated protein kinase 8 interacting protein 3 | |
| Gene Alias | JIP-3 | |
| Cytomap | 16p13.3 | |
| Gene Type | protein-coding | GO ID | GO:0000165 | UniProtAcc | E9PFH7 |
Top |
Malignant transformation analysis |
| Identification of the aberrant gene expression in precancerous and cancerous lesions by comparing the gene expression of stem-like cells in diseased tissues with normal stem cells |
| Entrez ID | Symbol | Replicates | Species | Organ | Tissue | Adj P-value | Log2FC | Malignancy |
| 23162 | MAPK8IP3 | LZE7T | Human | Esophagus | ESCC | 3.57e-04 | 4.27e-01 | 0.0667 |
| 23162 | MAPK8IP3 | LZE8T | Human | Esophagus | ESCC | 2.73e-07 | 2.10e-01 | 0.067 |
| 23162 | MAPK8IP3 | LZE24T | Human | Esophagus | ESCC | 1.84e-12 | 2.70e-01 | 0.0596 |
| 23162 | MAPK8IP3 | LZE21T | Human | Esophagus | ESCC | 7.60e-12 | 4.55e-01 | 0.0655 |
| 23162 | MAPK8IP3 | P1T-E | Human | Esophagus | ESCC | 3.53e-09 | 5.51e-01 | 0.0875 |
| 23162 | MAPK8IP3 | P2T-E | Human | Esophagus | ESCC | 8.73e-20 | 3.60e-01 | 0.1177 |
| 23162 | MAPK8IP3 | P4T-E | Human | Esophagus | ESCC | 7.07e-16 | 3.12e-01 | 0.1323 |
| 23162 | MAPK8IP3 | P5T-E | Human | Esophagus | ESCC | 9.44e-07 | 1.15e-01 | 0.1327 |
| 23162 | MAPK8IP3 | P8T-E | Human | Esophagus | ESCC | 1.31e-36 | 5.77e-01 | 0.0889 |
| 23162 | MAPK8IP3 | P9T-E | Human | Esophagus | ESCC | 4.88e-10 | 1.74e-01 | 0.1131 |
| 23162 | MAPK8IP3 | P10T-E | Human | Esophagus | ESCC | 2.93e-15 | 2.32e-01 | 0.116 |
| 23162 | MAPK8IP3 | P11T-E | Human | Esophagus | ESCC | 2.13e-08 | 4.06e-01 | 0.1426 |
| 23162 | MAPK8IP3 | P12T-E | Human | Esophagus | ESCC | 2.72e-19 | 3.55e-01 | 0.1122 |
| 23162 | MAPK8IP3 | P15T-E | Human | Esophagus | ESCC | 1.57e-14 | 3.86e-01 | 0.1149 |
| 23162 | MAPK8IP3 | P16T-E | Human | Esophagus | ESCC | 9.44e-07 | 1.24e-01 | 0.1153 |
| 23162 | MAPK8IP3 | P20T-E | Human | Esophagus | ESCC | 3.11e-07 | 1.68e-01 | 0.1124 |
| 23162 | MAPK8IP3 | P21T-E | Human | Esophagus | ESCC | 9.44e-07 | 1.20e-01 | 0.1617 |
| 23162 | MAPK8IP3 | P22T-E | Human | Esophagus | ESCC | 3.28e-14 | 2.30e-01 | 0.1236 |
| 23162 | MAPK8IP3 | P23T-E | Human | Esophagus | ESCC | 1.62e-21 | 3.60e-01 | 0.108 |
| 23162 | MAPK8IP3 | P24T-E | Human | Esophagus | ESCC | 9.53e-09 | 1.41e-01 | 0.1287 |
| Page: 1 2 3 4 |
| Tissue | Expression Dynamics | Abbreviation |
| Esophagus | 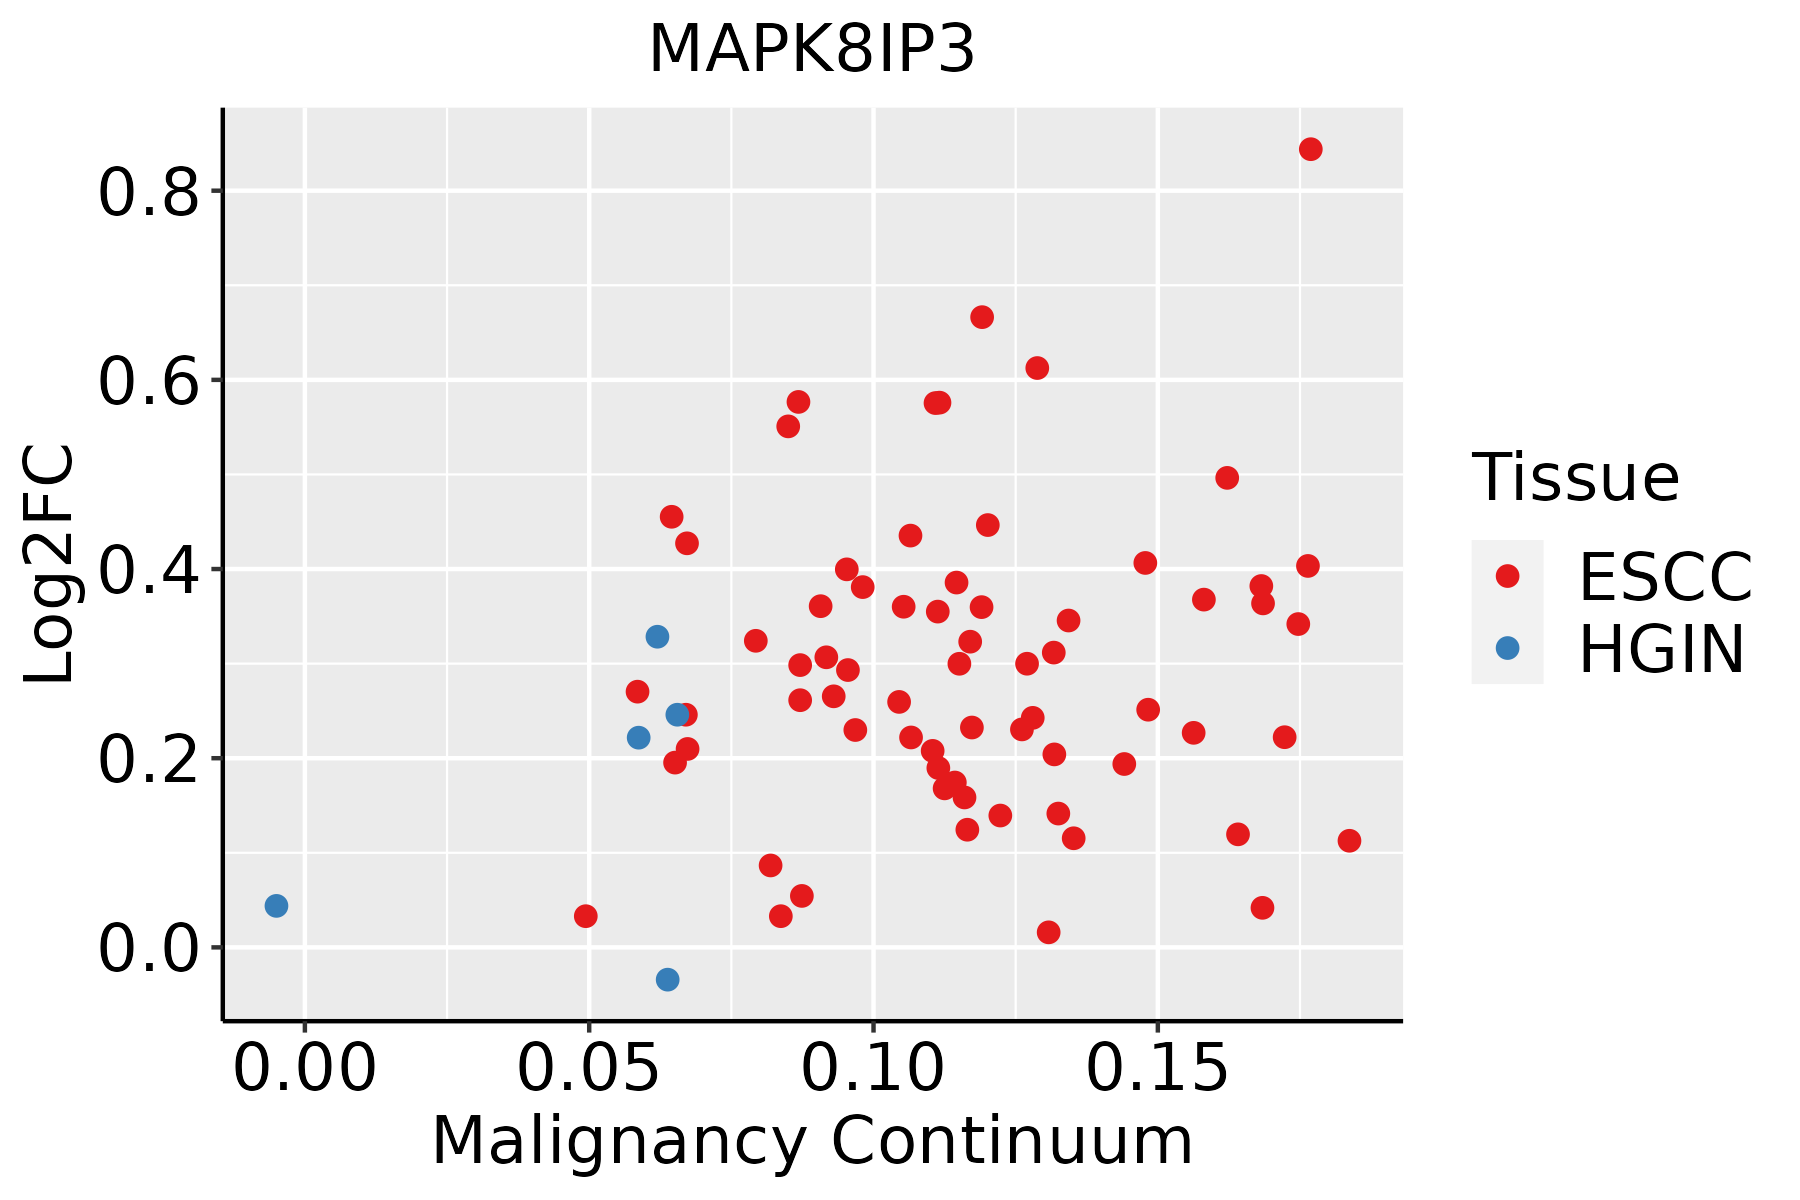 | ESCC: Esophageal squamous cell carcinoma |
| HGIN: High-grade intraepithelial neoplasias | ||
| LGIN: Low-grade intraepithelial neoplasias | ||
| Oral Cavity | 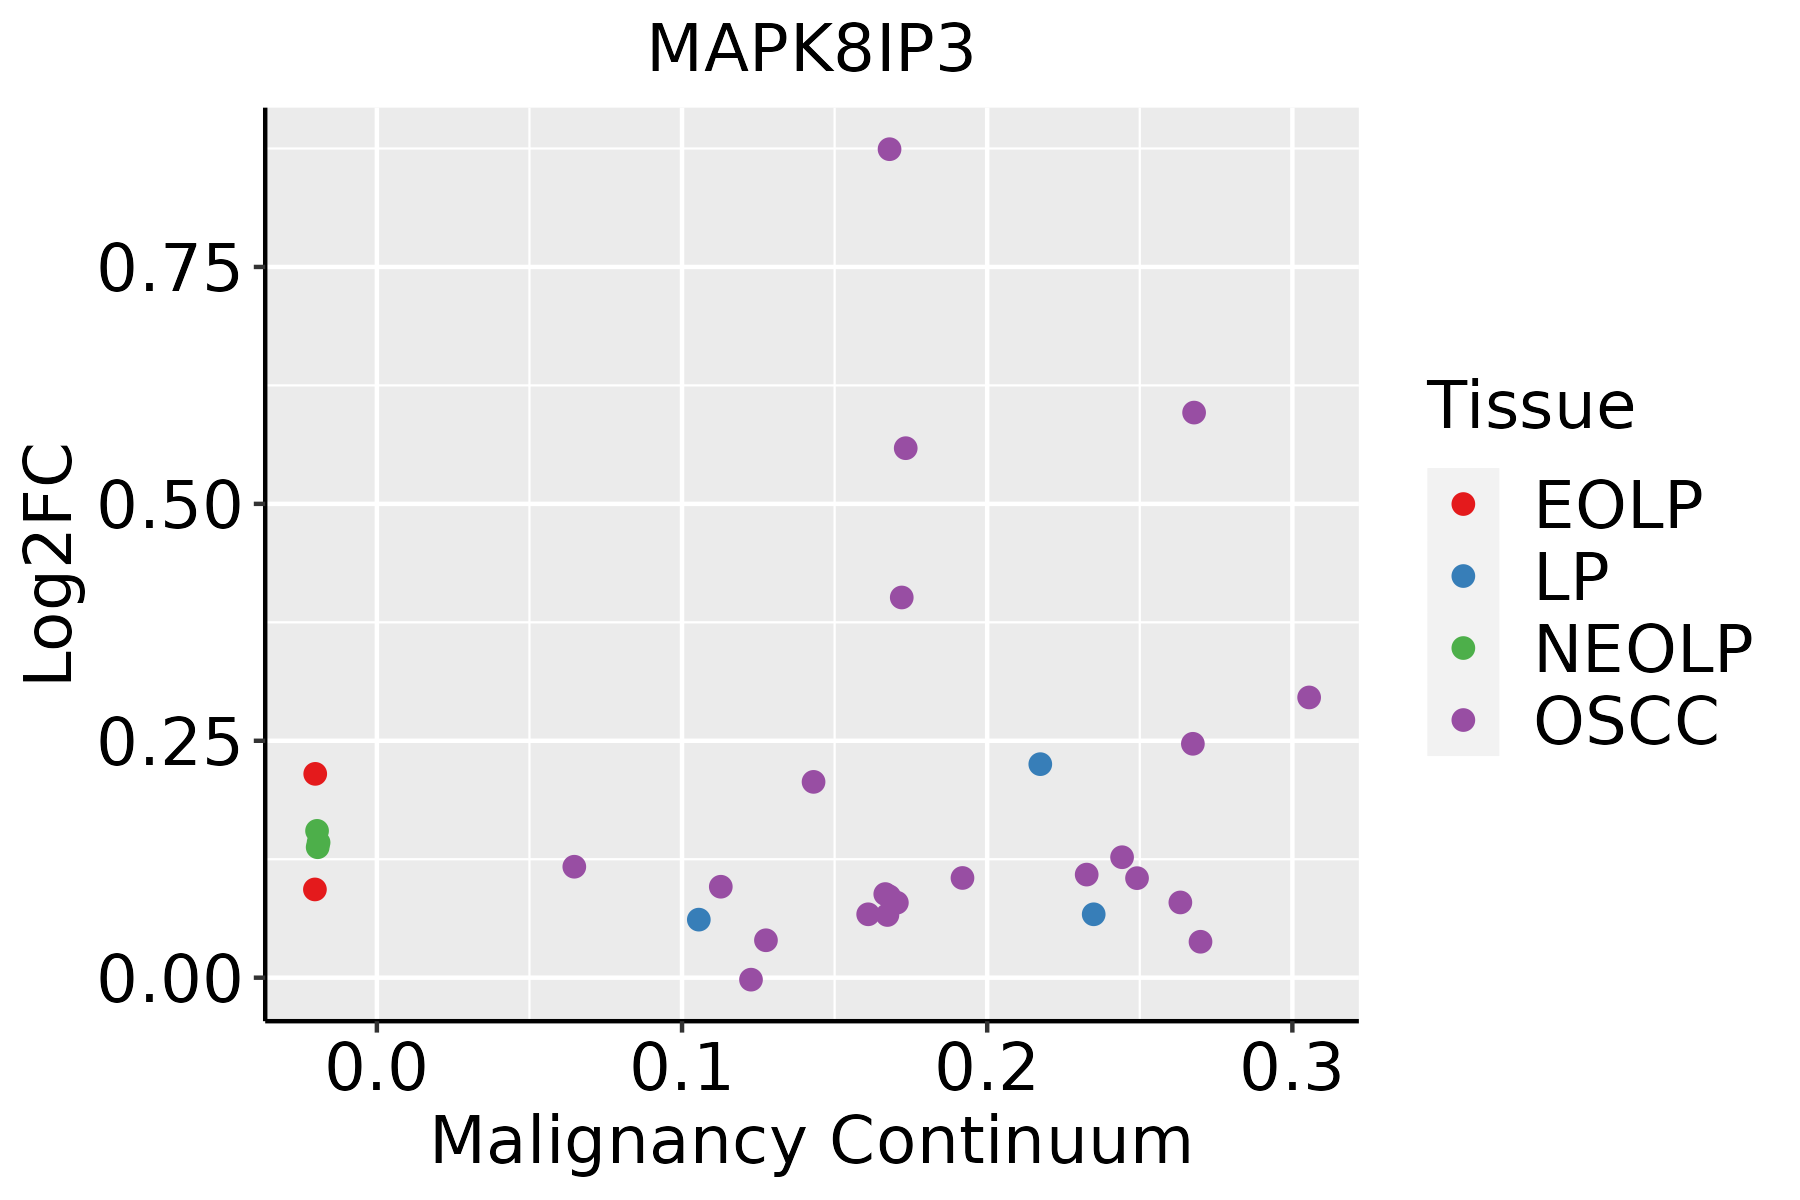 | EOLP: Erosive Oral lichen planus |
| LP: leukoplakia | ||
| NEOLP: Non-erosive oral lichen planus | ||
| OSCC: Oral squamous cell carcinoma |
| ∗log2FC in expression of this searched gene in stem-like cells from each diseased tissue sample relative to stem-like cells in normal samples in each tissue plotted against the malignancy continuum. Samples are colored based on if they are from different disease stage. |
Top |
Malignant transformation related pathway analysis |
| Find out the enriched GO biological processes and KEGG pathways involved in transition from healthy to precancer to cancer |
| Tissue | Disease Stage | Enriched GO biological Processes |
| Colorectum | AD |  |
| Colorectum | SER |  |
| Colorectum | MSS |  |
| Colorectum | MSI-H |  |
| Colorectum | FAP |  |
| ∗Top 15 enriched GO BP terms are showed in the bar plot of each disease state in each tissue. Each row represents a significant GO biological process which is colored according to the -log10(p.adjust). |
| Page: 1 2 3 4 5 6 7 8 9 |
| GO ID | Tissue | Disease Stage | Description | Gene Ratio | Bg Ratio | pvalue | p.adjust | Count |
| GO:0031647111 | Esophagus | ESCC | regulation of protein stability | 223/8552 | 298/18723 | 5.76e-25 | 1.52e-22 | 223 |
| GO:0050821111 | Esophagus | ESCC | protein stabilization | 140/8552 | 191/18723 | 6.50e-15 | 3.61e-13 | 140 |
| GO:003070518 | Esophagus | ESCC | cytoskeleton-dependent intracellular transport | 133/8552 | 195/18723 | 1.48e-10 | 4.27e-09 | 133 |
| GO:001097013 | Esophagus | ESCC | transport along microtubule | 107/8552 | 155/18723 | 3.17e-09 | 6.80e-08 | 107 |
| GO:000808810 | Esophagus | ESCC | axo-dendritic transport | 58/8552 | 75/18723 | 2.09e-08 | 4.02e-07 | 58 |
| GO:003109818 | Esophagus | ESCC | stress-activated protein kinase signaling cascade | 154/8552 | 247/18723 | 8.53e-08 | 1.44e-06 | 154 |
| GO:00989304 | Esophagus | ESCC | axonal transport | 49/8552 | 64/18723 | 4.54e-07 | 6.15e-06 | 49 |
| GO:005140318 | Esophagus | ESCC | stress-activated MAPK cascade | 147/8552 | 239/18723 | 5.43e-07 | 7.18e-06 | 147 |
| GO:003109910 | Esophagus | ESCC | regeneration | 122/8552 | 198/18723 | 4.26e-06 | 4.57e-05 | 122 |
| GO:007030217 | Esophagus | ESCC | regulation of stress-activated protein kinase signaling cascade | 119/8552 | 195/18723 | 1.07e-05 | 1.01e-04 | 119 |
| GO:00991114 | Esophagus | ESCC | microtubule-based transport | 115/8552 | 190/18723 | 2.54e-05 | 2.15e-04 | 115 |
| GO:003287217 | Esophagus | ESCC | regulation of stress-activated MAPK cascade | 116/8552 | 192/18723 | 2.63e-05 | 2.21e-04 | 116 |
| GO:00072549 | Esophagus | ESCC | JNK cascade | 102/8552 | 167/18723 | 4.22e-05 | 3.39e-04 | 102 |
| GO:00080892 | Esophagus | ESCC | anterograde axonal transport | 37/8552 | 50/18723 | 4.42e-05 | 3.51e-04 | 37 |
| GO:00311033 | Esophagus | ESCC | axon regeneration | 37/8552 | 52/18723 | 1.75e-04 | 1.14e-03 | 37 |
| GO:006156415 | Esophagus | ESCC | axon development | 251/8552 | 467/18723 | 2.41e-04 | 1.49e-03 | 251 |
| GO:00311024 | Esophagus | ESCC | neuron projection regeneration | 41/8552 | 60/18723 | 3.25e-04 | 1.91e-03 | 41 |
| GO:00463289 | Esophagus | ESCC | regulation of JNK cascade | 80/8552 | 133/18723 | 5.35e-04 | 2.95e-03 | 80 |
| GO:00486785 | Esophagus | ESCC | response to axon injury | 51/8552 | 83/18723 | 2.74e-03 | 1.16e-02 | 51 |
| GO:00703046 | Esophagus | ESCC | positive regulation of stress-activated protein kinase signaling cascade | 74/8552 | 128/18723 | 3.77e-03 | 1.53e-02 | 74 |
| Page: 1 2 3 4 5 |
| Pathway ID | Tissue | Disease Stage | Description | Gene Ratio | Bg Ratio | pvalue | p.adjust | qvalue | Count |
| hsa0401014 | Oral cavity | OSCC | MAPK signaling pathway | 165/3704 | 302/8465 | 7.11e-05 | 2.74e-04 | 1.40e-04 | 165 |
| hsa0401015 | Oral cavity | OSCC | MAPK signaling pathway | 165/3704 | 302/8465 | 7.11e-05 | 2.74e-04 | 1.40e-04 | 165 |
| hsa0401023 | Oral cavity | EOLP | MAPK signaling pathway | 68/1218 | 302/8465 | 7.48e-05 | 3.40e-04 | 2.01e-04 | 68 |
| hsa0401033 | Oral cavity | EOLP | MAPK signaling pathway | 68/1218 | 302/8465 | 7.48e-05 | 3.40e-04 | 2.01e-04 | 68 |
| hsa0401041 | Oral cavity | NEOLP | MAPK signaling pathway | 59/1112 | 302/8465 | 9.40e-04 | 4.67e-03 | 2.94e-03 | 59 |
| hsa0401051 | Oral cavity | NEOLP | MAPK signaling pathway | 59/1112 | 302/8465 | 9.40e-04 | 4.67e-03 | 2.94e-03 | 59 |
| Page: 1 |
Top |
Cell-cell communication analysis |
| Identification of potential cell-cell interactions between two cell types and their ligand-receptor pairs for different disease states |
| Ligand | Receptor | LRpair | Pathway | Tissue | Disease Stage |
| Page: 1 |
Top |
Single-cell gene regulatory network inference analysis |
| Find out the significant the regulons (TFs) and the target genes of each regulon across cell types for different disease states |
| TF | Cell Type | Tissue | Disease Stage | Target Gene | RSS | Regulon Activity |
| ∗The dot plots of a searched regulon are shown for all cell subpopulations in each disease state of each tissue based on the regulon specific score inferred using pySCENIC and by calculating the average expression. |
| Page: 1 |
Top |
Somatic mutation of malignant transformation related genes |
| Annotation of somatic variants for genes involved in malignant transformation |
| Hugo Symbol | Variant Class | Variant Classification | dbSNP RS | HGVSc | HGVSp | HGVSp Short | SWISSPROT | BIOTYPE | SIFT | PolyPhen | Tumor Sample Barcode | Tissue | Histology | Sex | Age | Stage | Therapy Types | Drugs | Outcome |
| MAPK8IP3 | SNV | Missense_Mutation | c.1009N>T | p.Asp337Tyr | p.D337Y | protein_coding | deleterious(0) | probably_damaging(0.999) | TCGA-B6-A0IM-01 | Breast | breast invasive carcinoma | Female | >=65 | I/II | Unknown | Unknown | SD | ||
| MAPK8IP3 | SNV | Missense_Mutation | novel | c.3665N>T | p.Pro1222Leu | p.P1222L | protein_coding | deleterious(0) | probably_damaging(0.999) | TCGA-BH-A0B6-01 | Breast | breast invasive carcinoma | Female | <65 | I/II | Unknown | Unknown | SD | |
| MAPK8IP3 | SNV | Missense_Mutation | c.659N>C | p.Arg220Pro | p.R220P | protein_coding | tolerated(0.38) | probably_damaging(0.998) | TCGA-BH-A0DO-01 | Breast | breast invasive carcinoma | Female | >=65 | I/II | Unknown | Unknown | SD | ||
| MAPK8IP3 | SNV | Missense_Mutation | c.2188N>A | p.Val730Ile | p.V730I | protein_coding | tolerated(0.25) | benign(0) | TCGA-BH-A0WA-01 | Breast | breast invasive carcinoma | Female | >=65 | I/II | Unknown | Unknown | SD | ||
| MAPK8IP3 | SNV | Missense_Mutation | c.1718N>C | p.Ile573Thr | p.I573T | protein_coding | deleterious(0) | probably_damaging(0.987) | TCGA-BH-A18Q-01 | Breast | breast invasive carcinoma | Female | <65 | I/II | Unknown | Unknown | SD | ||
| MAPK8IP3 | SNV | Missense_Mutation | novel | c.1959N>T | p.Glu653Asp | p.E653D | protein_coding | tolerated(0.09) | probably_damaging(0.992) | TCGA-C8-A274-01 | Breast | breast invasive carcinoma | Female | <65 | I/II | Hormone Therapy | tamoxiphen | SD | |
| MAPK8IP3 | SNV | Missense_Mutation | rs373344354 | c.1568N>A | p.Arg523His | p.R523H | protein_coding | deleterious(0) | probably_damaging(0.997) | TCGA-E2-A15D-01 | Breast | breast invasive carcinoma | Female | <65 | I/II | Hormone Therapy | tamoxiphen | SD | |
| MAPK8IP3 | SNV | Missense_Mutation | novel | c.2704N>T | p.Val902Leu | p.V902L | protein_coding | tolerated(0.31) | probably_damaging(0.981) | TCGA-E2-A1LE-01 | Breast | breast invasive carcinoma | Female | >=65 | III/IV | Chemotherapy | herceptin | PD | |
| MAPK8IP3 | SNV | Missense_Mutation | rs373340475 | c.929G>A | p.Arg310Gln | p.R310Q | protein_coding | tolerated(0.44) | benign(0.007) | TCGA-EW-A2FS-01 | Breast | breast invasive carcinoma | Female | <65 | I/II | Hormone Therapy | goserelin | SD | |
| MAPK8IP3 | deletion | Frame_Shift_Del | novel | c.1293delT | p.Leu432TrpfsTer7 | p.L432Wfs*7 | protein_coding | TCGA-D8-A27V-01 | Breast | breast invasive carcinoma | Female | <65 | I/II | Hormone Therapy | tamoxiphen | SD |
| Page: 1 2 3 4 5 6 7 8 9 10 11 12 |
Top |
Related drugs of malignant transformation related genes |
| Identification of chemicals and drugs interact with genes involved in malignant transfromation |
| (DGIdb 4.0) |
| Entrez ID | Symbol | Category | Interaction Types | Drug Claim Name | Drug Name | PMIDs |
| Page: 1 |

Copyright 2023-Present -The University of Texas Health Science Center at Houston |