
|
|||||
|
 | |
| |
| |
| |
| |
| |
|
Gene: MAPK8IP1 |
Gene summary for MAPK8IP1 |
| Gene information | Species | Human | Gene symbol | MAPK8IP1 | Gene ID | 9479 |
| Gene name | mitogen-activated protein kinase 8 interacting protein 1 | |
| Gene Alias | IB1 | |
| Cytomap | 11p11.2 | |
| Gene Type | protein-coding | GO ID | GO:0000165 | UniProtAcc | Q6NUQ9 |
Top |
Malignant transformation analysis |
| Identification of the aberrant gene expression in precancerous and cancerous lesions by comparing the gene expression of stem-like cells in diseased tissues with normal stem cells |
| Entrez ID | Symbol | Replicates | Species | Organ | Tissue | Adj P-value | Log2FC | Malignancy |
| 9479 | MAPK8IP1 | HCC1_Meng | Human | Liver | HCC | 1.12e-02 | -8.60e-03 | 0.0246 |
| 9479 | MAPK8IP1 | HCC2 | Human | Liver | HCC | 7.12e-10 | 2.06e+00 | 0.5341 |
| 9479 | MAPK8IP1 | S014 | Human | Liver | HCC | 9.08e-10 | 3.71e-01 | 0.2254 |
| 9479 | MAPK8IP1 | S015 | Human | Liver | HCC | 2.82e-06 | 3.21e-01 | 0.2375 |
| 9479 | MAPK8IP1 | S016 | Human | Liver | HCC | 3.92e-17 | 5.12e-01 | 0.2243 |
| 9479 | MAPK8IP1 | S028 | Human | Liver | HCC | 2.52e-06 | 3.12e-01 | 0.2503 |
| 9479 | MAPK8IP1 | S029 | Human | Liver | HCC | 3.31e-04 | 2.32e-01 | 0.2581 |
| 9479 | MAPK8IP1 | PTC06 | Human | Thyroid | PTC | 2.51e-02 | 7.67e-02 | 0.2057 |
| 9479 | MAPK8IP1 | PTC07 | Human | Thyroid | PTC | 2.72e-06 | 6.83e-02 | 0.2044 |
| 9479 | MAPK8IP1 | ATC09 | Human | Thyroid | ATC | 1.17e-08 | 3.51e-01 | 0.2871 |
| 9479 | MAPK8IP1 | ATC13 | Human | Thyroid | ATC | 1.48e-33 | 5.04e-01 | 0.34 |
| 9479 | MAPK8IP1 | ATC1 | Human | Thyroid | ATC | 4.24e-08 | 3.94e-01 | 0.2878 |
| 9479 | MAPK8IP1 | ATC4 | Human | Thyroid | ATC | 2.03e-07 | 7.79e-02 | 0.34 |
| 9479 | MAPK8IP1 | ATC5 | Human | Thyroid | ATC | 6.99e-29 | 5.47e-01 | 0.34 |
| Page: 1 |
| Tissue | Expression Dynamics | Abbreviation |
| Liver | 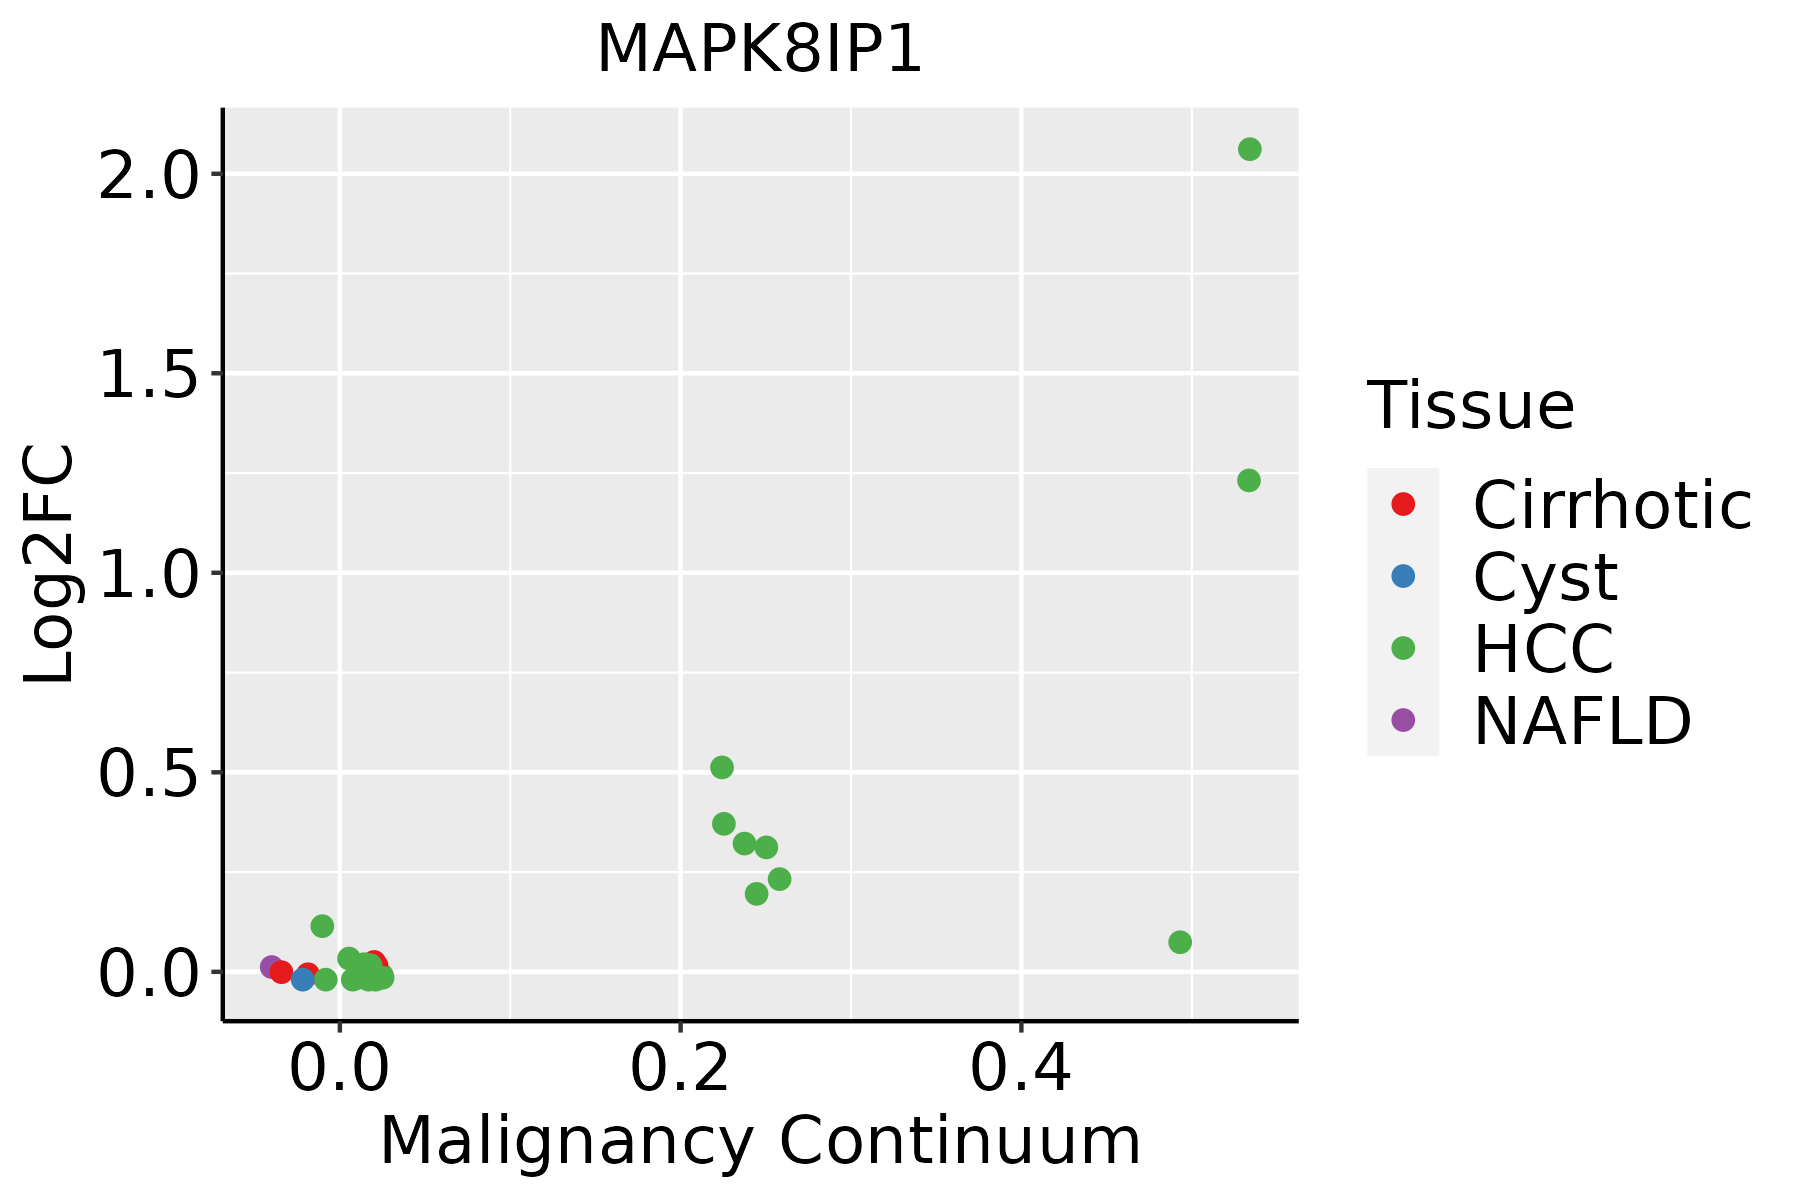 | HCC: Hepatocellular carcinoma |
| NAFLD: Non-alcoholic fatty liver disease | ||
| Thyroid | 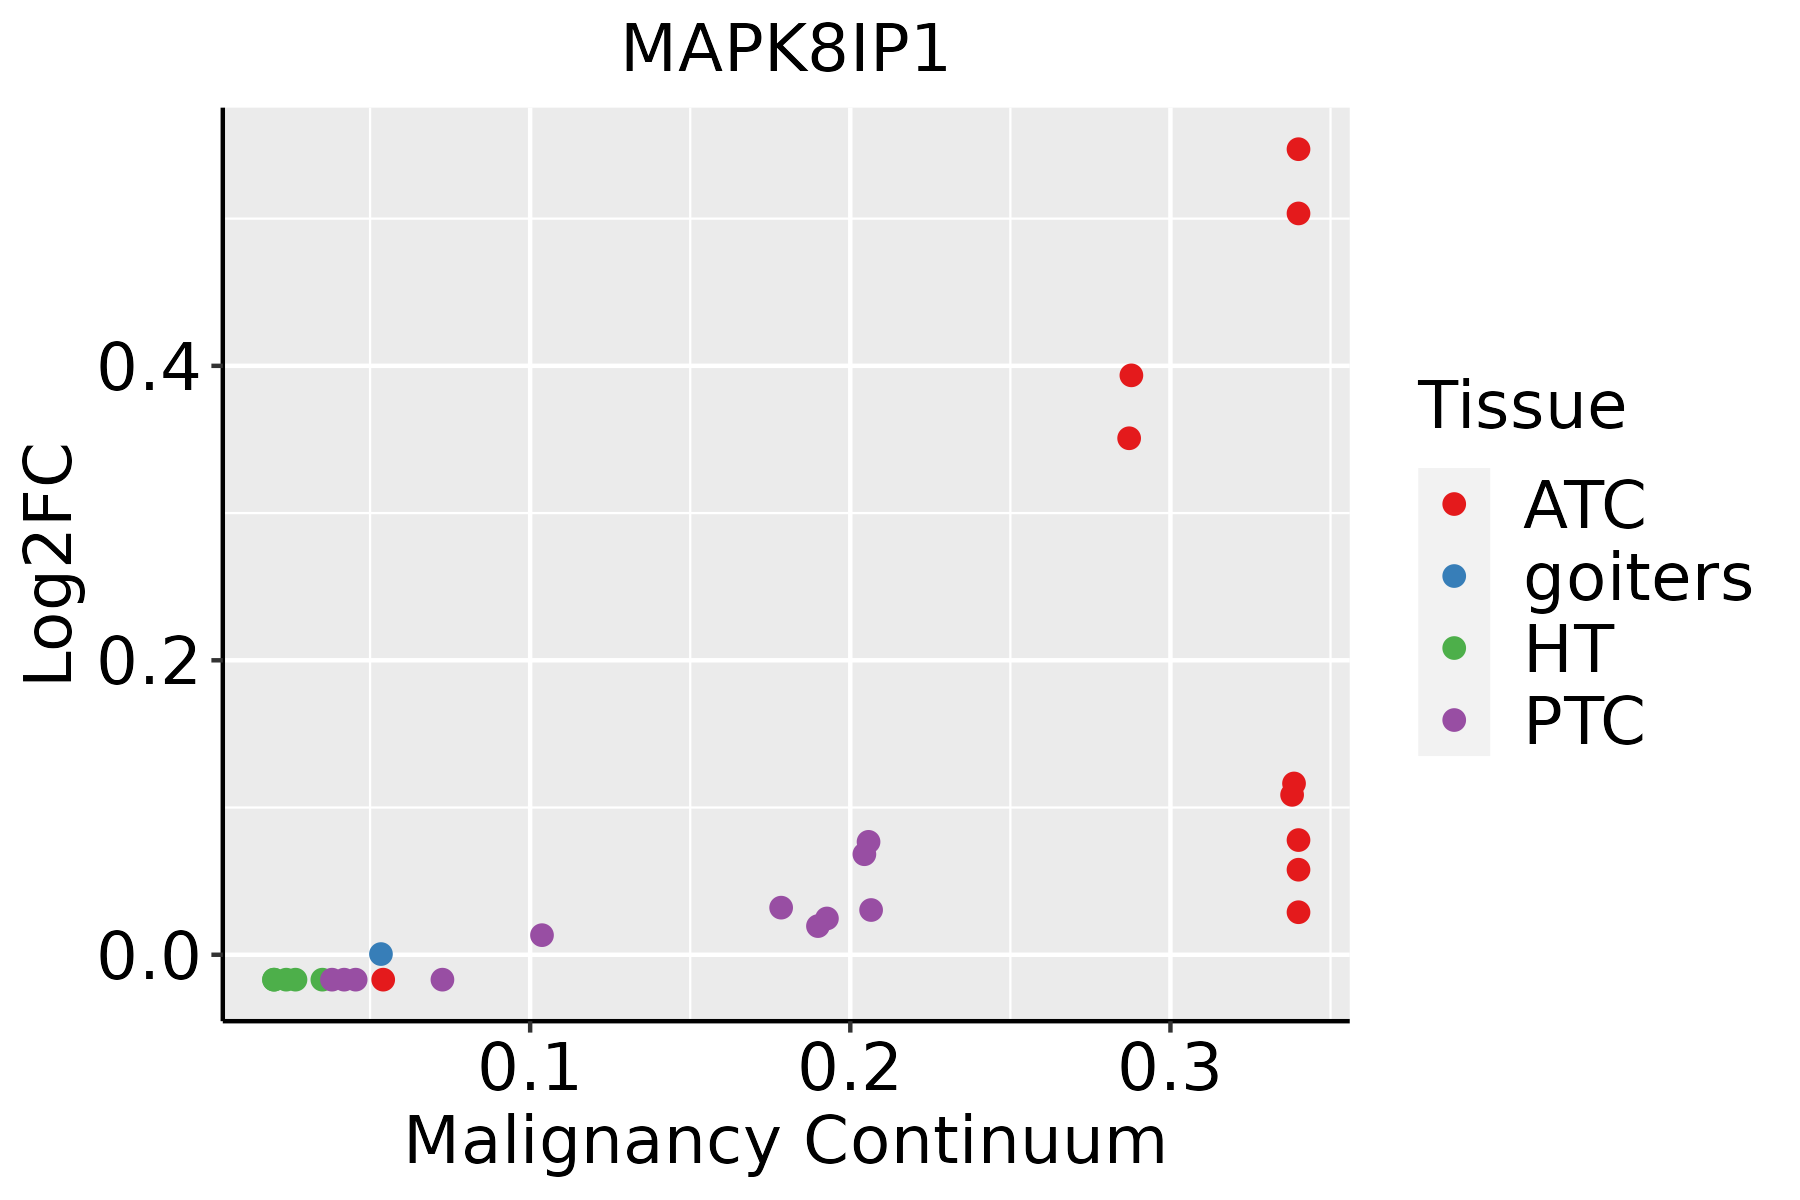 | ATC: Anaplastic thyroid cancer |
| HT: Hashimoto's thyroiditis | ||
| PTC: Papillary thyroid cancer |
| ∗log2FC in expression of this searched gene in stem-like cells from each diseased tissue sample relative to stem-like cells in normal samples in each tissue plotted against the malignancy continuum. Samples are colored based on if they are from different disease stage. |
Top |
Malignant transformation related pathway analysis |
| Find out the enriched GO biological processes and KEGG pathways involved in transition from healthy to precancer to cancer |
| Tissue | Disease Stage | Enriched GO biological Processes |
| Colorectum | AD |  |
| Colorectum | SER |  |
| Colorectum | MSS |  |
| Colorectum | MSI-H |  |
| Colorectum | FAP |  |
| ∗Top 15 enriched GO BP terms are showed in the bar plot of each disease state in each tissue. Each row represents a significant GO biological process which is colored according to the -log10(p.adjust). |
| Page: 1 2 3 4 5 6 7 8 9 |
| GO ID | Tissue | Disease Stage | Description | Gene Ratio | Bg Ratio | pvalue | p.adjust | Count |
| GO:200123322 | Liver | HCC | regulation of apoptotic signaling pathway | 226/7958 | 356/18723 | 7.26e-16 | 5.68e-14 | 226 |
| GO:009719322 | Liver | HCC | intrinsic apoptotic signaling pathway | 184/7958 | 288/18723 | 1.50e-13 | 8.32e-12 | 184 |
| GO:001056322 | Liver | HCC | negative regulation of phosphorus metabolic process | 259/7958 | 442/18723 | 4.29e-12 | 1.92e-10 | 259 |
| GO:004593622 | Liver | HCC | negative regulation of phosphate metabolic process | 258/7958 | 441/18723 | 6.00e-12 | 2.60e-10 | 258 |
| GO:200123412 | Liver | HCC | negative regulation of apoptotic signaling pathway | 145/7958 | 224/18723 | 1.33e-11 | 5.36e-10 | 145 |
| GO:004232622 | Liver | HCC | negative regulation of phosphorylation | 227/7958 | 385/18723 | 3.98e-11 | 1.52e-09 | 227 |
| GO:005134822 | Liver | HCC | negative regulation of transferase activity | 166/7958 | 268/18723 | 8.97e-11 | 3.18e-09 | 166 |
| GO:200124212 | Liver | HCC | regulation of intrinsic apoptotic signaling pathway | 109/7958 | 164/18723 | 4.52e-10 | 1.45e-08 | 109 |
| GO:003367322 | Liver | HCC | negative regulation of kinase activity | 144/7958 | 237/18723 | 9.76e-09 | 2.45e-07 | 144 |
| GO:000193322 | Liver | HCC | negative regulation of protein phosphorylation | 196/7958 | 342/18723 | 1.95e-08 | 4.63e-07 | 196 |
| GO:200124312 | Liver | HCC | negative regulation of intrinsic apoptotic signaling pathway | 67/7958 | 98/18723 | 1.97e-07 | 3.55e-06 | 67 |
| GO:000646912 | Liver | HCC | negative regulation of protein kinase activity | 126/7958 | 212/18723 | 4.55e-07 | 7.49e-06 | 126 |
| GO:003109822 | Liver | HCC | stress-activated protein kinase signaling cascade | 138/7958 | 247/18723 | 1.43e-05 | 1.57e-04 | 138 |
| GO:005140322 | Liver | HCC | stress-activated MAPK cascade | 134/7958 | 239/18723 | 1.50e-05 | 1.64e-04 | 134 |
| GO:007190021 | Liver | HCC | regulation of protein serine/threonine kinase activity | 189/7958 | 359/18723 | 5.97e-05 | 5.47e-04 | 189 |
| GO:00434097 | Liver | HCC | negative regulation of MAPK cascade | 98/7958 | 180/18723 | 7.88e-04 | 4.74e-03 | 98 |
| GO:007030222 | Liver | HCC | regulation of stress-activated protein kinase signaling cascade | 105/7958 | 195/18723 | 8.79e-04 | 5.20e-03 | 105 |
| GO:003287312 | Liver | HCC | negative regulation of stress-activated MAPK cascade | 33/7958 | 51/18723 | 1.13e-03 | 6.44e-03 | 33 |
| GO:007030312 | Liver | HCC | negative regulation of stress-activated protein kinase signaling cascade | 33/7958 | 51/18723 | 1.13e-03 | 6.44e-03 | 33 |
| GO:003287222 | Liver | HCC | regulation of stress-activated MAPK cascade | 102/7958 | 192/18723 | 1.86e-03 | 9.49e-03 | 102 |
| Page: 1 2 3 4 |
| Pathway ID | Tissue | Disease Stage | Description | Gene Ratio | Bg Ratio | pvalue | p.adjust | qvalue | Count |
| Page: 1 |
Top |
Cell-cell communication analysis |
| Identification of potential cell-cell interactions between two cell types and their ligand-receptor pairs for different disease states |
| Ligand | Receptor | LRpair | Pathway | Tissue | Disease Stage |
| Page: 1 |
Top |
Single-cell gene regulatory network inference analysis |
| Find out the significant the regulons (TFs) and the target genes of each regulon across cell types for different disease states |
| TF | Cell Type | Tissue | Disease Stage | Target Gene | RSS | Regulon Activity |
| ∗The dot plots of a searched regulon are shown for all cell subpopulations in each disease state of each tissue based on the regulon specific score inferred using pySCENIC and by calculating the average expression. |
| Page: 1 |
Top |
Somatic mutation of malignant transformation related genes |
| Annotation of somatic variants for genes involved in malignant transformation |
| Hugo Symbol | Variant Class | Variant Classification | dbSNP RS | HGVSc | HGVSp | HGVSp Short | SWISSPROT | BIOTYPE | SIFT | PolyPhen | Tumor Sample Barcode | Tissue | Histology | Sex | Age | Stage | Therapy Types | Drugs | Outcome |
| MAPK8IP1 | SNV | Missense_Mutation | c.1285N>A | p.Glu429Lys | p.E429K | Q9UQF2 | protein_coding | tolerated(0.09) | benign(0.038) | TCGA-C8-A26Y-01 | Breast | breast invasive carcinoma | Female | >=65 | I/II | Unknown | Unknown | SD | |
| MAPK8IP1 | deletion | Frame_Shift_Del | c.578_587delNNNNNNNNNN | p.Arg194HisfsTer3 | p.R194Hfs*3 | Q9UQF2 | protein_coding | TCGA-A8-A09M-01 | Breast | breast invasive carcinoma | Female | >=65 | III/IV | Chemotherapy | paclitaxel | CR | |||
| MAPK8IP1 | deletion | Frame_Shift_Del | novel | c.2002delC | p.Arg668GlyfsTer66 | p.R668Gfs*66 | Q9UQF2 | protein_coding | TCGA-EW-A2FV-01 | Breast | breast invasive carcinoma | Female | <65 | III/IV | Chemotherapy | docetaxel | SD | ||
| MAPK8IP1 | SNV | Missense_Mutation | c.1294N>A | p.Glu432Lys | p.E432K | Q9UQF2 | protein_coding | tolerated(0.06) | possibly_damaging(0.621) | TCGA-IR-A3LF-01 | Cervix | cervical & endocervical cancer | Female | <65 | I/II | Unknown | Unknown | SD | |
| MAPK8IP1 | SNV | Missense_Mutation | novel | c.932N>T | p.Ser311Phe | p.S311F | Q9UQF2 | protein_coding | deleterious(0) | probably_damaging(0.996) | TCGA-VS-A958-01 | Cervix | cervical & endocervical cancer | Female | <65 | I/II | Chemotherapy | cisplatin | CR |
| MAPK8IP1 | SNV | Missense_Mutation | rs746604189 | c.713N>A | p.Arg238His | p.R238H | Q9UQF2 | protein_coding | deleterious(0) | possibly_damaging(0.902) | TCGA-AA-3492-01 | Colorectum | colon adenocarcinoma | Female | >=65 | I/II | Unknown | Unknown | SD |
| MAPK8IP1 | SNV | Missense_Mutation | c.1973N>A | p.Gly658Glu | p.G658E | Q9UQF2 | protein_coding | deleterious(0) | probably_damaging(0.999) | TCGA-AA-3667-01 | Colorectum | colon adenocarcinoma | Female | <65 | I/II | Unknown | Unknown | SD | |
| MAPK8IP1 | SNV | Missense_Mutation | c.1190N>A | p.Arg397Gln | p.R397Q | Q9UQF2 | protein_coding | tolerated(0.06) | benign(0.102) | TCGA-AA-3854-01 | Colorectum | colon adenocarcinoma | Female | >=65 | I/II | Unknown | Unknown | SD | |
| MAPK8IP1 | SNV | Missense_Mutation | rs774929831 | c.974C>T | p.Pro325Leu | p.P325L | Q9UQF2 | protein_coding | tolerated(0.1) | benign(0.026) | TCGA-AA-A022-01 | Colorectum | colon adenocarcinoma | Female | >=65 | I/II | Unknown | Unknown | SD |
| MAPK8IP1 | SNV | Missense_Mutation | novel | c.1277N>T | p.Ala426Val | p.A426V | Q9UQF2 | protein_coding | tolerated(0.06) | benign(0.164) | TCGA-AD-6895-01 | Colorectum | colon adenocarcinoma | Male | >=65 | III/IV | Unknown | Unknown | SD |
| Page: 1 2 3 4 5 6 |
Top |
Related drugs of malignant transformation related genes |
| Identification of chemicals and drugs interact with genes involved in malignant transfromation |
| (DGIdb 4.0) |
| Entrez ID | Symbol | Category | Interaction Types | Drug Claim Name | Drug Name | PMIDs |
| Page: 1 |

Copyright 2023-Present -The University of Texas Health Science Center at Houston |