
|
|||||
|
 | |
| |
| |
| |
| |
| |
|
Gene: MAPK8 |
Gene summary for MAPK8 |
| Gene information | Species | Human | Gene symbol | MAPK8 | Gene ID | 5599 |
| Gene name | mitogen-activated protein kinase 8 | |
| Gene Alias | JNK | |
| Cytomap | 10q11.22 | |
| Gene Type | protein-coding | GO ID | GO:0000165 | UniProtAcc | A1L4K2 |
Top |
Malignant transformation analysis |
| Identification of the aberrant gene expression in precancerous and cancerous lesions by comparing the gene expression of stem-like cells in diseased tissues with normal stem cells |
| Entrez ID | Symbol | Replicates | Species | Organ | Tissue | Adj P-value | Log2FC | Malignancy |
| 5599 | MAPK8 | CCI_1 | Human | Cervix | CC | 4.75e-07 | 6.19e-01 | 0.528 |
| 5599 | MAPK8 | CCI_2 | Human | Cervix | CC | 5.03e-08 | 1.12e+00 | 0.5249 |
| 5599 | MAPK8 | CCI_3 | Human | Cervix | CC | 7.14e-18 | 9.97e-01 | 0.516 |
| 5599 | MAPK8 | HTA11_3410_2000001011 | Human | Colorectum | AD | 4.49e-17 | -6.47e-01 | 0.0155 |
| 5599 | MAPK8 | HTA11_2487_2000001011 | Human | Colorectum | SER | 2.27e-04 | -5.57e-01 | -0.1808 |
| 5599 | MAPK8 | HTA11_1938_2000001011 | Human | Colorectum | AD | 1.69e-02 | -3.49e-01 | -0.0811 |
| 5599 | MAPK8 | HTA11_3361_2000001011 | Human | Colorectum | AD | 3.07e-05 | -6.24e-01 | -0.1207 |
| 5599 | MAPK8 | HTA11_696_2000001011 | Human | Colorectum | AD | 6.31e-18 | -5.38e-01 | -0.1464 |
| 5599 | MAPK8 | HTA11_866_2000001011 | Human | Colorectum | AD | 8.76e-07 | -4.62e-01 | -0.1001 |
| 5599 | MAPK8 | HTA11_1391_2000001011 | Human | Colorectum | AD | 6.01e-04 | -4.72e-01 | -0.059 |
| 5599 | MAPK8 | HTA11_546_2000001011 | Human | Colorectum | AD | 4.15e-02 | -5.21e-01 | -0.0842 |
| 5599 | MAPK8 | HTA11_866_3004761011 | Human | Colorectum | AD | 2.87e-07 | -5.14e-01 | 0.096 |
| 5599 | MAPK8 | HTA11_8622_2000001021 | Human | Colorectum | SER | 1.77e-02 | -6.41e-01 | 0.0528 |
| 5599 | MAPK8 | HTA11_10711_2000001011 | Human | Colorectum | AD | 1.97e-04 | -5.05e-01 | 0.0338 |
| 5599 | MAPK8 | HTA11_7696_3000711011 | Human | Colorectum | AD | 1.07e-14 | -5.57e-01 | 0.0674 |
| 5599 | MAPK8 | HTA11_6818_2000001011 | Human | Colorectum | AD | 7.85e-03 | -5.99e-01 | 0.0112 |
| 5599 | MAPK8 | HTA11_99999970781_79442 | Human | Colorectum | MSS | 5.81e-11 | -4.24e-01 | 0.294 |
| 5599 | MAPK8 | HTA11_99999973899_84307 | Human | Colorectum | MSS | 1.07e-04 | -5.96e-01 | 0.2585 |
| 5599 | MAPK8 | HTA11_99999974143_84620 | Human | Colorectum | MSS | 3.58e-12 | -5.48e-01 | 0.3005 |
| 5599 | MAPK8 | A015-C-203 | Human | Colorectum | FAP | 4.97e-18 | -1.79e-01 | -0.1294 |
| Page: 1 2 3 4 5 6 7 8 9 |
| Tissue | Expression Dynamics | Abbreviation |
| Cervix | 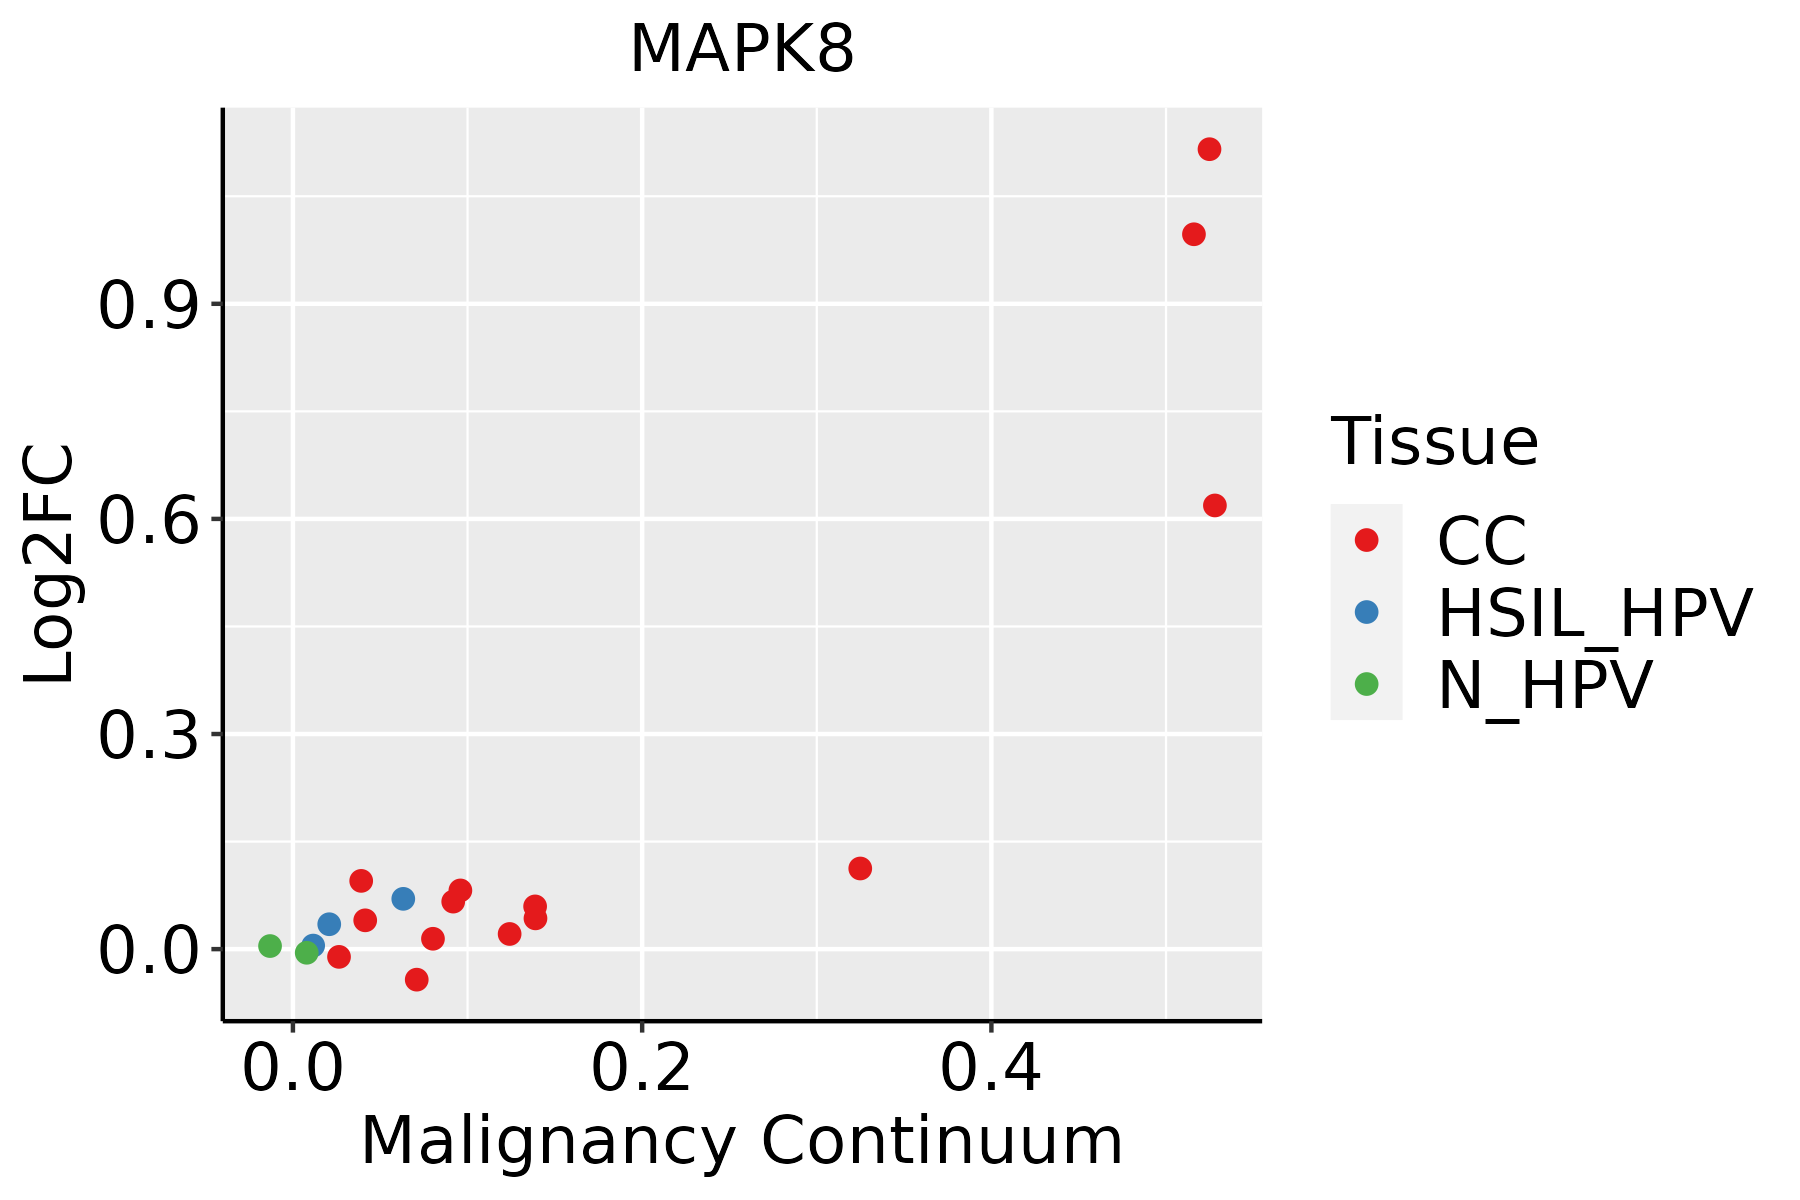 | CC: Cervix cancer |
| HSIL_HPV: HPV-infected high-grade squamous intraepithelial lesions | ||
| N_HPV: HPV-infected normal cervix | ||
| Colorectum (GSE201348) |  | FAP: Familial adenomatous polyposis |
| CRC: Colorectal cancer | ||
| Colorectum (HTA11) |  | AD: Adenomas |
| SER: Sessile serrated lesions | ||
| MSI-H: Microsatellite-high colorectal cancer | ||
| MSS: Microsatellite stable colorectal cancer | ||
| Endometrium |  | AEH: Atypical endometrial hyperplasia |
| EEC: Endometrioid Cancer | ||
| Esophagus | 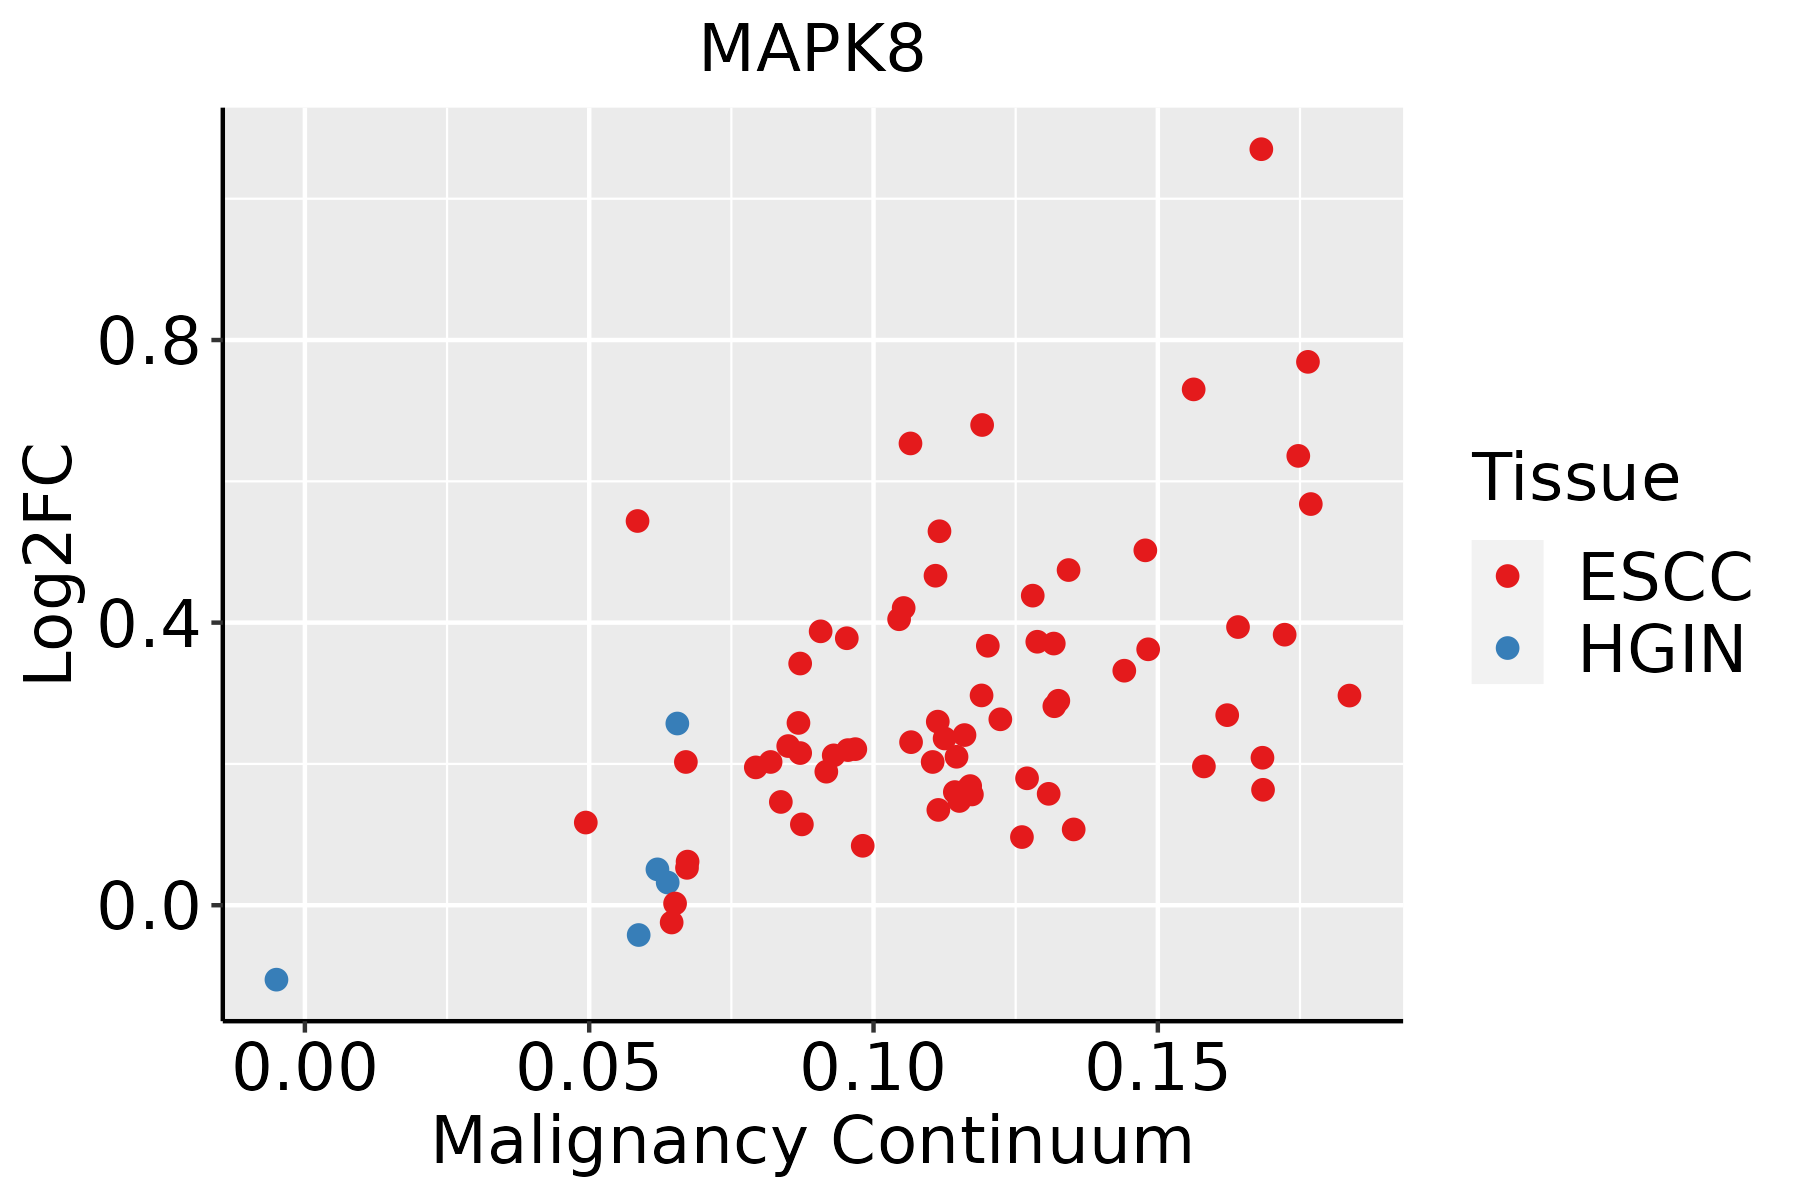 | ESCC: Esophageal squamous cell carcinoma |
| HGIN: High-grade intraepithelial neoplasias | ||
| LGIN: Low-grade intraepithelial neoplasias | ||
| Liver | 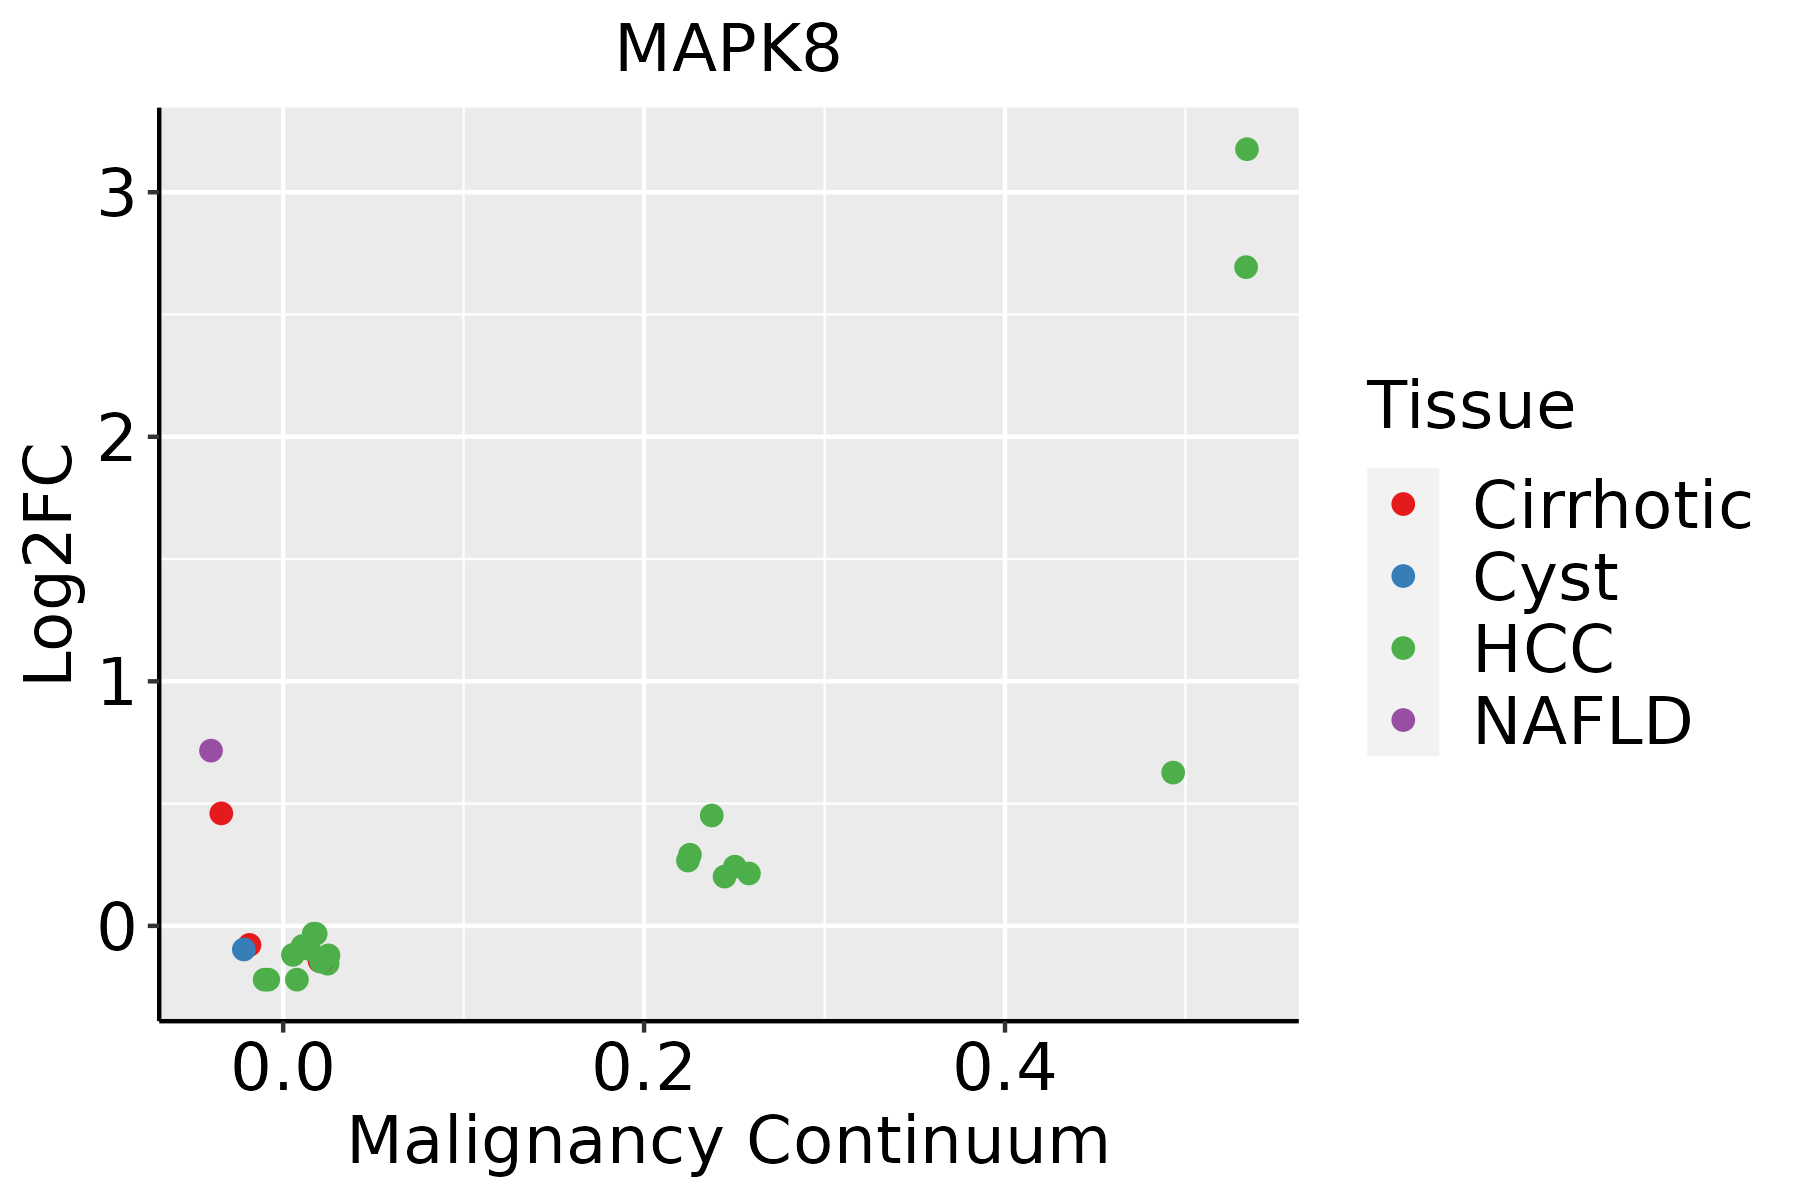 | HCC: Hepatocellular carcinoma |
| NAFLD: Non-alcoholic fatty liver disease | ||
| Lung | 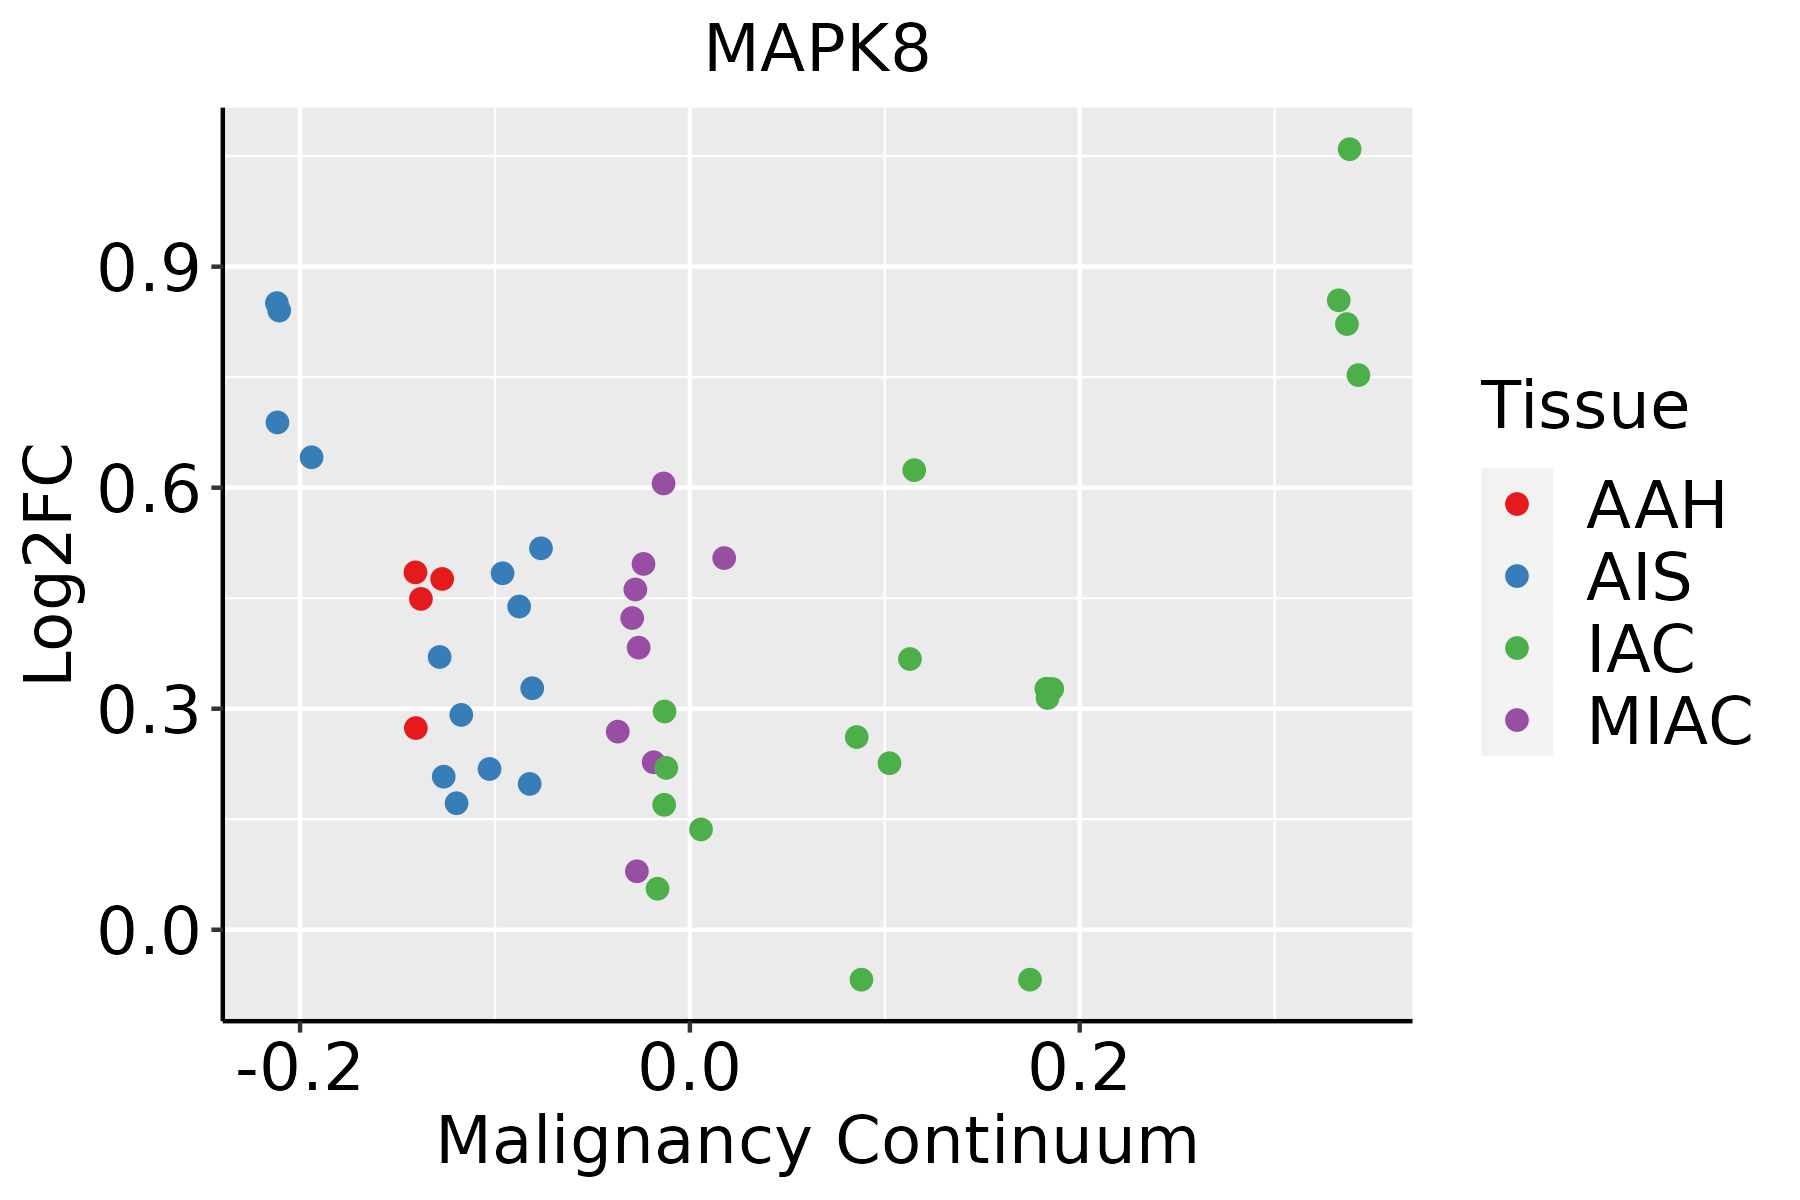 | AAH: Atypical adenomatous hyperplasia |
| AIS: Adenocarcinoma in situ | ||
| IAC: Invasive lung adenocarcinoma | ||
| MIA: Minimally invasive adenocarcinoma | ||
| Oral Cavity | 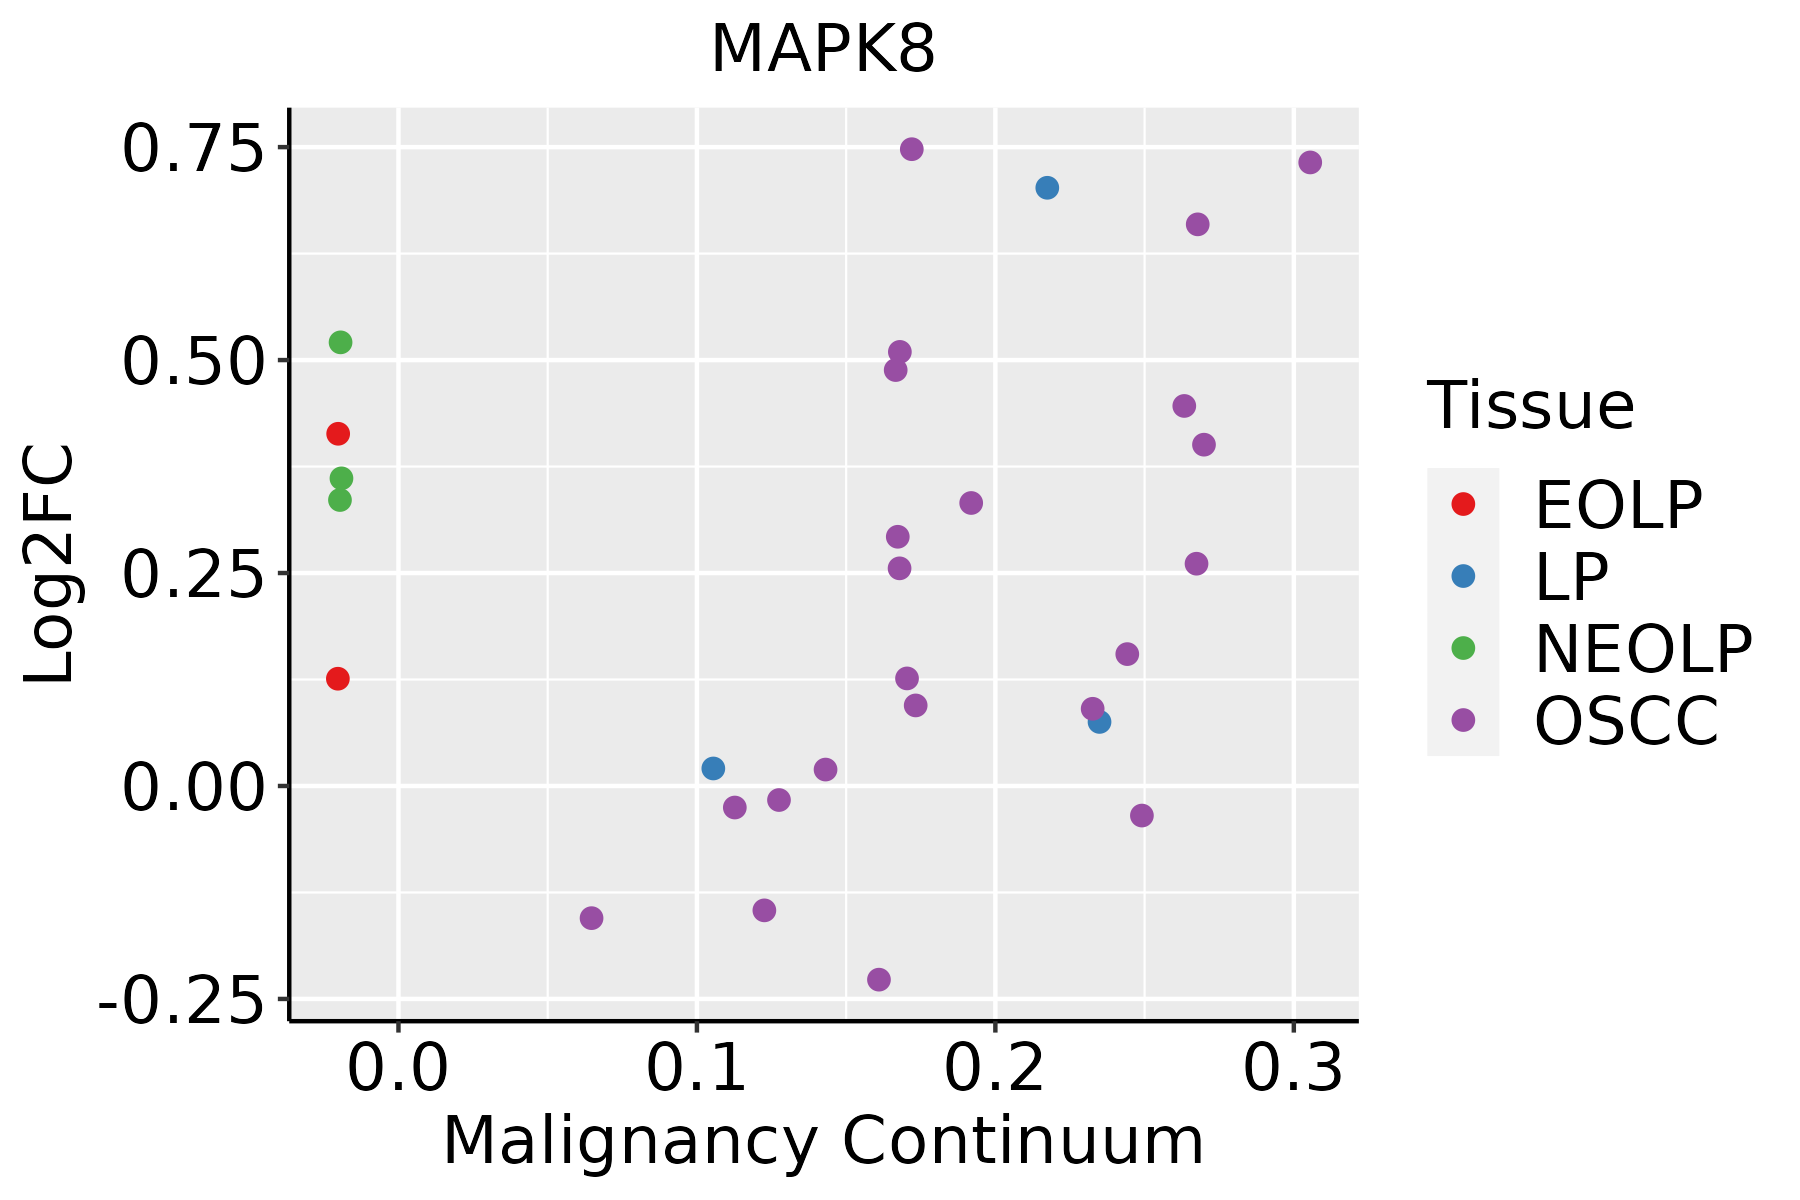 | EOLP: Erosive Oral lichen planus |
| LP: leukoplakia | ||
| NEOLP: Non-erosive oral lichen planus | ||
| OSCC: Oral squamous cell carcinoma | ||
| Prostate | 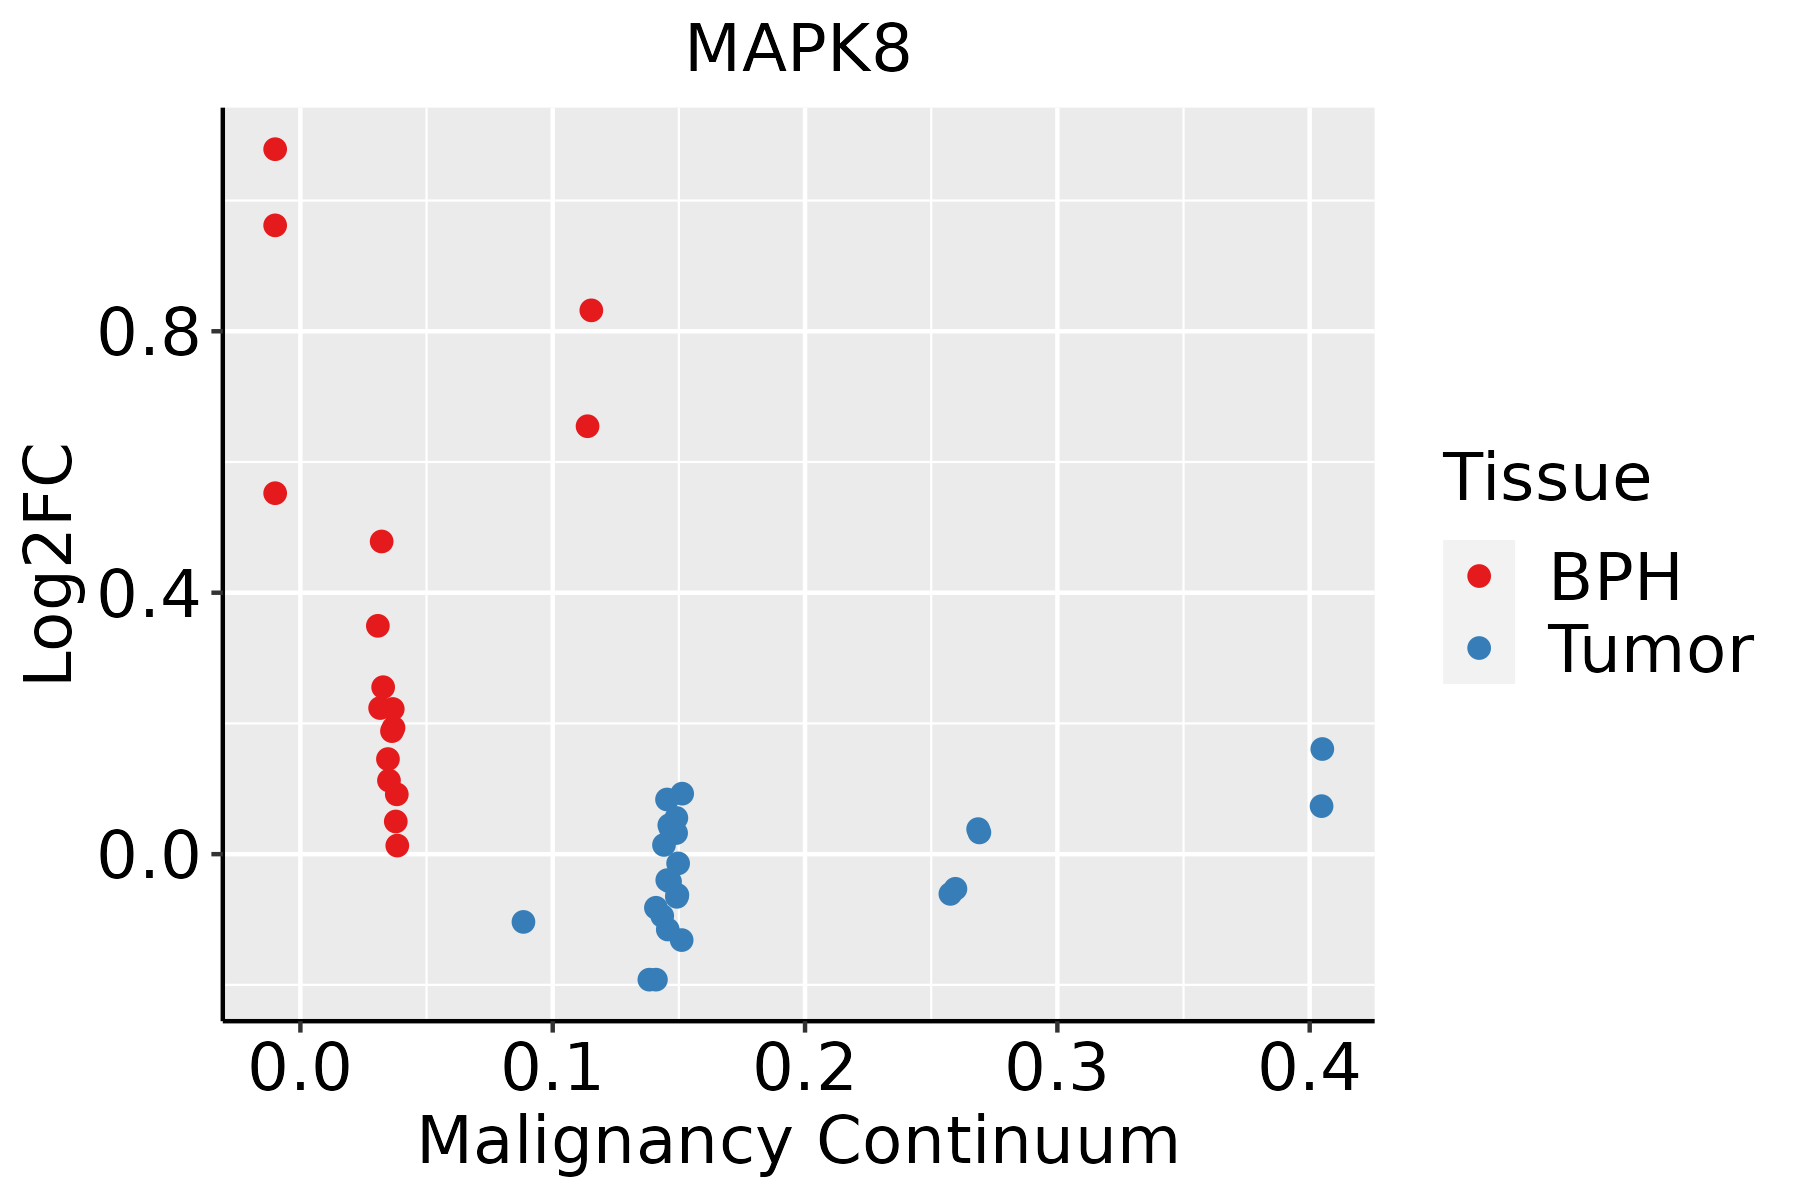 | BPH: Benign Prostatic Hyperplasia |
| Skin |  | AK: Actinic keratosis |
| cSCC: Cutaneous squamous cell carcinoma | ||
| SCCIS:squamous cell carcinoma in situ |
| ∗log2FC in expression of this searched gene in stem-like cells from each diseased tissue sample relative to stem-like cells in normal samples in each tissue plotted against the malignancy continuum. Samples are colored based on if they are from different disease stage. |
Top |
Malignant transformation related pathway analysis |
| Find out the enriched GO biological processes and KEGG pathways involved in transition from healthy to precancer to cancer |
| Tissue | Disease Stage | Enriched GO biological Processes |
| Colorectum | AD |  |
| Colorectum | SER |  |
| Colorectum | MSS |  |
| Colorectum | MSI-H |  |
| Colorectum | FAP |  |
| ∗Top 15 enriched GO BP terms are showed in the bar plot of each disease state in each tissue. Each row represents a significant GO biological process which is colored according to the -log10(p.adjust). |
| Page: 1 2 3 4 5 6 7 8 9 |
| GO ID | Tissue | Disease Stage | Description | Gene Ratio | Bg Ratio | pvalue | p.adjust | Count |
| GO:00725949 | Cervix | CC | establishment of protein localization to organelle | 99/2311 | 422/18723 | 1.23e-10 | 2.11e-08 | 99 |
| GO:000697910 | Cervix | CC | response to oxidative stress | 102/2311 | 446/18723 | 2.99e-10 | 4.36e-08 | 102 |
| GO:190382910 | Cervix | CC | positive regulation of cellular protein localization | 72/2311 | 276/18723 | 3.20e-10 | 4.46e-08 | 72 |
| GO:007149610 | Cervix | CC | cellular response to external stimulus | 78/2311 | 320/18723 | 1.82e-09 | 1.98e-07 | 78 |
| GO:005122210 | Cervix | CC | positive regulation of protein transport | 72/2311 | 303/18723 | 2.36e-08 | 1.70e-06 | 72 |
| GO:190495110 | Cervix | CC | positive regulation of establishment of protein localization | 73/2311 | 319/18723 | 9.69e-08 | 5.25e-06 | 73 |
| GO:000030210 | Cervix | CC | response to reactive oxygen species | 56/2311 | 222/18723 | 1.00e-07 | 5.25e-06 | 56 |
| GO:006219710 | Cervix | CC | cellular response to chemical stress | 76/2311 | 337/18723 | 1.01e-07 | 5.25e-06 | 76 |
| GO:005109810 | Cervix | CC | regulation of binding | 80/2311 | 363/18723 | 1.32e-07 | 6.42e-06 | 80 |
| GO:00027644 | Cervix | CC | immune response-regulating signaling pathway | 97/2311 | 468/18723 | 1.49e-07 | 7.07e-06 | 97 |
| GO:00075689 | Cervix | CC | aging | 75/2311 | 339/18723 | 2.75e-07 | 1.13e-05 | 75 |
| GO:00316689 | Cervix | CC | cellular response to extracellular stimulus | 59/2311 | 246/18723 | 3.03e-07 | 1.24e-05 | 59 |
| GO:00068399 | Cervix | CC | mitochondrial transport | 60/2311 | 254/18723 | 4.21e-07 | 1.67e-05 | 60 |
| GO:00022379 | Cervix | CC | response to molecule of bacterial origin | 78/2311 | 363/18723 | 5.55e-07 | 2.06e-05 | 78 |
| GO:00310988 | Cervix | CC | stress-activated protein kinase signaling cascade | 58/2311 | 247/18723 | 8.02e-07 | 2.89e-05 | 58 |
| GO:00324969 | Cervix | CC | response to lipopolysaccharide | 74/2311 | 343/18723 | 9.15e-07 | 3.25e-05 | 74 |
| GO:00485118 | Cervix | CC | rhythmic process | 65/2311 | 298/18723 | 2.79e-06 | 8.04e-05 | 65 |
| GO:00514038 | Cervix | CC | stress-activated MAPK cascade | 55/2311 | 239/18723 | 2.96e-06 | 8.31e-05 | 55 |
| GO:00903167 | Cervix | CC | positive regulation of intracellular protein transport | 41/2311 | 160/18723 | 3.24e-06 | 8.80e-05 | 41 |
| GO:00380933 | Cervix | CC | Fc receptor signaling pathway | 19/2311 | 50/18723 | 3.42e-06 | 9.17e-05 | 19 |
| Page: 1 2 3 4 5 6 7 8 9 10 11 12 13 14 15 16 17 18 19 20 21 22 23 24 25 26 27 28 29 30 31 32 33 34 35 36 37 38 39 40 41 42 43 44 45 46 47 48 49 50 51 52 53 54 55 56 57 58 59 60 61 62 63 64 65 66 67 68 69 70 71 72 73 74 75 76 77 78 79 80 81 82 83 |
| Pathway ID | Tissue | Disease Stage | Description | Gene Ratio | Bg Ratio | pvalue | p.adjust | qvalue | Count |
| hsa0517120 | Cervix | CC | Coronavirus disease - COVID-19 | 111/1267 | 232/8465 | 1.82e-33 | 5.90e-31 | 3.49e-31 | 111 |
| hsa0520820 | Cervix | CC | Chemical carcinogenesis - reactive oxygen species | 92/1267 | 223/8465 | 4.71e-22 | 5.09e-20 | 3.01e-20 | 92 |
| hsa0501220 | Cervix | CC | Parkinson disease | 102/1267 | 266/8465 | 1.81e-21 | 1.47e-19 | 8.66e-20 | 102 |
| hsa0502018 | Cervix | CC | Prion disease | 98/1267 | 273/8465 | 2.64e-18 | 1.42e-16 | 8.42e-17 | 98 |
| hsa0541520 | Cervix | CC | Diabetic cardiomyopathy | 76/1267 | 203/8465 | 1.40e-15 | 6.46e-14 | 3.82e-14 | 76 |
| hsa0501018 | Cervix | CC | Alzheimer disease | 113/1267 | 384/8465 | 9.67e-14 | 3.92e-12 | 2.32e-12 | 113 |
| hsa0501618 | Cervix | CC | Huntington disease | 94/1267 | 306/8465 | 8.49e-13 | 3.06e-11 | 1.81e-11 | 94 |
| hsa0502218 | Cervix | CC | Pathways of neurodegeneration - multiple diseases | 128/1267 | 476/8465 | 2.87e-12 | 9.29e-11 | 5.50e-11 | 128 |
| hsa0493218 | Cervix | CC | Non-alcoholic fatty liver disease | 58/1267 | 155/8465 | 3.58e-12 | 1.05e-10 | 6.23e-11 | 58 |
| hsa0541820 | Cervix | CC | Fluid shear stress and atherosclerosis | 50/1267 | 139/8465 | 5.71e-10 | 1.32e-08 | 7.81e-09 | 50 |
| hsa0513020 | Cervix | CC | Pathogenic Escherichia coli infection | 63/1267 | 197/8465 | 9.28e-10 | 2.00e-08 | 1.19e-08 | 63 |
| hsa0513220 | Cervix | CC | Salmonella infection | 74/1267 | 249/8465 | 1.33e-09 | 2.54e-08 | 1.50e-08 | 74 |
| hsa0541720 | Cervix | CC | Lipid and atherosclerosis | 65/1267 | 215/8465 | 6.47e-09 | 1.10e-07 | 6.52e-08 | 65 |
| hsa0516720 | Cervix | CC | Kaposi sarcoma-associated herpesvirus infection | 60/1267 | 194/8465 | 9.74e-09 | 1.58e-07 | 9.33e-08 | 60 |
| hsa0414120 | Cervix | CC | Protein processing in endoplasmic reticulum | 55/1267 | 174/8465 | 1.74e-08 | 2.68e-07 | 1.58e-07 | 55 |
| hsa0513120 | Cervix | CC | Shigellosis | 69/1267 | 247/8465 | 7.64e-08 | 1.03e-06 | 6.10e-07 | 69 |
| hsa0451010 | Cervix | CC | Focal adhesion | 59/1267 | 203/8465 | 1.53e-07 | 1.84e-06 | 1.09e-06 | 59 |
| hsa0516920 | Cervix | CC | Epstein-Barr virus infection | 57/1267 | 202/8465 | 7.30e-07 | 7.39e-06 | 4.37e-06 | 57 |
| hsa0516620 | Cervix | CC | Human T-cell leukemia virus 1 infection | 61/1267 | 222/8465 | 8.13e-07 | 7.98e-06 | 4.72e-06 | 61 |
| hsa0453020 | Cervix | CC | Tight junction | 49/1267 | 169/8465 | 1.87e-06 | 1.78e-05 | 1.05e-05 | 49 |
| Page: 1 2 3 4 5 6 7 8 9 10 11 12 13 14 15 16 17 18 19 20 21 22 23 24 25 26 27 28 29 30 31 32 33 34 35 36 37 38 39 40 41 42 43 44 45 46 47 48 49 50 51 52 53 54 55 56 57 58 59 60 61 62 63 64 65 66 67 68 69 70 71 72 73 74 75 76 77 78 79 80 |
Top |
Cell-cell communication analysis |
| Identification of potential cell-cell interactions between two cell types and their ligand-receptor pairs for different disease states |
| Ligand | Receptor | LRpair | Pathway | Tissue | Disease Stage |
| Page: 1 |
Top |
Single-cell gene regulatory network inference analysis |
| Find out the significant the regulons (TFs) and the target genes of each regulon across cell types for different disease states |
| TF | Cell Type | Tissue | Disease Stage | Target Gene | RSS | Regulon Activity |
| ∗The dot plots of a searched regulon are shown for all cell subpopulations in each disease state of each tissue based on the regulon specific score inferred using pySCENIC and by calculating the average expression. |
| Page: 1 |
Top |
Somatic mutation of malignant transformation related genes |
| Annotation of somatic variants for genes involved in malignant transformation |
| Hugo Symbol | Variant Class | Variant Classification | dbSNP RS | HGVSc | HGVSp | HGVSp Short | SWISSPROT | BIOTYPE | SIFT | PolyPhen | Tumor Sample Barcode | Tissue | Histology | Sex | Age | Stage | Therapy Types | Drugs | Outcome |
| MAPK8 | SNV | Missense_Mutation | c.781N>A | p.Glu261Lys | p.E261K | P45983 | protein_coding | tolerated(0.28) | possibly_damaging(0.494) | TCGA-A2-A04W-01 | Breast | breast invasive carcinoma | Female | <65 | I/II | Chemotherapy | cytoxan | SD | |
| MAPK8 | SNV | Missense_Mutation | c.533N>T | p.Thr178Met | p.T178M | P45983 | protein_coding | deleterious(0.01) | possibly_damaging(0.838) | TCGA-C5-A2LX-01 | Cervix | cervical & endocervical cancer | Female | <65 | I/II | Chemotherapy | cisplatin | SD | |
| MAPK8 | SNV | Missense_Mutation | novel | c.1083N>T | p.Met361Ile | p.M361I | P45983 | protein_coding | tolerated(0.29) | benign(0) | TCGA-C5-A8ZZ-01 | Cervix | cervical & endocervical cancer | Female | <65 | I/II | Unspecific | Cisplatin | SD |
| MAPK8 | SNV | Missense_Mutation | novel | c.1079N>G | p.Val360Gly | p.V360G | P45983 | protein_coding | deleterious(0) | probably_damaging(0.999) | TCGA-FU-A3HZ-01 | Cervix | cervical & endocervical cancer | Female | <65 | I/II | Chemotherapy | cisplatin | CR |
| MAPK8 | SNV | Missense_Mutation | novel | c.691A>G | p.Ile231Val | p.I231V | P45983 | protein_coding | tolerated(0.07) | benign(0.122) | TCGA-AA-3877-01 | Colorectum | colon adenocarcinoma | Female | >=65 | I/II | Unknown | Unknown | SD |
| MAPK8 | SNV | Missense_Mutation | novel | c.239N>G | p.Val80Gly | p.V80G | P45983 | protein_coding | deleterious(0) | probably_damaging(0.99) | TCGA-AA-3984-01 | Colorectum | colon adenocarcinoma | Female | <65 | I/II | Unknown | Unknown | SD |
| MAPK8 | SNV | Missense_Mutation | novel | c.972N>C | p.Trp324Cys | p.W324C | P45983 | protein_coding | deleterious(0.01) | probably_damaging(0.998) | TCGA-AD-6965-01 | Colorectum | colon adenocarcinoma | Male | <65 | III/IV | Chemotherapy | oxaliplatin | PD |
| MAPK8 | SNV | Missense_Mutation | c.112G>C | p.Gly38Arg | p.G38R | P45983 | protein_coding | deleterious(0) | probably_damaging(1) | TCGA-AU-3779-01 | Colorectum | colon adenocarcinoma | Female | >=65 | I/II | Unknown | Unknown | SD | |
| MAPK8 | SNV | Missense_Mutation | c.778N>A | p.Val260Ile | p.V260I | P45983 | protein_coding | tolerated(0.64) | benign(0.046) | TCGA-AZ-6601-01 | Colorectum | colon adenocarcinoma | Male | >=65 | I/II | Unknown | Unknown | PD | |
| MAPK8 | SNV | Missense_Mutation | rs200350498 | c.124G>A | p.Ala42Thr | p.A42T | P45983 | protein_coding | deleterious(0) | probably_damaging(0.948) | TCGA-CM-4743-01 | Colorectum | colon adenocarcinoma | Male | >=65 | I/II | Chemotherapy | capecitabine | SD |
| Page: 1 2 3 4 5 6 |
Top |
Related drugs of malignant transformation related genes |
| Identification of chemicals and drugs interact with genes involved in malignant transfromation |
| (DGIdb 4.0) |
| Entrez ID | Symbol | Category | Interaction Types | Drug Claim Name | Drug Name | PMIDs |
| 5599 | MAPK8 | DRUGGABLE GENOME, SERINE THREONINE KINASE, KINASE, ENZYME, TRANSCRIPTION FACTOR | JNJ-7706621 | JNJ-7706621 | ||
| 5599 | MAPK8 | DRUGGABLE GENOME, SERINE THREONINE KINASE, KINASE, ENZYME, TRANSCRIPTION FACTOR | OXYTOCIN | OXYTOCIN | 11566737 | |
| 5599 | MAPK8 | DRUGGABLE GENOME, SERINE THREONINE KINASE, KINASE, ENZYME, TRANSCRIPTION FACTOR | CYC-116 | CYC-116 | ||
| 5599 | MAPK8 | DRUGGABLE GENOME, SERINE THREONINE KINASE, KINASE, ENZYME, TRANSCRIPTION FACTOR | CI-1040 | CI-1040 | ||
| 5599 | MAPK8 | DRUGGABLE GENOME, SERINE THREONINE KINASE, KINASE, ENZYME, TRANSCRIPTION FACTOR | inhibitor | CHEMBL1950289 | TANZISERTIB | |
| 5599 | MAPK8 | DRUGGABLE GENOME, SERINE THREONINE KINASE, KINASE, ENZYME, TRANSCRIPTION FACTOR | CENISERTIB | CENISERTIB | ||
| 5599 | MAPK8 | DRUGGABLE GENOME, SERINE THREONINE KINASE, KINASE, ENZYME, TRANSCRIPTION FACTOR | sorafenib | SORAFENIB | 20124951 | |
| 5599 | MAPK8 | DRUGGABLE GENOME, SERINE THREONINE KINASE, KINASE, ENZYME, TRANSCRIPTION FACTOR | inhibitor | 249565738 | ||
| 5599 | MAPK8 | DRUGGABLE GENOME, SERINE THREONINE KINASE, KINASE, ENZYME, TRANSCRIPTION FACTOR | inhibitor | 374883876 | ||
| 5599 | MAPK8 | DRUGGABLE GENOME, SERINE THREONINE KINASE, KINASE, ENZYME, TRANSCRIPTION FACTOR | KEYHOLE LIMPET HEMOCYANIN | 15857404 |
| Page: 1 2 3 4 5 6 7 8 9 10 11 12 |

Copyright 2023-Present -The University of Texas Health Science Center at Houston |