
|
|||||
|
 | |
| |
| |
| |
| |
| |
|
Gene: MAPK6 |
Gene summary for MAPK6 |
| Gene information | Species | Human | Gene symbol | MAPK6 | Gene ID | 5597 |
| Gene name | mitogen-activated protein kinase 6 | |
| Gene Alias | ERK3 | |
| Cytomap | 15q21.2 | |
| Gene Type | protein-coding | GO ID | GO:0000165 | UniProtAcc | Q16659 |
Top |
Malignant transformation analysis |
| Identification of the aberrant gene expression in precancerous and cancerous lesions by comparing the gene expression of stem-like cells in diseased tissues with normal stem cells |
| Entrez ID | Symbol | Replicates | Species | Organ | Tissue | Adj P-value | Log2FC | Malignancy |
| 5597 | MAPK6 | LZE2T | Human | Esophagus | ESCC | 2.25e-02 | 2.88e-01 | 0.082 |
| 5597 | MAPK6 | LZE4T | Human | Esophagus | ESCC | 7.85e-13 | 5.35e-01 | 0.0811 |
| 5597 | MAPK6 | LZE8T | Human | Esophagus | ESCC | 1.19e-04 | 3.18e-02 | 0.067 |
| 5597 | MAPK6 | LZE22D1 | Human | Esophagus | HGIN | 3.16e-03 | -3.99e-03 | 0.0595 |
| 5597 | MAPK6 | LZE24T | Human | Esophagus | ESCC | 1.68e-07 | 8.59e-02 | 0.0596 |
| 5597 | MAPK6 | LZE21T | Human | Esophagus | ESCC | 1.46e-04 | 8.51e-02 | 0.0655 |
| 5597 | MAPK6 | P2T-E | Human | Esophagus | ESCC | 4.06e-09 | 3.05e-02 | 0.1177 |
| 5597 | MAPK6 | P4T-E | Human | Esophagus | ESCC | 1.08e-18 | 5.82e-01 | 0.1323 |
| 5597 | MAPK6 | P5T-E | Human | Esophagus | ESCC | 5.42e-17 | 3.10e-01 | 0.1327 |
| 5597 | MAPK6 | P8T-E | Human | Esophagus | ESCC | 1.13e-21 | 4.33e-01 | 0.0889 |
| 5597 | MAPK6 | P9T-E | Human | Esophagus | ESCC | 6.97e-18 | 5.19e-01 | 0.1131 |
| 5597 | MAPK6 | P10T-E | Human | Esophagus | ESCC | 1.02e-21 | 4.86e-01 | 0.116 |
| 5597 | MAPK6 | P11T-E | Human | Esophagus | ESCC | 5.98e-08 | 3.20e-01 | 0.1426 |
| 5597 | MAPK6 | P12T-E | Human | Esophagus | ESCC | 1.72e-13 | 3.25e-01 | 0.1122 |
| 5597 | MAPK6 | P15T-E | Human | Esophagus | ESCC | 5.04e-13 | 4.80e-01 | 0.1149 |
| 5597 | MAPK6 | P16T-E | Human | Esophagus | ESCC | 2.81e-18 | 5.05e-02 | 0.1153 |
| 5597 | MAPK6 | P17T-E | Human | Esophagus | ESCC | 2.37e-04 | 3.69e-02 | 0.1278 |
| 5597 | MAPK6 | P19T-E | Human | Esophagus | ESCC | 2.63e-02 | 7.84e-01 | 0.1662 |
| 5597 | MAPK6 | P20T-E | Human | Esophagus | ESCC | 8.49e-12 | 2.94e-01 | 0.1124 |
| 5597 | MAPK6 | P21T-E | Human | Esophagus | ESCC | 4.85e-23 | 3.73e-01 | 0.1617 |
| Page: 1 2 3 4 5 6 |
| Tissue | Expression Dynamics | Abbreviation |
| Esophagus | 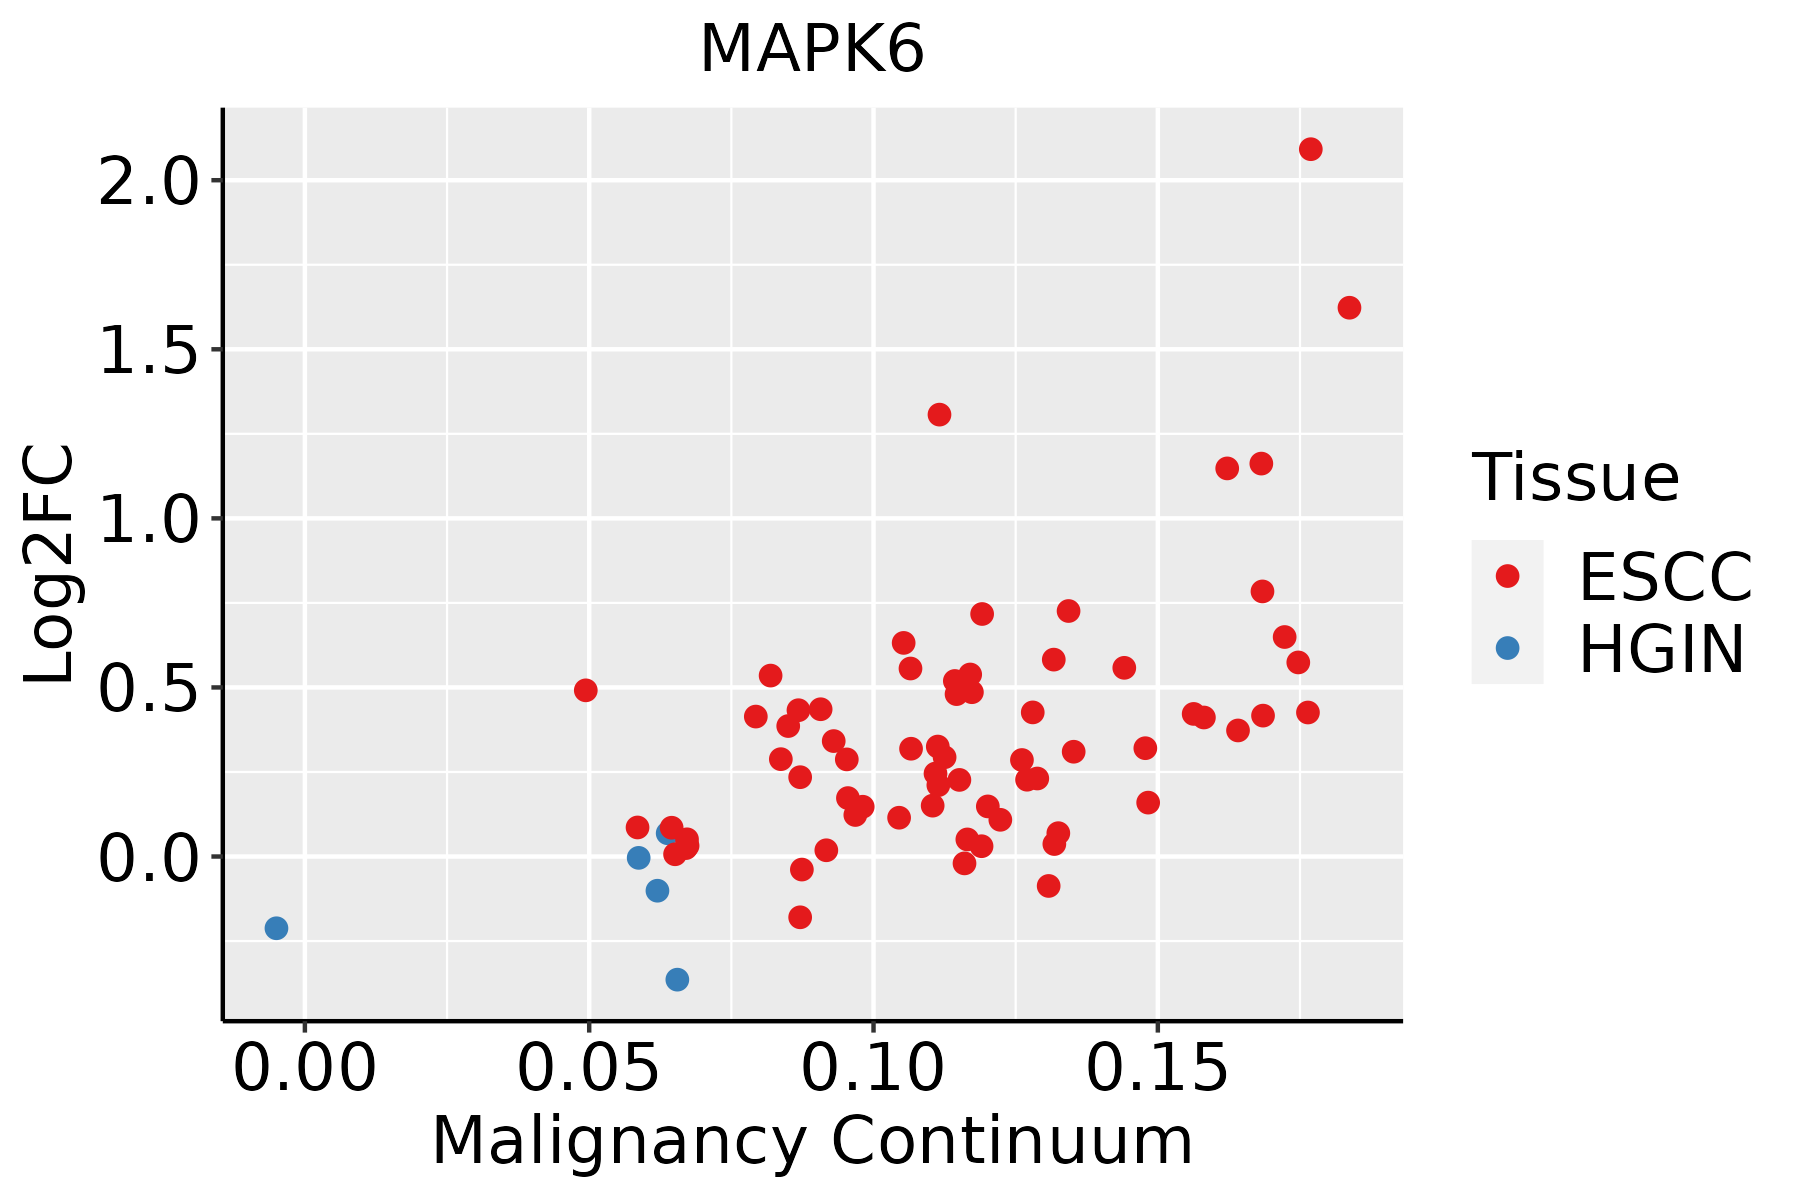 | ESCC: Esophageal squamous cell carcinoma |
| HGIN: High-grade intraepithelial neoplasias | ||
| LGIN: Low-grade intraepithelial neoplasias | ||
| Liver |  | HCC: Hepatocellular carcinoma |
| NAFLD: Non-alcoholic fatty liver disease | ||
| Oral Cavity |  | EOLP: Erosive Oral lichen planus |
| LP: leukoplakia | ||
| NEOLP: Non-erosive oral lichen planus | ||
| OSCC: Oral squamous cell carcinoma | ||
| Skin |  | AK: Actinic keratosis |
| cSCC: Cutaneous squamous cell carcinoma | ||
| SCCIS:squamous cell carcinoma in situ | ||
| Thyroid |  | ATC: Anaplastic thyroid cancer |
| HT: Hashimoto's thyroiditis | ||
| PTC: Papillary thyroid cancer |
| ∗log2FC in expression of this searched gene in stem-like cells from each diseased tissue sample relative to stem-like cells in normal samples in each tissue plotted against the malignancy continuum. Samples are colored based on if they are from different disease stage. |
Top |
Malignant transformation related pathway analysis |
| Find out the enriched GO biological processes and KEGG pathways involved in transition from healthy to precancer to cancer |
| Tissue | Disease Stage | Enriched GO biological Processes |
| Colorectum | AD |  |
| Colorectum | SER |  |
| Colorectum | MSS |  |
| Colorectum | MSI-H |  |
| Colorectum | FAP |  |
| ∗Top 15 enriched GO BP terms are showed in the bar plot of each disease state in each tissue. Each row represents a significant GO biological process which is colored according to the -log10(p.adjust). |
| Page: 1 2 3 4 5 6 7 8 9 |
| GO ID | Tissue | Disease Stage | Description | Gene Ratio | Bg Ratio | pvalue | p.adjust | Count |
| GO:001635816 | Esophagus | ESCC | dendrite development | 130/8552 | 243/18723 | 8.33e-03 | 2.95e-02 | 130 |
| GO:00163585 | Liver | NAFLD | dendrite development | 43/1882 | 243/18723 | 1.70e-04 | 3.07e-03 | 43 |
| GO:00609963 | Liver | NAFLD | dendritic spine development | 21/1882 | 99/18723 | 7.26e-04 | 9.27e-03 | 21 |
| GO:00609982 | Liver | NAFLD | regulation of dendritic spine development | 13/1882 | 61/18723 | 6.77e-03 | 4.79e-02 | 13 |
| GO:0060999 | Liver | HCC | positive regulation of dendritic spine development | 27/7958 | 42/18723 | 3.60e-03 | 1.60e-02 | 27 |
| GO:006099611 | Liver | HCC | dendritic spine development | 54/7958 | 99/18723 | 1.03e-02 | 3.86e-02 | 54 |
| GO:001635811 | Liver | HCC | dendrite development | 121/7958 | 243/18723 | 1.26e-02 | 4.56e-02 | 121 |
| GO:00609981 | Liver | HCC | regulation of dendritic spine development | 35/7958 | 61/18723 | 1.35e-02 | 4.82e-02 | 35 |
| GO:001635810 | Oral cavity | OSCC | dendrite development | 113/7305 | 243/18723 | 1.00e-02 | 3.49e-02 | 113 |
| GO:00609967 | Oral cavity | OSCC | dendritic spine development | 50/7305 | 99/18723 | 1.31e-02 | 4.34e-02 | 50 |
| GO:001635815 | Oral cavity | EOLP | dendrite development | 55/2218 | 243/18723 | 1.43e-06 | 3.42e-05 | 55 |
| GO:006099614 | Oral cavity | EOLP | dendritic spine development | 27/2218 | 99/18723 | 2.21e-05 | 3.37e-04 | 27 |
| GO:00609986 | Oral cavity | EOLP | regulation of dendritic spine development | 18/2218 | 61/18723 | 1.69e-04 | 1.78e-03 | 18 |
| GO:00609993 | Oral cavity | EOLP | positive regulation of dendritic spine development | 13/2218 | 42/18723 | 8.03e-04 | 6.31e-03 | 13 |
| GO:001635822 | Oral cavity | NEOLP | dendrite development | 55/2005 | 243/18723 | 5.38e-08 | 2.16e-06 | 55 |
| GO:006099621 | Oral cavity | NEOLP | dendritic spine development | 23/2005 | 99/18723 | 2.57e-04 | 2.62e-03 | 23 |
| GO:006099813 | Oral cavity | NEOLP | regulation of dendritic spine development | 14/2005 | 61/18723 | 4.41e-03 | 2.48e-02 | 14 |
| GO:00609968 | Skin | AK | dendritic spine development | 27/1910 | 99/18723 | 1.34e-06 | 4.15e-05 | 27 |
| GO:001635817 | Skin | AK | dendrite development | 49/1910 | 243/18723 | 2.42e-06 | 6.72e-05 | 49 |
| GO:00609987 | Skin | AK | regulation of dendritic spine development | 16/1910 | 61/18723 | 3.03e-04 | 3.12e-03 | 16 |
| Page: 1 2 |
| Pathway ID | Tissue | Disease Stage | Description | Gene Ratio | Bg Ratio | pvalue | p.adjust | qvalue | Count |
| hsa0465726 | Esophagus | HGIN | IL-17 signaling pathway | 25/1383 | 94/8465 | 7.52e-03 | 4.63e-02 | 3.68e-02 | 25 |
| hsa04657113 | Esophagus | HGIN | IL-17 signaling pathway | 25/1383 | 94/8465 | 7.52e-03 | 4.63e-02 | 3.68e-02 | 25 |
| hsa0465727 | Esophagus | ESCC | IL-17 signaling pathway | 66/4205 | 94/8465 | 3.93e-05 | 1.75e-04 | 8.99e-05 | 66 |
| hsa0465734 | Esophagus | ESCC | IL-17 signaling pathway | 66/4205 | 94/8465 | 3.93e-05 | 1.75e-04 | 8.99e-05 | 66 |
| hsa0465724 | Oral cavity | OSCC | IL-17 signaling pathway | 64/3704 | 94/8465 | 1.48e-06 | 7.87e-06 | 4.01e-06 | 64 |
| hsa04657112 | Oral cavity | OSCC | IL-17 signaling pathway | 64/3704 | 94/8465 | 1.48e-06 | 7.87e-06 | 4.01e-06 | 64 |
| hsa0465725 | Oral cavity | LP | IL-17 signaling pathway | 47/2418 | 94/8465 | 8.45e-06 | 6.25e-05 | 4.03e-05 | 47 |
| hsa0465733 | Oral cavity | LP | IL-17 signaling pathway | 47/2418 | 94/8465 | 8.45e-06 | 6.25e-05 | 4.03e-05 | 47 |
| hsa0465743 | Oral cavity | EOLP | IL-17 signaling pathway | 24/1218 | 94/8465 | 2.98e-03 | 9.61e-03 | 5.67e-03 | 24 |
| hsa0465753 | Oral cavity | EOLP | IL-17 signaling pathway | 24/1218 | 94/8465 | 2.98e-03 | 9.61e-03 | 5.67e-03 | 24 |
| hsa0465761 | Oral cavity | NEOLP | IL-17 signaling pathway | 22/1112 | 94/8465 | 4.40e-03 | 1.75e-02 | 1.10e-02 | 22 |
| hsa0465771 | Oral cavity | NEOLP | IL-17 signaling pathway | 22/1112 | 94/8465 | 4.40e-03 | 1.75e-02 | 1.10e-02 | 22 |
| Page: 1 |
Top |
Cell-cell communication analysis |
| Identification of potential cell-cell interactions between two cell types and their ligand-receptor pairs for different disease states |
| Ligand | Receptor | LRpair | Pathway | Tissue | Disease Stage |
| Page: 1 |
Top |
Single-cell gene regulatory network inference analysis |
| Find out the significant the regulons (TFs) and the target genes of each regulon across cell types for different disease states |
| TF | Cell Type | Tissue | Disease Stage | Target Gene | RSS | Regulon Activity |
| ∗The dot plots of a searched regulon are shown for all cell subpopulations in each disease state of each tissue based on the regulon specific score inferred using pySCENIC and by calculating the average expression. |
| Page: 1 |
Top |
Somatic mutation of malignant transformation related genes |
| Annotation of somatic variants for genes involved in malignant transformation |
| Hugo Symbol | Variant Class | Variant Classification | dbSNP RS | HGVSc | HGVSp | HGVSp Short | SWISSPROT | BIOTYPE | SIFT | PolyPhen | Tumor Sample Barcode | Tissue | Histology | Sex | Age | Stage | Therapy Types | Drugs | Outcome |
| MAPK6 | SNV | Missense_Mutation | c.147N>C | p.Lys49Asn | p.K49N | Q16659 | protein_coding | deleterious(0) | probably_damaging(0.998) | TCGA-A2-A0D2-01 | Breast | breast invasive carcinoma | Female | <65 | I/II | Chemotherapy | adriamycin | SD | |
| MAPK6 | SNV | Missense_Mutation | c.784N>C | p.Val262Leu | p.V262L | Q16659 | protein_coding | deleterious(0.05) | probably_damaging(0.956) | TCGA-BH-A202-01 | Breast | breast invasive carcinoma | Female | <65 | I/II | Chemotherapy | carboplatin | CR | |
| MAPK6 | SNV | Missense_Mutation | novel | c.2158N>G | p.Leu720Val | p.L720V | Q16659 | protein_coding | deleterious_low_confidence(0.01) | probably_damaging(0.952) | TCGA-BH-A28O-01 | Breast | breast invasive carcinoma | Female | <65 | III/IV | Chemotherapy | cytoxan | CR |
| MAPK6 | SNV | Missense_Mutation | c.1159G>T | p.Asp387Tyr | p.D387Y | Q16659 | protein_coding | deleterious(0) | probably_damaging(0.997) | TCGA-D8-A1XY-01 | Breast | breast invasive carcinoma | Female | >=65 | I/II | Chemotherapy | tamoxiphen | SD | |
| MAPK6 | SNV | Missense_Mutation | novel | c.1460C>T | p.Ser487Phe | p.S487F | Q16659 | protein_coding | tolerated_low_confidence(0.24) | benign(0) | TCGA-DS-A5RQ-01 | Cervix | cervical & endocervical cancer | Female | >=65 | I/II | Chemotherapy | cisplatin | CR |
| MAPK6 | SNV | Missense_Mutation | novel | c.2099C>G | p.Ser700Cys | p.S700C | Q16659 | protein_coding | tolerated_low_confidence(0.33) | benign(0.001) | TCGA-HM-A4S6-01 | Cervix | cervical & endocervical cancer | Female | <65 | III/IV | Chemotherapy | cisplatin | CR |
| MAPK6 | SNV | Missense_Mutation | c.140N>T | p.Ala47Val | p.A47V | Q16659 | protein_coding | deleterious(0) | probably_damaging(0.994) | TCGA-A6-5661-01 | Colorectum | colon adenocarcinoma | Female | >=65 | I/II | Unknown | Unknown | SD | |
| MAPK6 | SNV | Missense_Mutation | c.7G>A | p.Glu3Lys | p.E3K | Q16659 | protein_coding | deleterious(0.01) | probably_damaging(0.971) | TCGA-A6-6648-01 | Colorectum | colon adenocarcinoma | Male | <65 | I/II | Chemotherapy | oxaliplatin | PD | |
| MAPK6 | SNV | Missense_Mutation | novel | c.100G>T | p.Val34Phe | p.V34F | Q16659 | protein_coding | deleterious(0) | probably_damaging(0.996) | TCGA-AA-3510-01 | Colorectum | colon adenocarcinoma | Male | >=65 | I/II | Unknown | Unknown | SD |
| MAPK6 | SNV | Missense_Mutation | c.533T>C | p.Met178Thr | p.M178T | Q16659 | protein_coding | tolerated(0.3) | possibly_damaging(0.652) | TCGA-AA-3672-01 | Colorectum | colon adenocarcinoma | Female | >=65 | III/IV | Unknown | Unknown | SD |
| Page: 1 2 3 4 5 6 7 |
Top |
Related drugs of malignant transformation related genes |
| Identification of chemicals and drugs interact with genes involved in malignant transfromation |
| (DGIdb 4.0) |
| Entrez ID | Symbol | Category | Interaction Types | Drug Claim Name | Drug Name | PMIDs |
| 5597 | MAPK6 | KINASE, DRUGGABLE GENOME, ENZYME, SERINE THREONINE KINASE | sorafenib | SORAFENIB | 20124951 |
| Page: 1 |

Copyright 2023-Present -The University of Texas Health Science Center at Houston |