| Tissue | Expression Dynamics | Abbreviation |
| Colorectum (GSE201348) |  | FAP: Familial adenomatous polyposis |
| CRC: Colorectal cancer |
| Colorectum (HTA11) |  | AD: Adenomas |
| SER: Sessile serrated lesions |
| MSI-H: Microsatellite-high colorectal cancer |
| MSS: Microsatellite stable colorectal cancer |
| Esophagus | 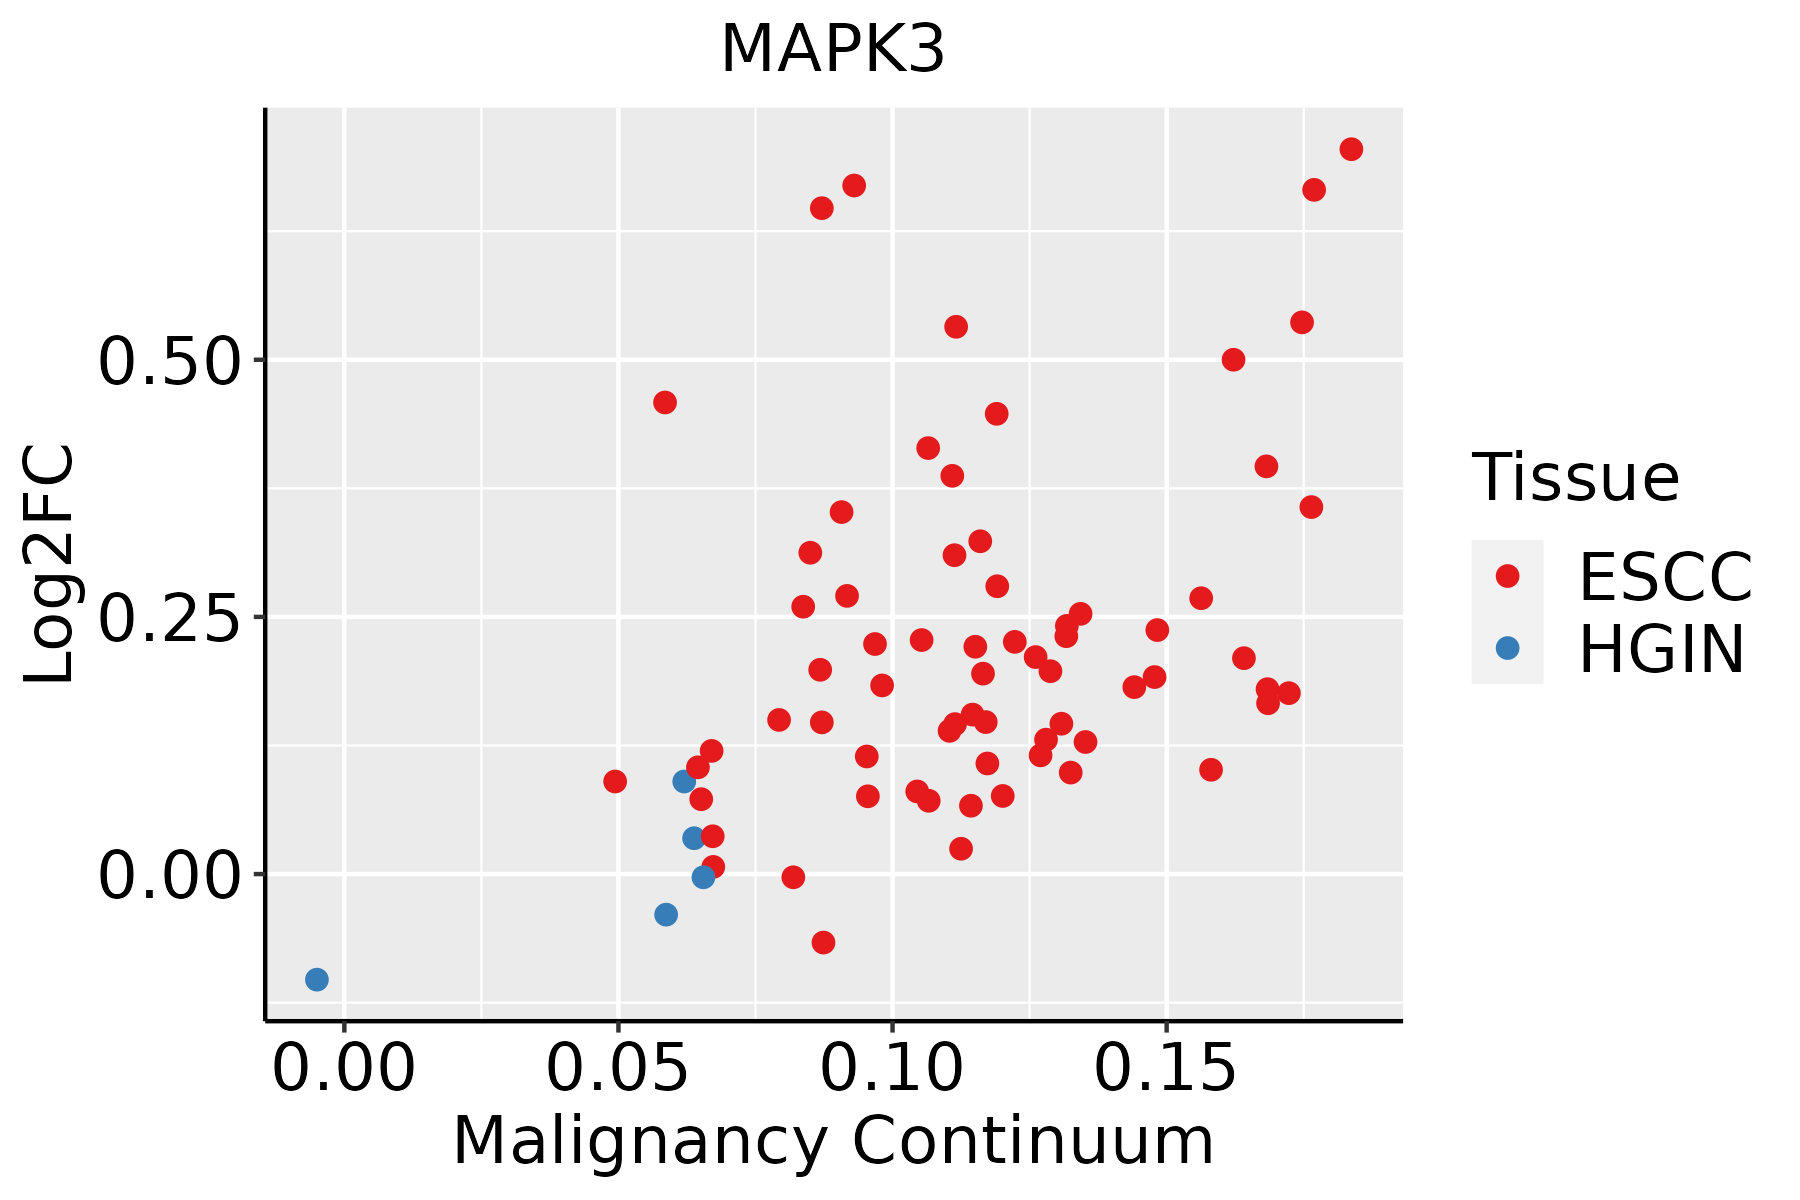 | ESCC: Esophageal squamous cell carcinoma |
| HGIN: High-grade intraepithelial neoplasias |
| LGIN: Low-grade intraepithelial neoplasias |
| GC | 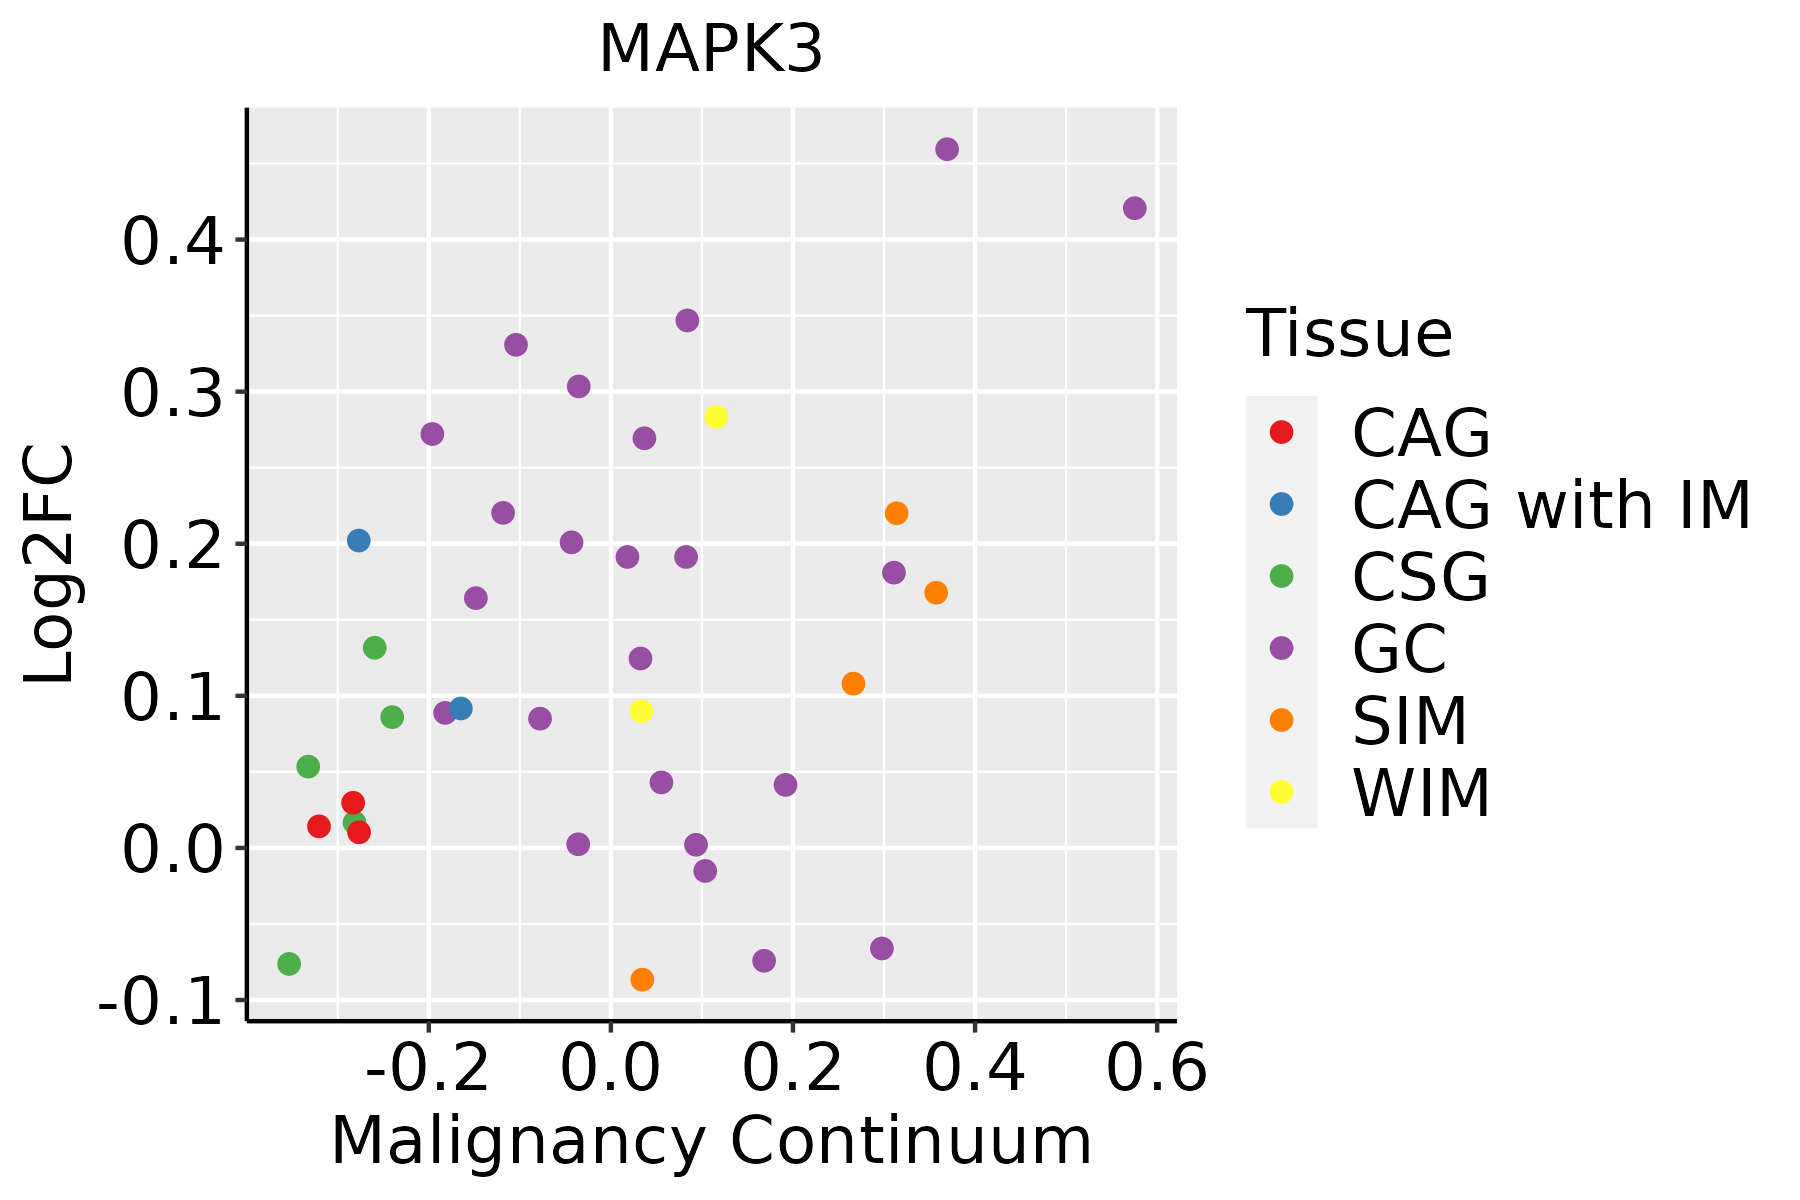 | CAG: Chronic atrophic gastritis |
| CAG with IM: Chronic atrophic gastritis with intestinal metaplasia |
| CSG: Chronic superficial gastritis |
| GC: Gastric cancer |
| SIM: Severe intestinal metaplasia |
| WIM: Wild intestinal metaplasia |
| Liver | 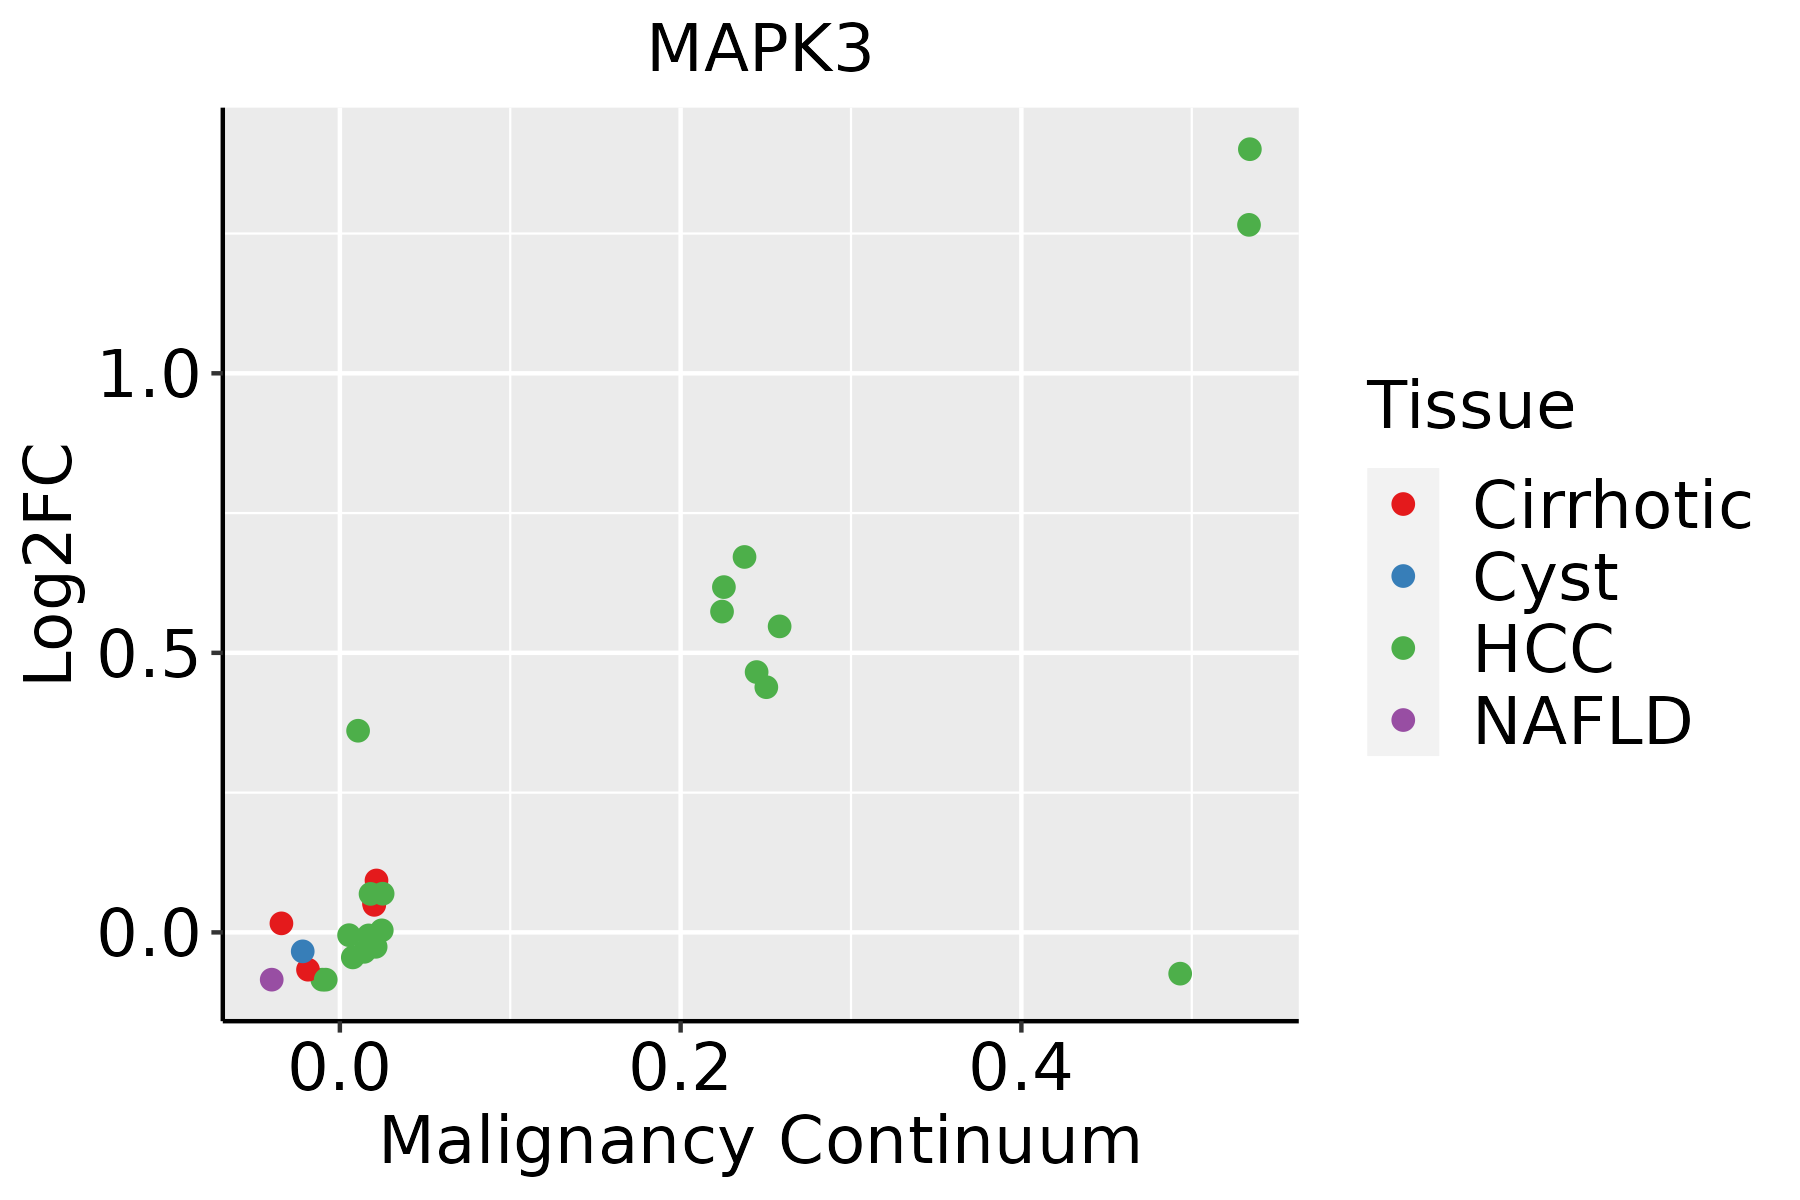 | HCC: Hepatocellular carcinoma |
| NAFLD: Non-alcoholic fatty liver disease |
| Oral Cavity |  | EOLP: Erosive Oral lichen planus |
| LP: leukoplakia |
| NEOLP: Non-erosive oral lichen planus |
| OSCC: Oral squamous cell carcinoma |
| Thyroid |  | ATC: Anaplastic thyroid cancer |
| HT: Hashimoto's thyroiditis |
| PTC: Papillary thyroid cancer |
| GO ID | Tissue | Disease Stage | Description | Gene Ratio | Bg Ratio | pvalue | p.adjust | Count |
| GO:0009896 | Colorectum | AD | positive regulation of catabolic process | 180/3918 | 492/18723 | 4.33e-16 | 1.94e-13 | 180 |
| GO:0031331 | Colorectum | AD | positive regulation of cellular catabolic process | 156/3918 | 427/18723 | 4.68e-14 | 1.05e-11 | 156 |
| GO:0048732 | Colorectum | AD | gland development | 149/3918 | 436/18723 | 6.07e-11 | 6.33e-09 | 149 |
| GO:0051098 | Colorectum | AD | regulation of binding | 126/3918 | 363/18723 | 6.01e-10 | 4.88e-08 | 126 |
| GO:0010506 | Colorectum | AD | regulation of autophagy | 111/3918 | 317/18723 | 3.57e-09 | 2.35e-07 | 111 |
| GO:0006979 | Colorectum | AD | response to oxidative stress | 145/3918 | 446/18723 | 5.16e-09 | 3.23e-07 | 145 |
| GO:0016482 | Colorectum | AD | cytosolic transport | 68/3918 | 168/18723 | 6.00e-09 | 3.72e-07 | 68 |
| GO:0016236 | Colorectum | AD | macroautophagy | 103/3918 | 291/18723 | 6.76e-09 | 4.15e-07 | 103 |
| GO:0051052 | Colorectum | AD | regulation of DNA metabolic process | 116/3918 | 359/18723 | 2.47e-07 | 1.00e-05 | 116 |
| GO:0051054 | Colorectum | AD | positive regulation of DNA metabolic process | 73/3918 | 201/18723 | 3.27e-07 | 1.29e-05 | 73 |
| GO:0032386 | Colorectum | AD | regulation of intracellular transport | 109/3918 | 337/18723 | 5.33e-07 | 1.95e-05 | 109 |
| GO:0062197 | Colorectum | AD | cellular response to chemical stress | 109/3918 | 337/18723 | 5.33e-07 | 1.95e-05 | 109 |
| GO:0000302 | Colorectum | AD | response to reactive oxygen species | 78/3918 | 222/18723 | 6.17e-07 | 2.21e-05 | 78 |
| GO:0009636 | Colorectum | AD | response to toxic substance | 88/3918 | 262/18723 | 1.12e-06 | 3.72e-05 | 88 |
| GO:0006417 | Colorectum | AD | regulation of translation | 141/3918 | 468/18723 | 1.32e-06 | 4.22e-05 | 141 |
| GO:0034599 | Colorectum | AD | cellular response to oxidative stress | 94/3918 | 288/18723 | 2.03e-06 | 6.02e-05 | 94 |
| GO:0043393 | Colorectum | AD | regulation of protein binding | 68/3918 | 196/18723 | 5.17e-06 | 1.34e-04 | 68 |
| GO:2001252 | Colorectum | AD | positive regulation of chromosome organization | 35/3918 | 82/18723 | 6.90e-06 | 1.72e-04 | 35 |
| GO:0031667 | Colorectum | AD | response to nutrient levels | 138/3918 | 474/18723 | 1.22e-05 | 2.68e-04 | 138 |
| GO:2000278 | Colorectum | AD | regulation of DNA biosynthetic process | 41/3918 | 106/18723 | 2.17e-05 | 4.33e-04 | 41 |
| Pathway ID | Tissue | Disease Stage | Description | Gene Ratio | Bg Ratio | pvalue | p.adjust | qvalue | Count |
| hsa05208 | Colorectum | AD | Chemical carcinogenesis - reactive oxygen species | 126/2092 | 223/8465 | 1.01e-24 | 1.68e-22 | 1.07e-22 | 126 |
| hsa05010 | Colorectum | AD | Alzheimer disease | 174/2092 | 384/8465 | 1.82e-19 | 9.26e-18 | 5.91e-18 | 174 |
| hsa05020 | Colorectum | AD | Prion disease | 133/2092 | 273/8465 | 2.47e-18 | 8.29e-17 | 5.29e-17 | 133 |
| hsa05022 | Colorectum | AD | Pathways of neurodegeneration - multiple diseases | 201/2092 | 476/8465 | 4.54e-18 | 1.27e-16 | 8.09e-17 | 201 |
| hsa05171 | Colorectum | AD | Coronavirus disease - COVID-19 | 113/2092 | 232/8465 | 9.90e-16 | 2.55e-14 | 1.63e-14 | 113 |
| hsa05131 | Colorectum | AD | Shigellosis | 109/2092 | 247/8465 | 1.09e-11 | 2.44e-10 | 1.55e-10 | 109 |
| hsa04520 | Colorectum | AD | Adherens junction | 50/2092 | 93/8465 | 1.52e-09 | 2.83e-08 | 1.81e-08 | 50 |
| hsa05132 | Colorectum | AD | Salmonella infection | 102/2092 | 249/8465 | 7.65e-09 | 1.28e-07 | 8.17e-08 | 102 |
| hsa04666 | Colorectum | AD | Fc gamma R-mediated phagocytosis | 46/2092 | 97/8465 | 9.10e-07 | 1.22e-05 | 7.77e-06 | 46 |
| hsa05130 | Colorectum | AD | Pathogenic Escherichia coli infection | 79/2092 | 197/8465 | 1.05e-06 | 1.36e-05 | 8.65e-06 | 79 |
| hsa05135 | Colorectum | AD | Yersinia infection | 58/2092 | 137/8465 | 3.90e-06 | 4.35e-05 | 2.78e-05 | 58 |
| hsa04066 | Colorectum | AD | HIF-1 signaling pathway | 48/2092 | 109/8465 | 7.25e-06 | 7.84e-05 | 5.00e-05 | 48 |
| hsa04919 | Colorectum | AD | Thyroid hormone signaling pathway | 51/2092 | 121/8465 | 1.71e-05 | 1.73e-04 | 1.10e-04 | 51 |
| hsa04722 | Colorectum | AD | Neurotrophin signaling pathway | 50/2092 | 119/8465 | 2.28e-05 | 2.24e-04 | 1.43e-04 | 50 |
| hsa05213 | Colorectum | AD | Endometrial cancer | 29/2092 | 58/8465 | 2.69e-05 | 2.57e-04 | 1.64e-04 | 29 |
| hsa04723 | Colorectum | AD | Retrograde endocannabinoid signaling | 59/2092 | 148/8465 | 2.94e-05 | 2.73e-04 | 1.74e-04 | 59 |
| hsa05216 | Colorectum | AD | Thyroid cancer | 21/2092 | 37/8465 | 3.05e-05 | 2.76e-04 | 1.76e-04 | 21 |
| hsa05230 | Colorectum | AD | Central carbon metabolism in cancer | 33/2092 | 70/8465 | 3.61e-05 | 3.19e-04 | 2.03e-04 | 33 |
| hsa05210 | Colorectum | AD | Colorectal cancer | 35/2092 | 86/8465 | 7.54e-04 | 5.49e-03 | 3.50e-03 | 35 |
| hsa05417 | Colorectum | AD | Lipid and atherosclerosis | 73/2092 | 215/8465 | 1.31e-03 | 8.27e-03 | 5.27e-03 | 73 |
| Hugo Symbol | Variant Class | Variant Classification | dbSNP RS | HGVSc | HGVSp | HGVSp Short | SWISSPROT | BIOTYPE | SIFT | PolyPhen | Tumor Sample Barcode | Tissue | Histology | Sex | Age | Stage | Therapy Types | Drugs | Outcome |
| MAPK3 | SNV | Missense_Mutation | | c.454C>T | p.Arg152Trp | p.R152W | P27361 | protein_coding | deleterious(0) | probably_damaging(1) | TCGA-BH-A0E1-01 | Breast | breast invasive carcinoma | Female | <65 | I/II | Chemotherapy | cytoxan | SD |
| MAPK3 | insertion | Frame_Shift_Ins | novel | c.908_909insACTTTGGGAGGCCGAGGTGGGTG | p.Asp305TrpfsTer15 | p.D305Wfs*15 | P27361 | protein_coding | | | TCGA-A8-A07W-01 | Breast | breast invasive carcinoma | Female | >=65 | III/IV | Hormone Therapy | exemestane | SD |
| MAPK3 | insertion | Frame_Shift_Ins | novel | c.1074_1075insGCTGTGGTGGGAGGACTGCTTGAACCTGGGAGAG | p.Arg359AlafsTer85 | p.R359Afs*85 | P27361 | protein_coding | | | TCGA-AN-A04A-01 | Breast | breast invasive carcinoma | Female | <65 | III/IV | Unknown | Unknown | SD |
| MAPK3 | insertion | Frame_Shift_Ins | novel | c.504_505insGAGGGGCTGCCCACTCCTGAAAGGAACGGAC | p.Pro169GlufsTer23 | p.P169Efs*23 | P27361 | protein_coding | | | TCGA-BH-A0HQ-01 | Breast | breast invasive carcinoma | Female | <65 | I/II | Hormone Therapy | arimidex | SD |
| MAPK3 | SNV | Missense_Mutation | rs774690695 | c.311G>A | p.Arg104Gln | p.R104Q | P27361 | protein_coding | tolerated(0.33) | benign(0.014) | TCGA-2W-A8YY-01 | Cervix | cervical & endocervical cancer | Female | <65 | I/II | Chemotherapy | cisplatin | CR |
| MAPK3 | SNV | Missense_Mutation | novel | c.819N>G | p.Ile273Met | p.I273M | P27361 | protein_coding | tolerated(0.11) | possibly_damaging(0.815) | TCGA-JW-A5VL-01 | Cervix | cervical & endocervical cancer | Female | <65 | I/II | Unknown | Unknown | SD |
| MAPK3 | SNV | Missense_Mutation | | c.869N>C | p.Val290Ala | p.V290A | P27361 | protein_coding | tolerated(0.24) | benign(0.075) | TCGA-AA-A010-01 | Colorectum | colon adenocarcinoma | Female | <65 | I/II | Chemotherapy | folinic | CR |
| MAPK3 | SNV | Missense_Mutation | | c.173N>T | p.Ser58Leu | p.S58L | P27361 | protein_coding | deleterious(0.01) | possibly_damaging(0.78) | TCGA-AA-A01R-01 | Colorectum | colon adenocarcinoma | Male | <65 | III/IV | Chemotherapy | 5-fluorouracil | PD |
| MAPK3 | SNV | Missense_Mutation | | c.251G>A | p.Arg84His | p.R84H | P27361 | protein_coding | deleterious(0.03) | probably_damaging(0.963) | TCGA-AD-5900-01 | Colorectum | colon adenocarcinoma | Male | >=65 | I/II | Unknown | Unknown | SD |
| MAPK3 | SNV | Missense_Mutation | rs764219989 | c.631N>T | p.Arg211Trp | p.R211W | P27361 | protein_coding | deleterious(0) | probably_damaging(1) | TCGA-DM-A1HB-01 | Colorectum | colon adenocarcinoma | Male | >=65 | III/IV | Unknown | Unknown | SD |
| Entrez ID | Symbol | Category | Interaction Types | Drug Claim Name | Drug Name | PMIDs |
| 5595 | MAPK3 | TRANSCRIPTION FACTOR, KINASE, DRUGGABLE GENOME, SERINE THREONINE KINASE, ENZYME | | (+)-ISOBICYCLOGERMACRENAL | CHEMBL2333548 | |
| 5595 | MAPK3 | TRANSCRIPTION FACTOR, KINASE, DRUGGABLE GENOME, SERINE THREONINE KINASE, ENZYME | | ETOPOSIDE | ETOPOSIDE | 23999041 |
| 5595 | MAPK3 | TRANSCRIPTION FACTOR, KINASE, DRUGGABLE GENOME, SERINE THREONINE KINASE, ENZYME | | BENZOTHIAZOL-2-YLAMINE | CHEMBL329785 | 22982122 |
| 5595 | MAPK3 | TRANSCRIPTION FACTOR, KINASE, DRUGGABLE GENOME, SERINE THREONINE KINASE, ENZYME | | YUANHUADINE | YUANHUADINE | 21916433 |
| 5595 | MAPK3 | TRANSCRIPTION FACTOR, KINASE, DRUGGABLE GENOME, SERINE THREONINE KINASE, ENZYME | | CIMIRACEMATE A | CIMIRACEMATE A | 19835377 |
| 5595 | MAPK3 | TRANSCRIPTION FACTOR, KINASE, DRUGGABLE GENOME, SERINE THREONINE KINASE, ENZYME | | SELENIUM | | 14744887 |
| 5595 | MAPK3 | TRANSCRIPTION FACTOR, KINASE, DRUGGABLE GENOME, SERINE THREONINE KINASE, ENZYME | | NSC-753574 | CHEMBL2088730 | 22982122 |
| 5595 | MAPK3 | TRANSCRIPTION FACTOR, KINASE, DRUGGABLE GENOME, SERINE THREONINE KINASE, ENZYME | | PD-153035 | CHEMBL29197 | 17681471 |
| 5595 | MAPK3 | TRANSCRIPTION FACTOR, KINASE, DRUGGABLE GENOME, SERINE THREONINE KINASE, ENZYME | | MADOLIN A | MADOLIN A | |
| 5595 | MAPK3 | TRANSCRIPTION FACTOR, KINASE, DRUGGABLE GENOME, SERINE THREONINE KINASE, ENZYME | | VOLVALERENAL D | VOLVALERENAL D | |


