
|
|||||
|
 | |
| |
| |
| |
| |
| |
|
Gene: MAPK1IP1L |
Gene summary for MAPK1IP1L |
| Gene information | Species | Human | Gene symbol | MAPK1IP1L | Gene ID | 93487 |
| Gene name | mitogen-activated protein kinase 1 interacting protein 1 like | |
| Gene Alias | C14orf32 | |
| Cytomap | 14q22.3 | |
| Gene Type | protein-coding | GO ID | GO:0003674 | UniProtAcc | Q8NDC0 |
Top |
Malignant transformation analysis |
| Identification of the aberrant gene expression in precancerous and cancerous lesions by comparing the gene expression of stem-like cells in diseased tissues with normal stem cells |
| Entrez ID | Symbol | Replicates | Species | Organ | Tissue | Adj P-value | Log2FC | Malignancy |
| 93487 | MAPK1IP1L | LZE3D | Human | Esophagus | HGIN | 2.46e-02 | 3.65e-01 | 0.0668 |
| 93487 | MAPK1IP1L | LZE4T | Human | Esophagus | ESCC | 4.79e-21 | 6.93e-01 | 0.0811 |
| 93487 | MAPK1IP1L | LZE7T | Human | Esophagus | ESCC | 8.07e-04 | 3.49e-01 | 0.0667 |
| 93487 | MAPK1IP1L | LZE8T | Human | Esophagus | ESCC | 1.12e-07 | 3.36e-01 | 0.067 |
| 93487 | MAPK1IP1L | LZE20T | Human | Esophagus | ESCC | 3.36e-03 | 4.07e-01 | 0.0662 |
| 93487 | MAPK1IP1L | LZE22D1 | Human | Esophagus | HGIN | 1.30e-05 | 5.67e-02 | 0.0595 |
| 93487 | MAPK1IP1L | LZE22T | Human | Esophagus | ESCC | 2.23e-03 | 8.65e-01 | 0.068 |
| 93487 | MAPK1IP1L | LZE24T | Human | Esophagus | ESCC | 5.36e-22 | 8.38e-01 | 0.0596 |
| 93487 | MAPK1IP1L | LZE6T | Human | Esophagus | ESCC | 1.68e-05 | 3.93e-01 | 0.0845 |
| 93487 | MAPK1IP1L | P1T-E | Human | Esophagus | ESCC | 1.44e-09 | 5.32e-01 | 0.0875 |
| 93487 | MAPK1IP1L | P2T-E | Human | Esophagus | ESCC | 2.98e-47 | 8.37e-01 | 0.1177 |
| 93487 | MAPK1IP1L | P4T-E | Human | Esophagus | ESCC | 4.89e-34 | 9.36e-01 | 0.1323 |
| 93487 | MAPK1IP1L | P5T-E | Human | Esophagus | ESCC | 1.49e-30 | 7.65e-01 | 0.1327 |
| 93487 | MAPK1IP1L | P8T-E | Human | Esophagus | ESCC | 4.59e-33 | 7.58e-01 | 0.0889 |
| 93487 | MAPK1IP1L | P9T-E | Human | Esophagus | ESCC | 6.05e-22 | 7.62e-01 | 0.1131 |
| 93487 | MAPK1IP1L | P10T-E | Human | Esophagus | ESCC | 2.09e-27 | 5.42e-01 | 0.116 |
| 93487 | MAPK1IP1L | P11T-E | Human | Esophagus | ESCC | 6.54e-17 | 1.21e+00 | 0.1426 |
| 93487 | MAPK1IP1L | P12T-E | Human | Esophagus | ESCC | 1.66e-38 | 9.92e-01 | 0.1122 |
| 93487 | MAPK1IP1L | P15T-E | Human | Esophagus | ESCC | 8.41e-50 | 1.31e+00 | 0.1149 |
| 93487 | MAPK1IP1L | P16T-E | Human | Esophagus | ESCC | 2.68e-21 | 4.77e-01 | 0.1153 |
| Page: 1 2 3 4 5 6 |
| Tissue | Expression Dynamics | Abbreviation |
| Esophagus | 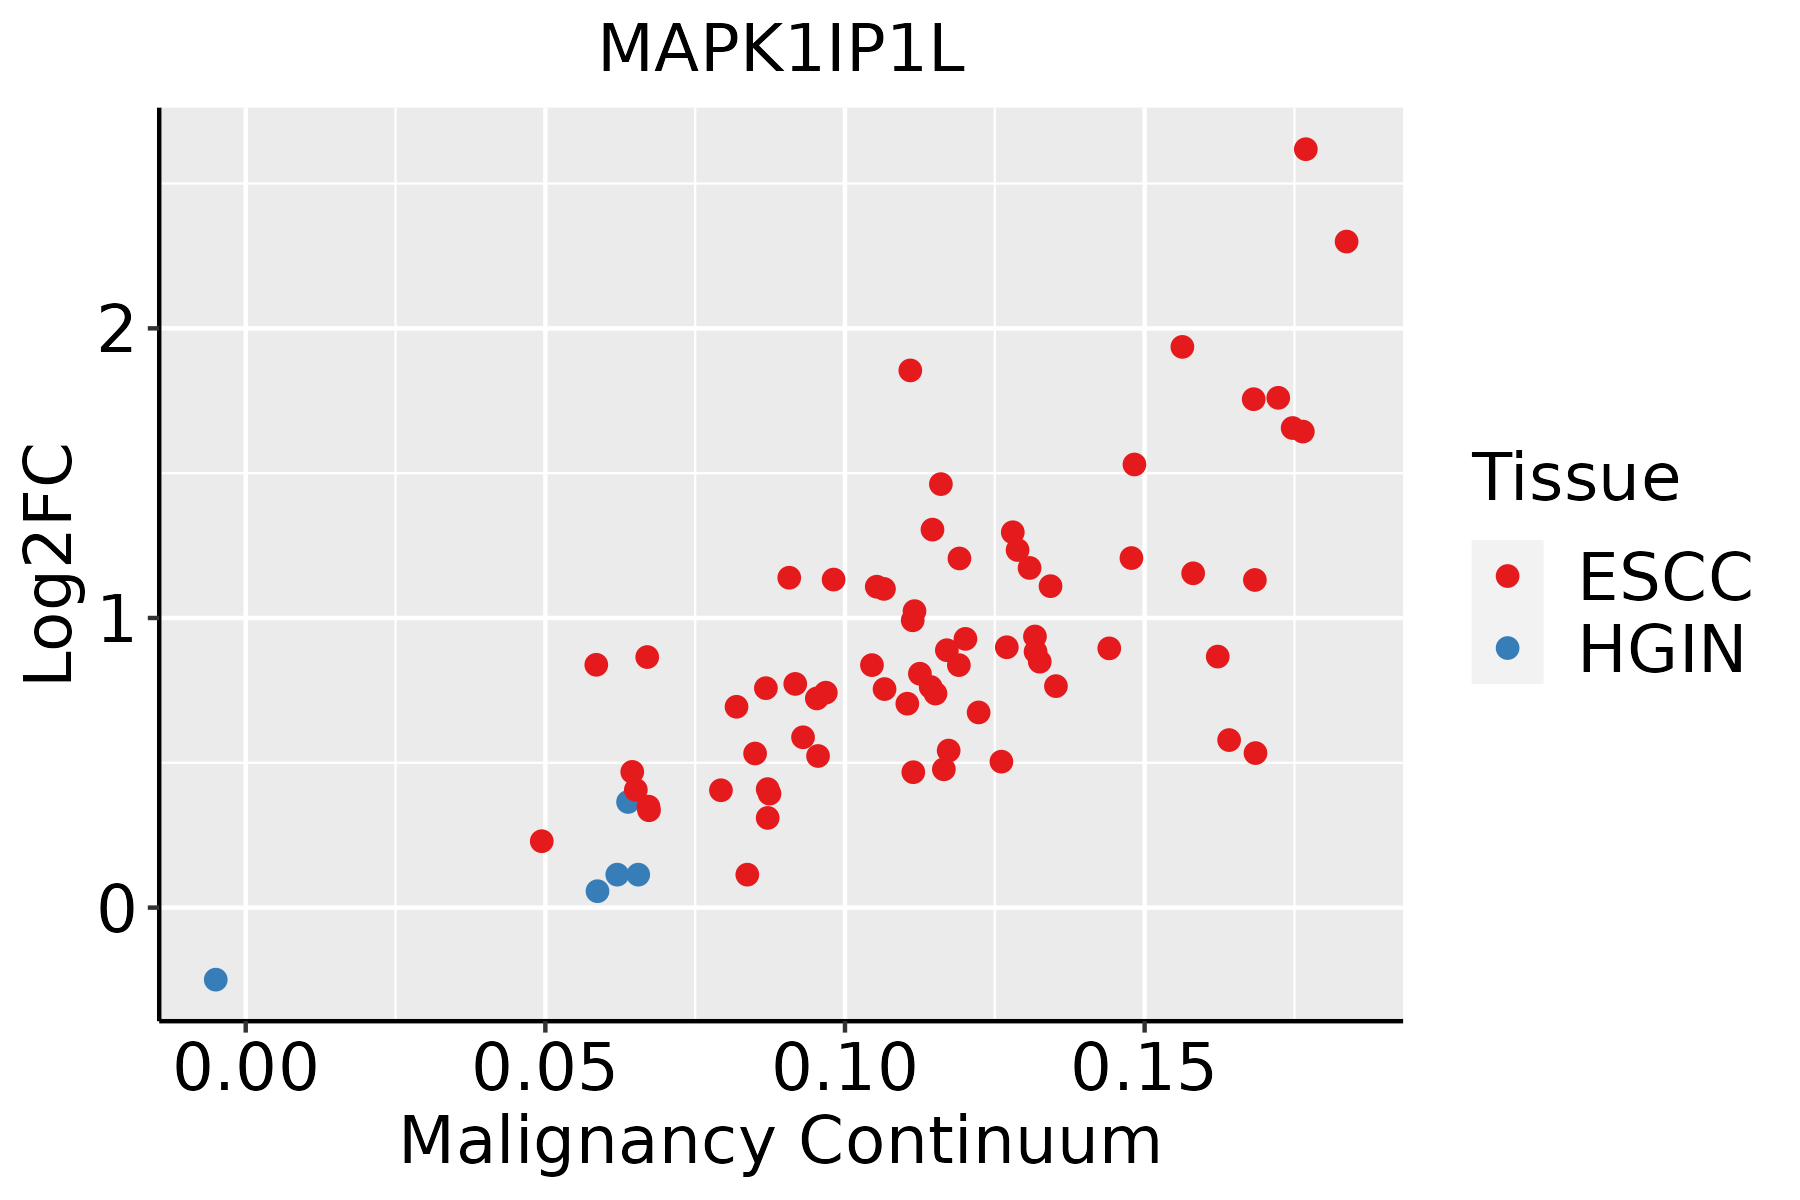 | ESCC: Esophageal squamous cell carcinoma |
| HGIN: High-grade intraepithelial neoplasias | ||
| LGIN: Low-grade intraepithelial neoplasias | ||
| Liver | 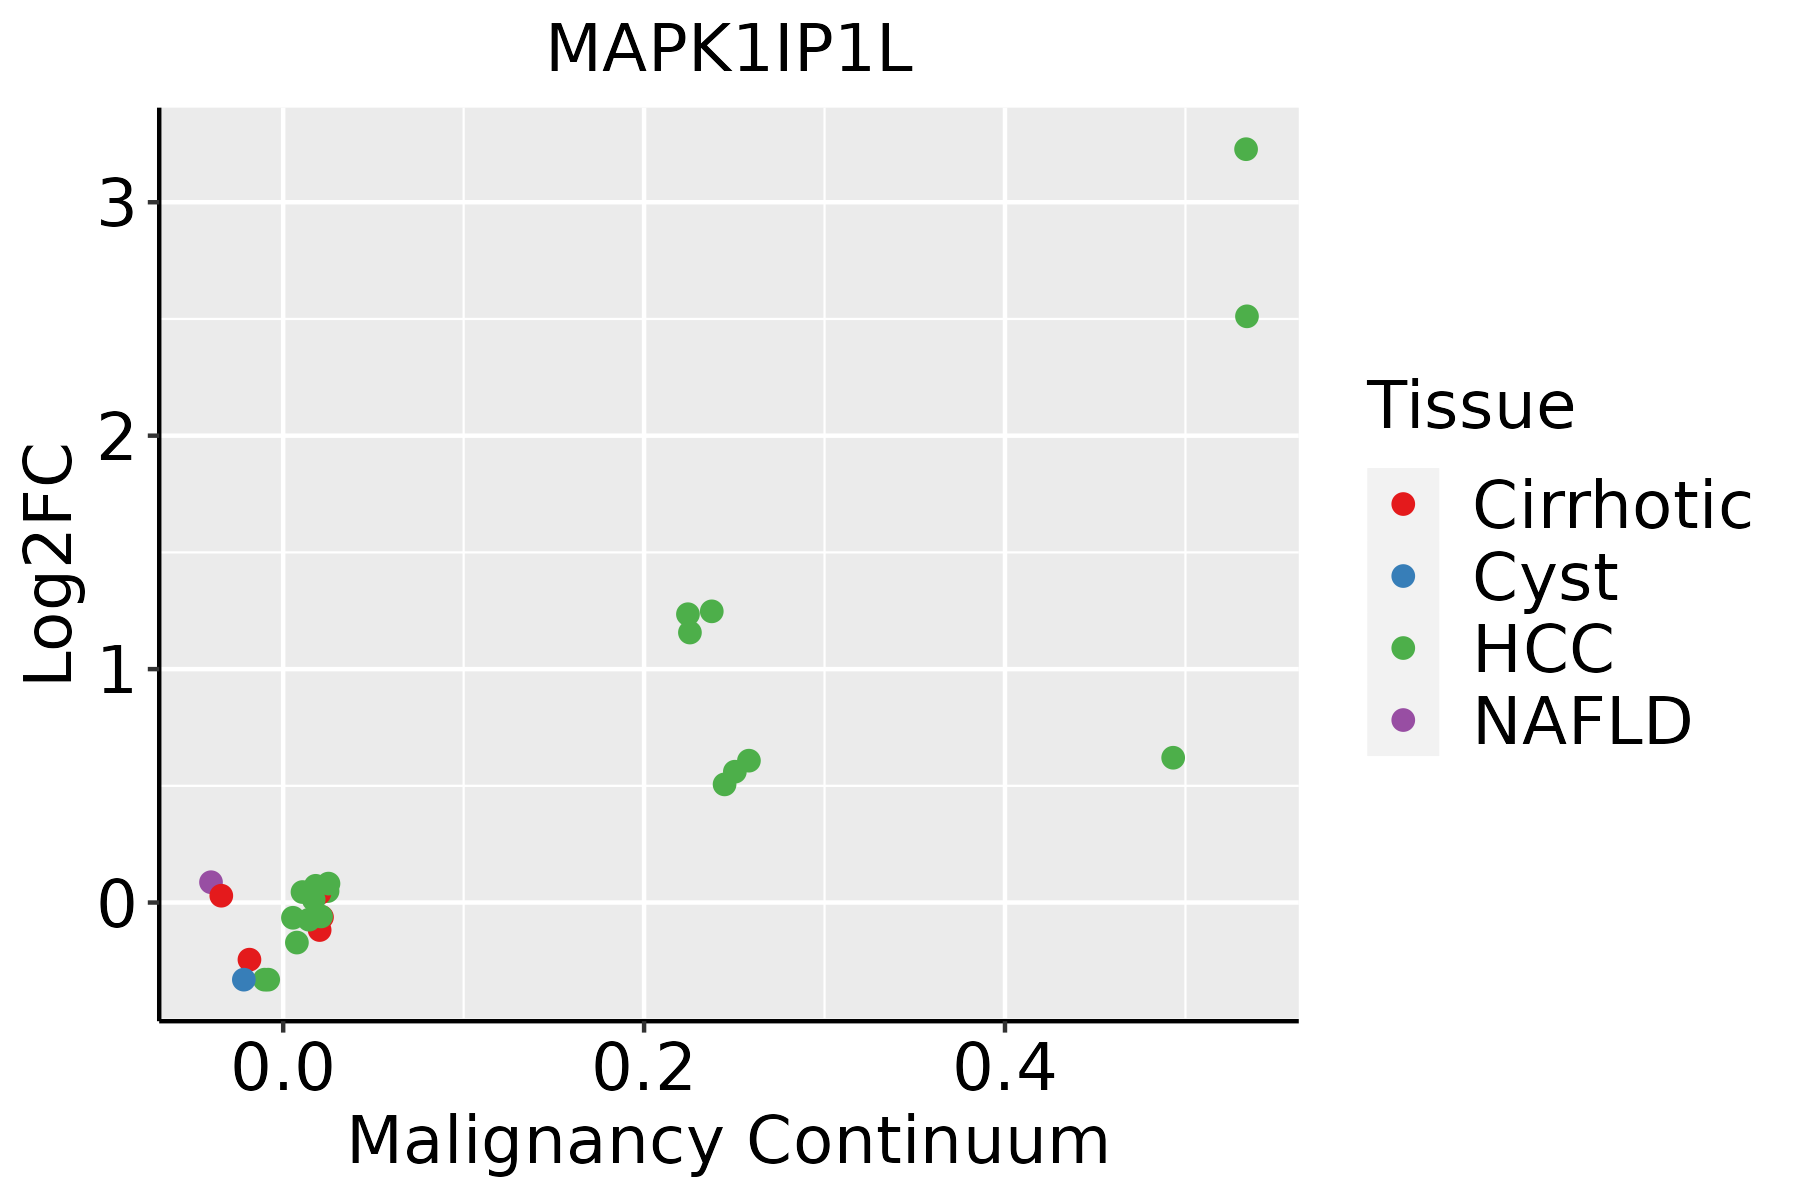 | HCC: Hepatocellular carcinoma |
| NAFLD: Non-alcoholic fatty liver disease | ||
| Oral Cavity | 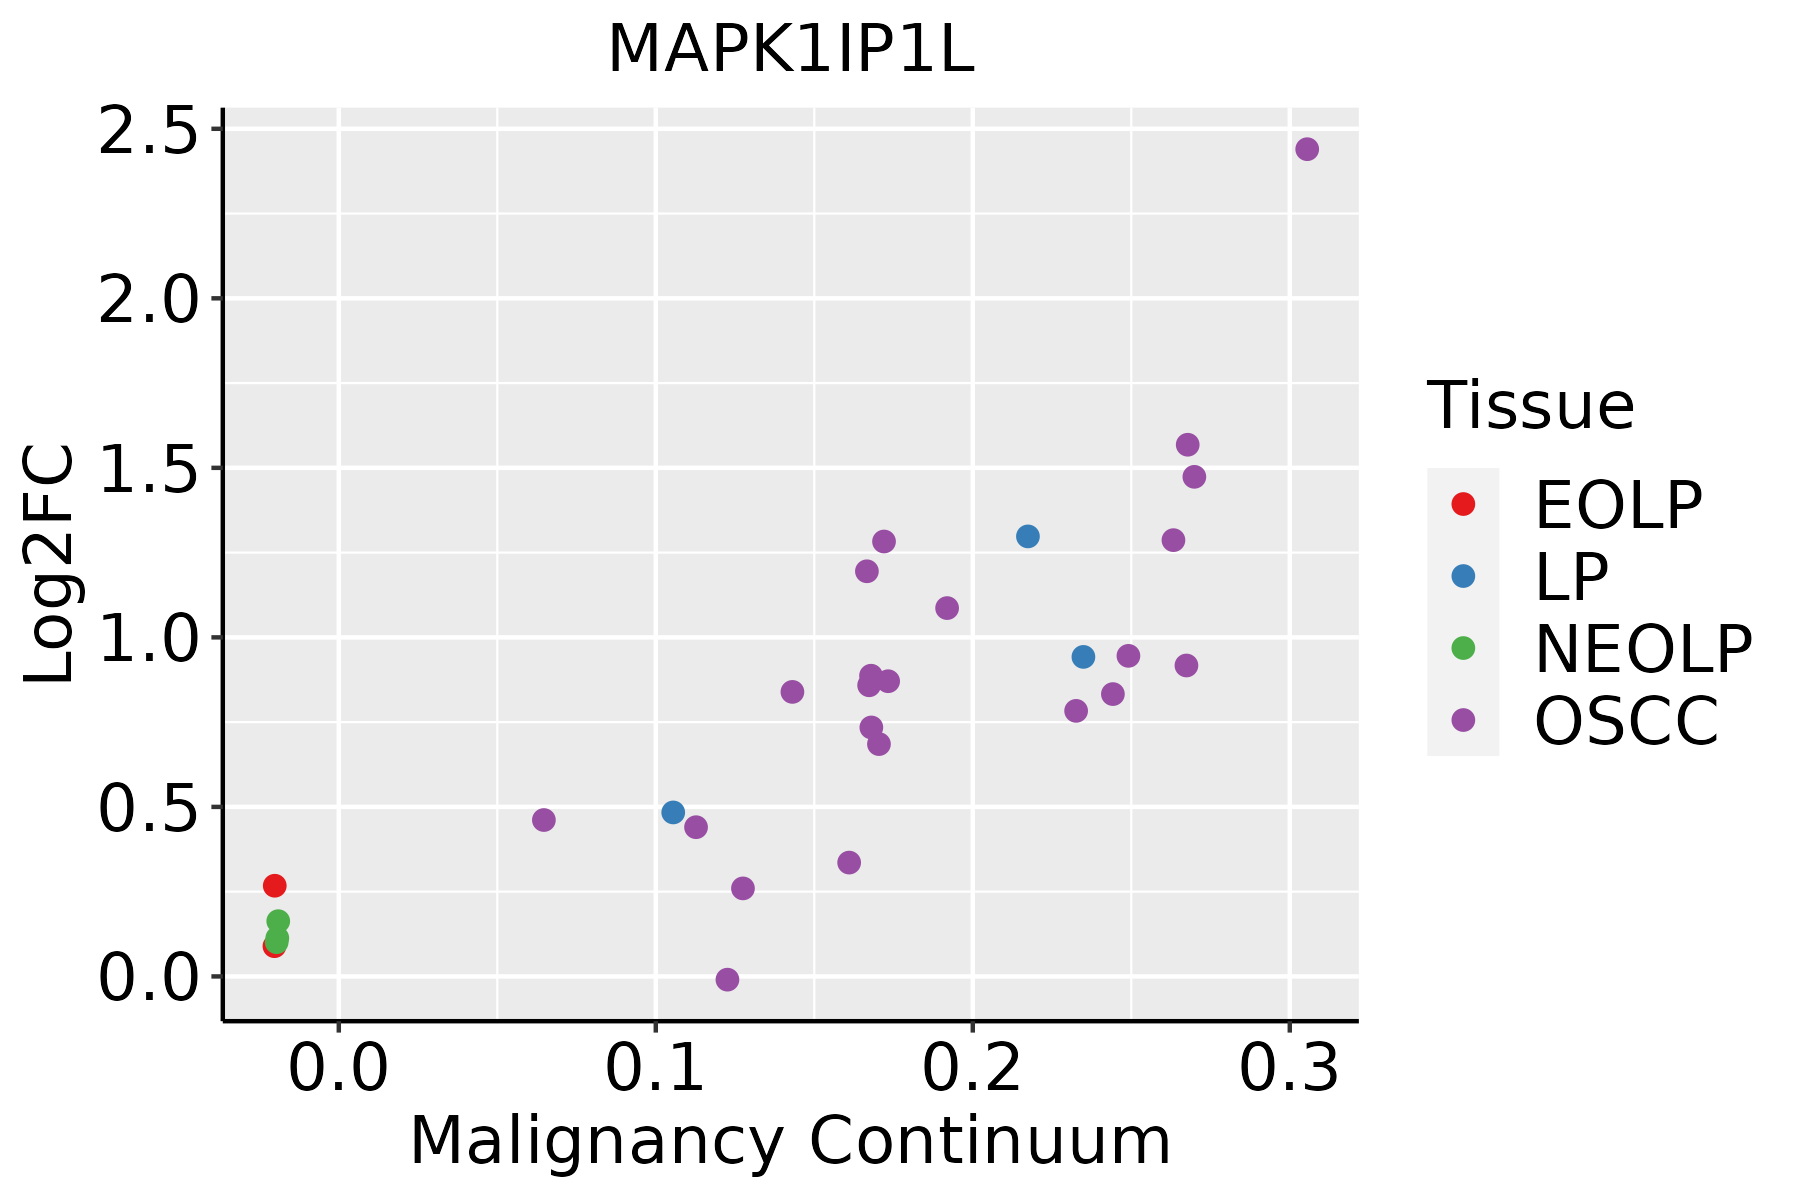 | EOLP: Erosive Oral lichen planus |
| LP: leukoplakia | ||
| NEOLP: Non-erosive oral lichen planus | ||
| OSCC: Oral squamous cell carcinoma | ||
| Skin |  | AK: Actinic keratosis |
| cSCC: Cutaneous squamous cell carcinoma | ||
| SCCIS:squamous cell carcinoma in situ | ||
| Thyroid | 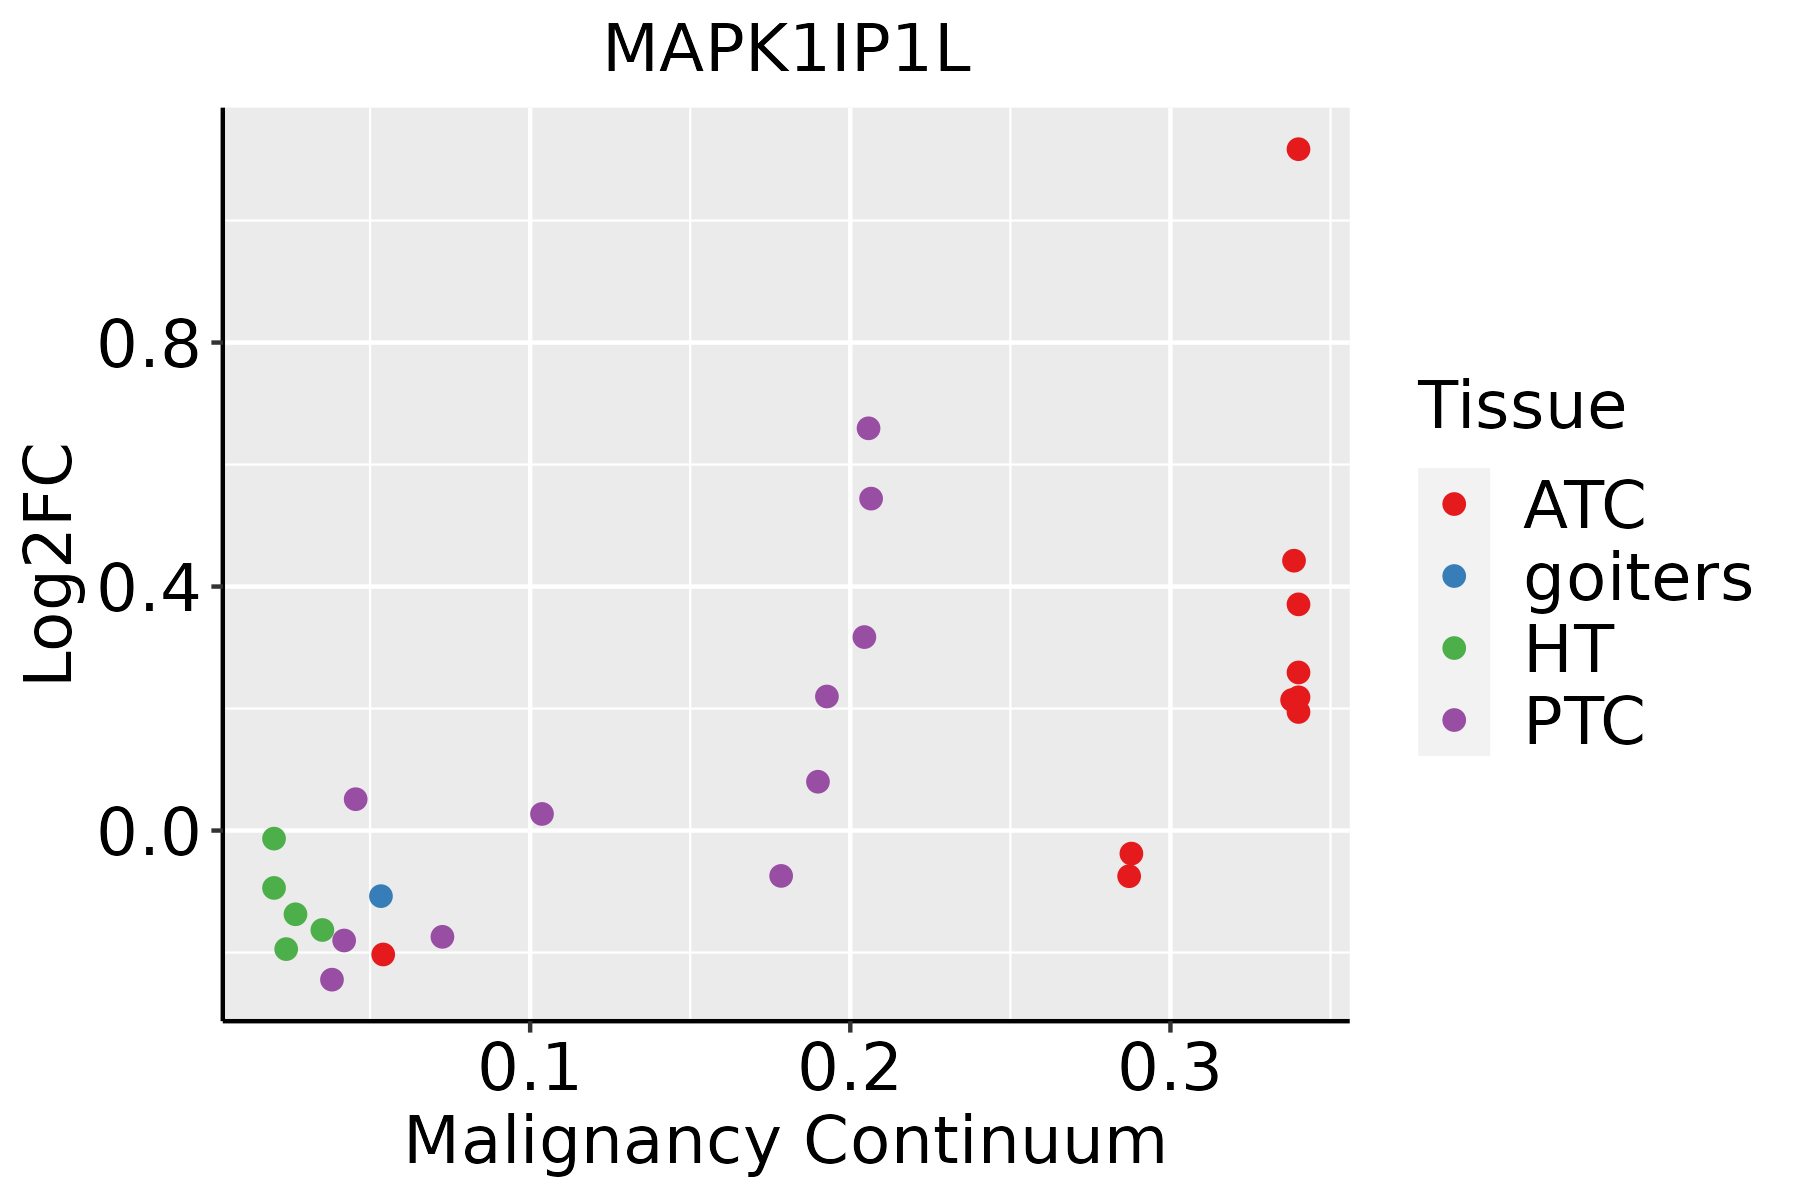 | ATC: Anaplastic thyroid cancer |
| HT: Hashimoto's thyroiditis | ||
| PTC: Papillary thyroid cancer |
| ∗log2FC in expression of this searched gene in stem-like cells from each diseased tissue sample relative to stem-like cells in normal samples in each tissue plotted against the malignancy continuum. Samples are colored based on if they are from different disease stage. |
Top |
Malignant transformation related pathway analysis |
| Find out the enriched GO biological processes and KEGG pathways involved in transition from healthy to precancer to cancer |
| Tissue | Disease Stage | Enriched GO biological Processes |
| Colorectum | AD |  |
| Colorectum | SER |  |
| Colorectum | MSS |  |
| Colorectum | MSI-H |  |
| Colorectum | FAP |  |
| ∗Top 15 enriched GO BP terms are showed in the bar plot of each disease state in each tissue. Each row represents a significant GO biological process which is colored according to the -log10(p.adjust). |
| Page: 1 2 3 4 5 6 7 8 9 |
| GO ID | Tissue | Disease Stage | Description | Gene Ratio | Bg Ratio | pvalue | p.adjust | Count |
| Page: 1 |
| Pathway ID | Tissue | Disease Stage | Description | Gene Ratio | Bg Ratio | pvalue | p.adjust | qvalue | Count |
| Page: 1 |
Top |
Cell-cell communication analysis |
| Identification of potential cell-cell interactions between two cell types and their ligand-receptor pairs for different disease states |
| Ligand | Receptor | LRpair | Pathway | Tissue | Disease Stage |
| Page: 1 |
Top |
Single-cell gene regulatory network inference analysis |
| Find out the significant the regulons (TFs) and the target genes of each regulon across cell types for different disease states |
| TF | Cell Type | Tissue | Disease Stage | Target Gene | RSS | Regulon Activity |
| ∗The dot plots of a searched regulon are shown for all cell subpopulations in each disease state of each tissue based on the regulon specific score inferred using pySCENIC and by calculating the average expression. |
| Page: 1 |
Top |
Somatic mutation of malignant transformation related genes |
| Annotation of somatic variants for genes involved in malignant transformation |
| Hugo Symbol | Variant Class | Variant Classification | dbSNP RS | HGVSc | HGVSp | HGVSp Short | SWISSPROT | BIOTYPE | SIFT | PolyPhen | Tumor Sample Barcode | Tissue | Histology | Sex | Age | Stage | Therapy Types | Drugs | Outcome |
| MAPK1IP1L | SNV | Missense_Mutation | rs759458746 | c.517N>T | p.Pro173Ser | p.P173S | Q8NDC0 | protein_coding | tolerated_low_confidence(0.28) | probably_damaging(0.976) | TCGA-BH-A0HF-01 | Breast | breast invasive carcinoma | Female | >=65 | I/II | Hormone Therapy | arimidex | SD |
| MAPK1IP1L | SNV | Missense_Mutation | c.418G>C | p.Gly140Arg | p.G140R | Q8NDC0 | protein_coding | deleterious_low_confidence(0.01) | possibly_damaging(0.893) | TCGA-AD-6895-01 | Colorectum | colon adenocarcinoma | Male | >=65 | III/IV | Unknown | Unknown | SD | |
| MAPK1IP1L | SNV | Missense_Mutation | novel | c.446C>T | p.Ser149Phe | p.S149F | Q8NDC0 | protein_coding | deleterious_low_confidence(0.03) | possibly_damaging(0.66) | TCGA-CA-6717-01 | Colorectum | colon adenocarcinoma | Male | <65 | I/II | Chemotherapy | oxaliplatin | CR |
| MAPK1IP1L | SNV | Missense_Mutation | novel | c.68N>A | p.Ser23Asn | p.S23N | Q8NDC0 | protein_coding | tolerated_low_confidence(0.21) | benign(0.056) | TCGA-F5-6814-01 | Colorectum | rectum adenocarcinoma | Male | <65 | I/II | Unknown | Unknown | SD |
| MAPK1IP1L | SNV | Missense_Mutation | rs764831052 | c.620C>T | p.Ala207Val | p.A207V | Q8NDC0 | protein_coding | tolerated_low_confidence(0.22) | benign(0.031) | TCGA-AP-A1DK-01 | Endometrium | uterine corpus endometrioid carcinoma | Female | <65 | I/II | Unknown | Unknown | SD |
| MAPK1IP1L | SNV | Missense_Mutation | novel | c.41A>G | p.His14Arg | p.H14R | Q8NDC0 | protein_coding | tolerated_low_confidence(0.33) | benign(0.037) | TCGA-B5-A3FC-01 | Endometrium | uterine corpus endometrioid carcinoma | Female | <65 | I/II | Unknown | Unknown | SD |
| MAPK1IP1L | SNV | Missense_Mutation | c.35C>G | p.Pro12Arg | p.P12R | Q8NDC0 | protein_coding | deleterious_low_confidence(0) | probably_damaging(0.998) | TCGA-BS-A0UM-01 | Endometrium | uterine corpus endometrioid carcinoma | Female | <65 | I/II | Chemotherapy | adriamycin | SD | |
| MAPK1IP1L | SNV | Missense_Mutation | c.229N>A | p.Pro77Thr | p.P77T | Q8NDC0 | protein_coding | deleterious_low_confidence(0.03) | probably_damaging(0.998) | TCGA-D1-A16B-01 | Endometrium | uterine corpus endometrioid carcinoma | Female | <65 | I/II | Unknown | Unknown | SD | |
| MAPK1IP1L | SNV | Missense_Mutation | c.361N>G | p.Met121Val | p.M121V | Q8NDC0 | protein_coding | tolerated_low_confidence(0.11) | benign(0.001) | TCGA-D1-A17Q-01 | Endometrium | uterine corpus endometrioid carcinoma | Female | <65 | I/II | Unknown | Unknown | SD | |
| MAPK1IP1L | SNV | Missense_Mutation | rs550229007 | c.461N>T | p.Ala154Val | p.A154V | Q8NDC0 | protein_coding | deleterious_low_confidence(0.01) | benign(0.059) | TCGA-DI-A1BU-01 | Endometrium | uterine corpus endometrioid carcinoma | Female | <65 | I/II | Chemotherapy | paclitaxel | SD |
| Page: 1 2 |
Top |
Related drugs of malignant transformation related genes |
| Identification of chemicals and drugs interact with genes involved in malignant transfromation |
| (DGIdb 4.0) |
| Entrez ID | Symbol | Category | Interaction Types | Drug Claim Name | Drug Name | PMIDs |
| Page: 1 |

Copyright 2023-Present -The University of Texas Health Science Center at Houston |