
|
|||||
|
 | |
| |
| |
| |
| |
| |
|
Gene: MAPK14 |
Gene summary for MAPK14 |
| Gene information | Species | Human | Gene symbol | MAPK14 | Gene ID | 1432 |
| Gene name | mitogen-activated protein kinase 14 | |
| Gene Alias | CSBP | |
| Cytomap | 6p21.31 | |
| Gene Type | protein-coding | GO ID | GO:0000003 | UniProtAcc | L7RSM2 |
Top |
Malignant transformation analysis |
| Identification of the aberrant gene expression in precancerous and cancerous lesions by comparing the gene expression of stem-like cells in diseased tissues with normal stem cells |
| Entrez ID | Symbol | Replicates | Species | Organ | Tissue | Adj P-value | Log2FC | Malignancy |
| 1432 | MAPK14 | CCI_1 | Human | Cervix | CC | 4.24e-05 | 6.07e-01 | 0.528 |
| 1432 | MAPK14 | CCI_2 | Human | Cervix | CC | 5.67e-04 | 8.48e-01 | 0.5249 |
| 1432 | MAPK14 | CCI_3 | Human | Cervix | CC | 1.05e-08 | 6.61e-01 | 0.516 |
| 1432 | MAPK14 | LZE4T | Human | Esophagus | ESCC | 1.68e-03 | 8.36e-02 | 0.0811 |
| 1432 | MAPK14 | LZE5T | Human | Esophagus | ESCC | 3.77e-02 | 3.41e-01 | 0.0514 |
| 1432 | MAPK14 | LZE7T | Human | Esophagus | ESCC | 5.41e-03 | 1.66e-01 | 0.0667 |
| 1432 | MAPK14 | LZE20T | Human | Esophagus | ESCC | 8.53e-06 | 1.71e-01 | 0.0662 |
| 1432 | MAPK14 | LZE22T | Human | Esophagus | ESCC | 2.47e-03 | 2.04e-01 | 0.068 |
| 1432 | MAPK14 | LZE24T | Human | Esophagus | ESCC | 2.33e-15 | 2.31e-01 | 0.0596 |
| 1432 | MAPK14 | LZE21T | Human | Esophagus | ESCC | 4.83e-06 | 2.74e-01 | 0.0655 |
| 1432 | MAPK14 | P1T-E | Human | Esophagus | ESCC | 5.76e-09 | 2.83e-01 | 0.0875 |
| 1432 | MAPK14 | P2T-E | Human | Esophagus | ESCC | 1.15e-37 | 5.57e-01 | 0.1177 |
| 1432 | MAPK14 | P4T-E | Human | Esophagus | ESCC | 5.29e-20 | 3.45e-01 | 0.1323 |
| 1432 | MAPK14 | P5T-E | Human | Esophagus | ESCC | 2.65e-12 | 2.43e-01 | 0.1327 |
| 1432 | MAPK14 | P8T-E | Human | Esophagus | ESCC | 2.20e-22 | 2.67e-01 | 0.0889 |
| 1432 | MAPK14 | P9T-E | Human | Esophagus | ESCC | 4.38e-06 | 7.41e-02 | 0.1131 |
| 1432 | MAPK14 | P10T-E | Human | Esophagus | ESCC | 1.73e-21 | 1.97e-01 | 0.116 |
| 1432 | MAPK14 | P11T-E | Human | Esophagus | ESCC | 8.80e-13 | 3.67e-01 | 0.1426 |
| 1432 | MAPK14 | P12T-E | Human | Esophagus | ESCC | 5.43e-16 | 2.57e-01 | 0.1122 |
| 1432 | MAPK14 | P15T-E | Human | Esophagus | ESCC | 2.20e-12 | 1.72e-01 | 0.1149 |
| Page: 1 2 3 4 5 6 |
| Tissue | Expression Dynamics | Abbreviation |
| Cervix |  | CC: Cervix cancer |
| HSIL_HPV: HPV-infected high-grade squamous intraepithelial lesions | ||
| N_HPV: HPV-infected normal cervix | ||
| Esophagus | 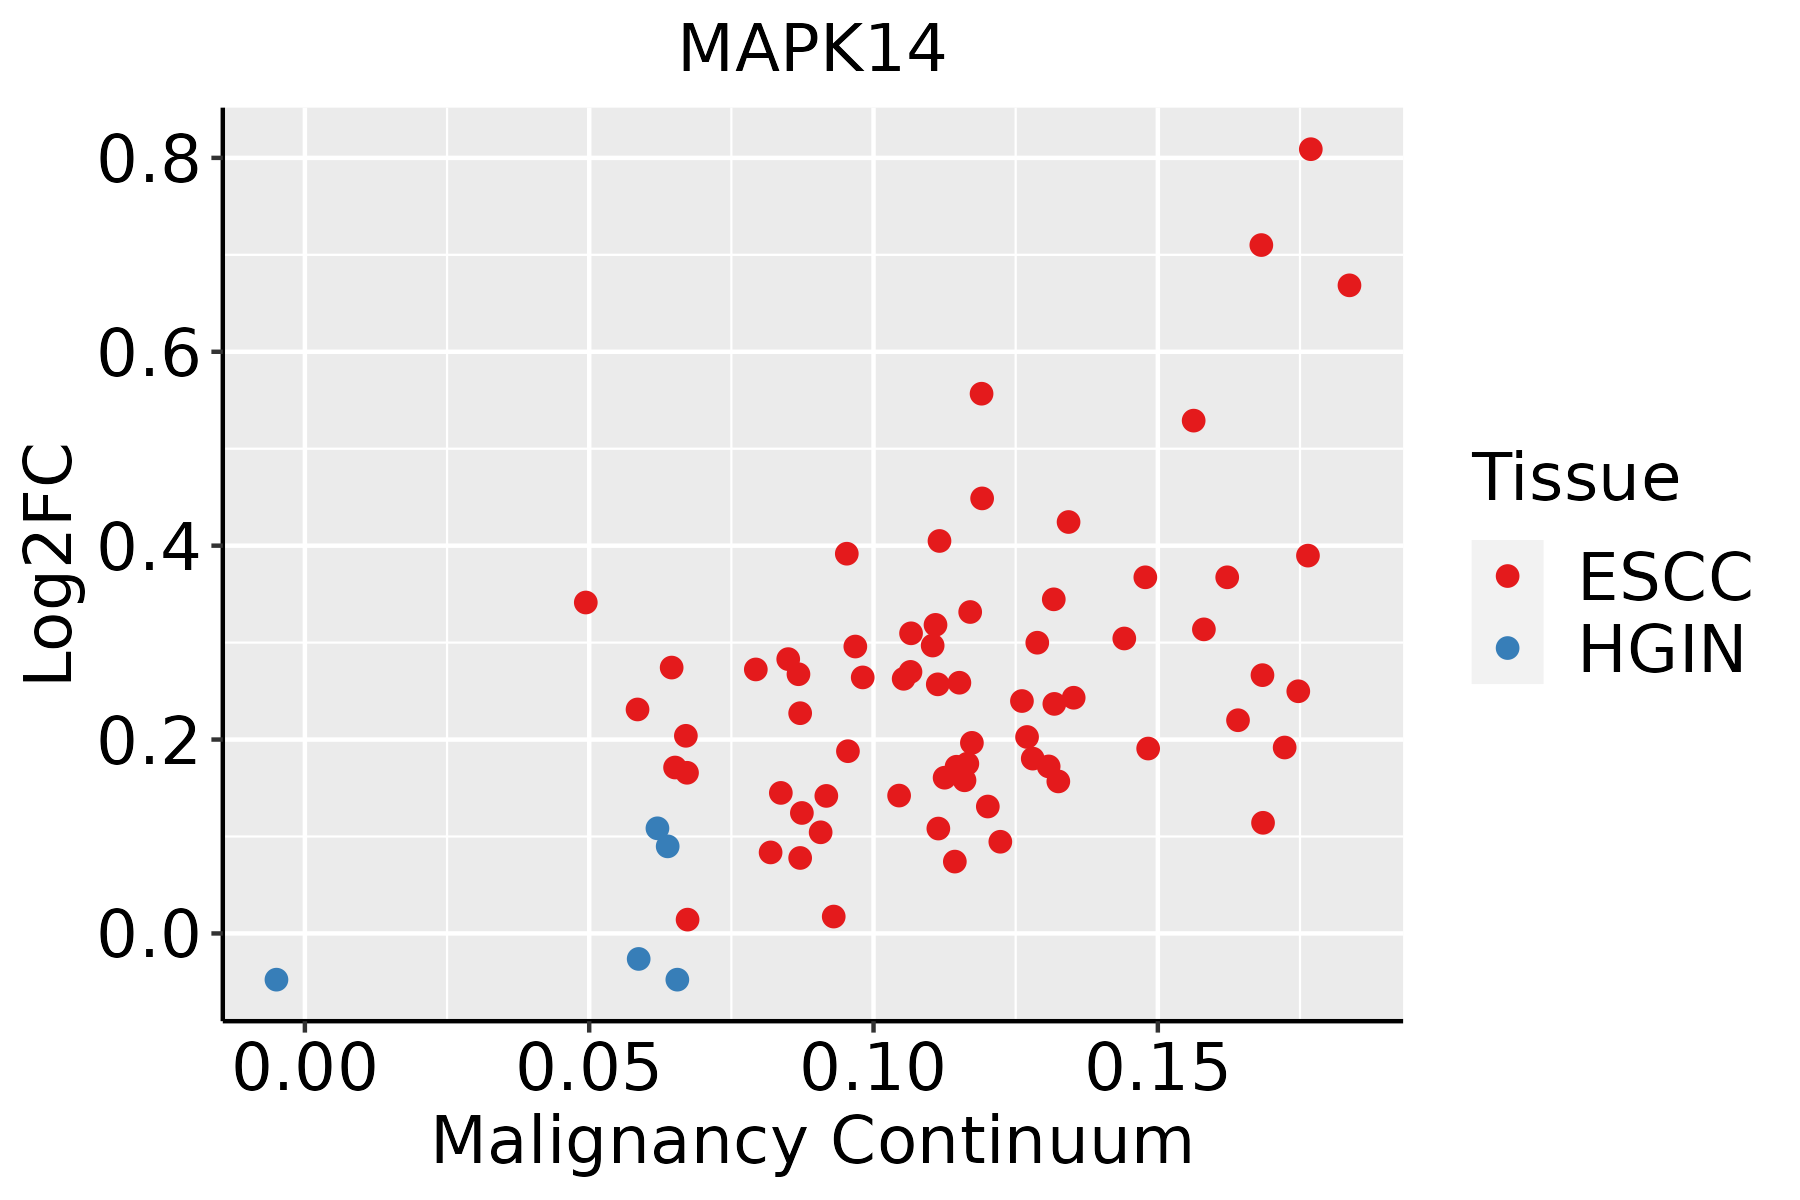 | ESCC: Esophageal squamous cell carcinoma |
| HGIN: High-grade intraepithelial neoplasias | ||
| LGIN: Low-grade intraepithelial neoplasias | ||
| Liver | 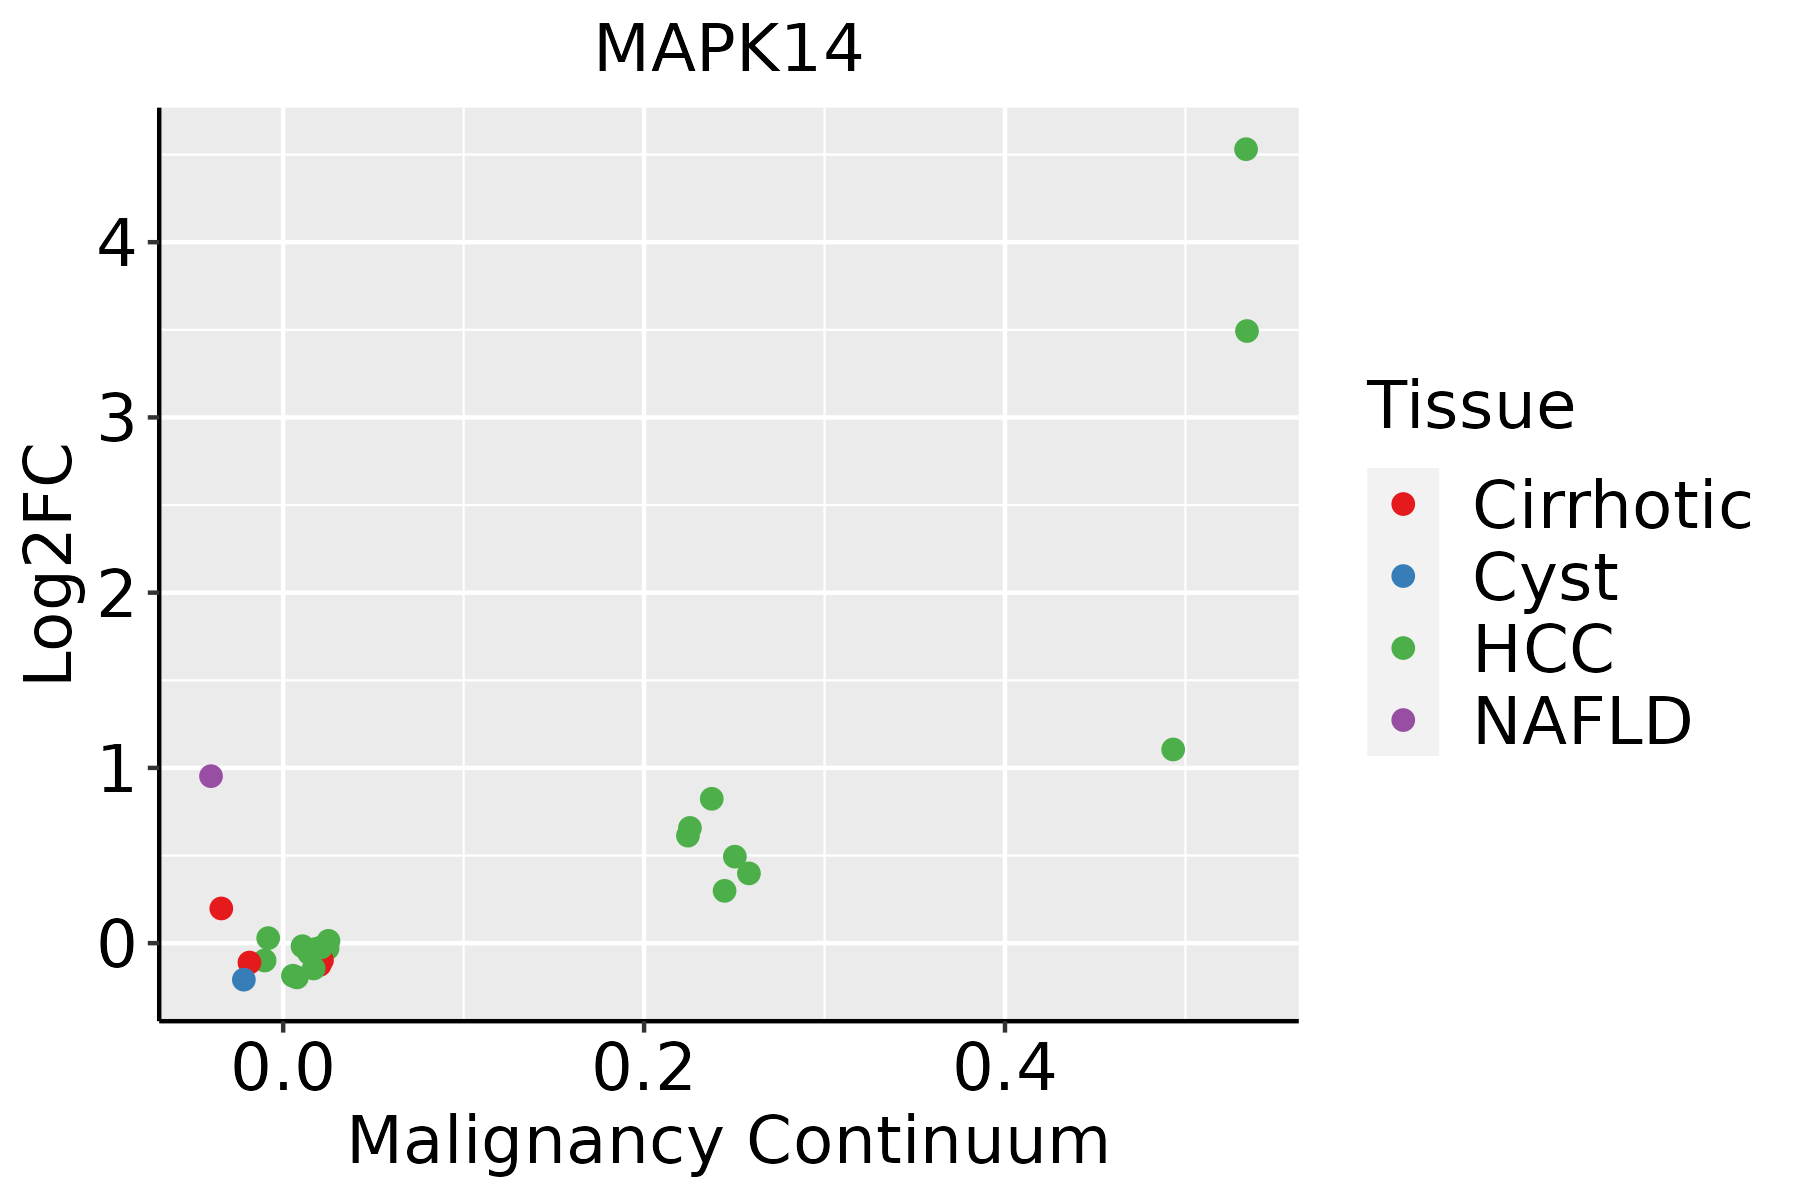 | HCC: Hepatocellular carcinoma |
| NAFLD: Non-alcoholic fatty liver disease | ||
| Oral Cavity | 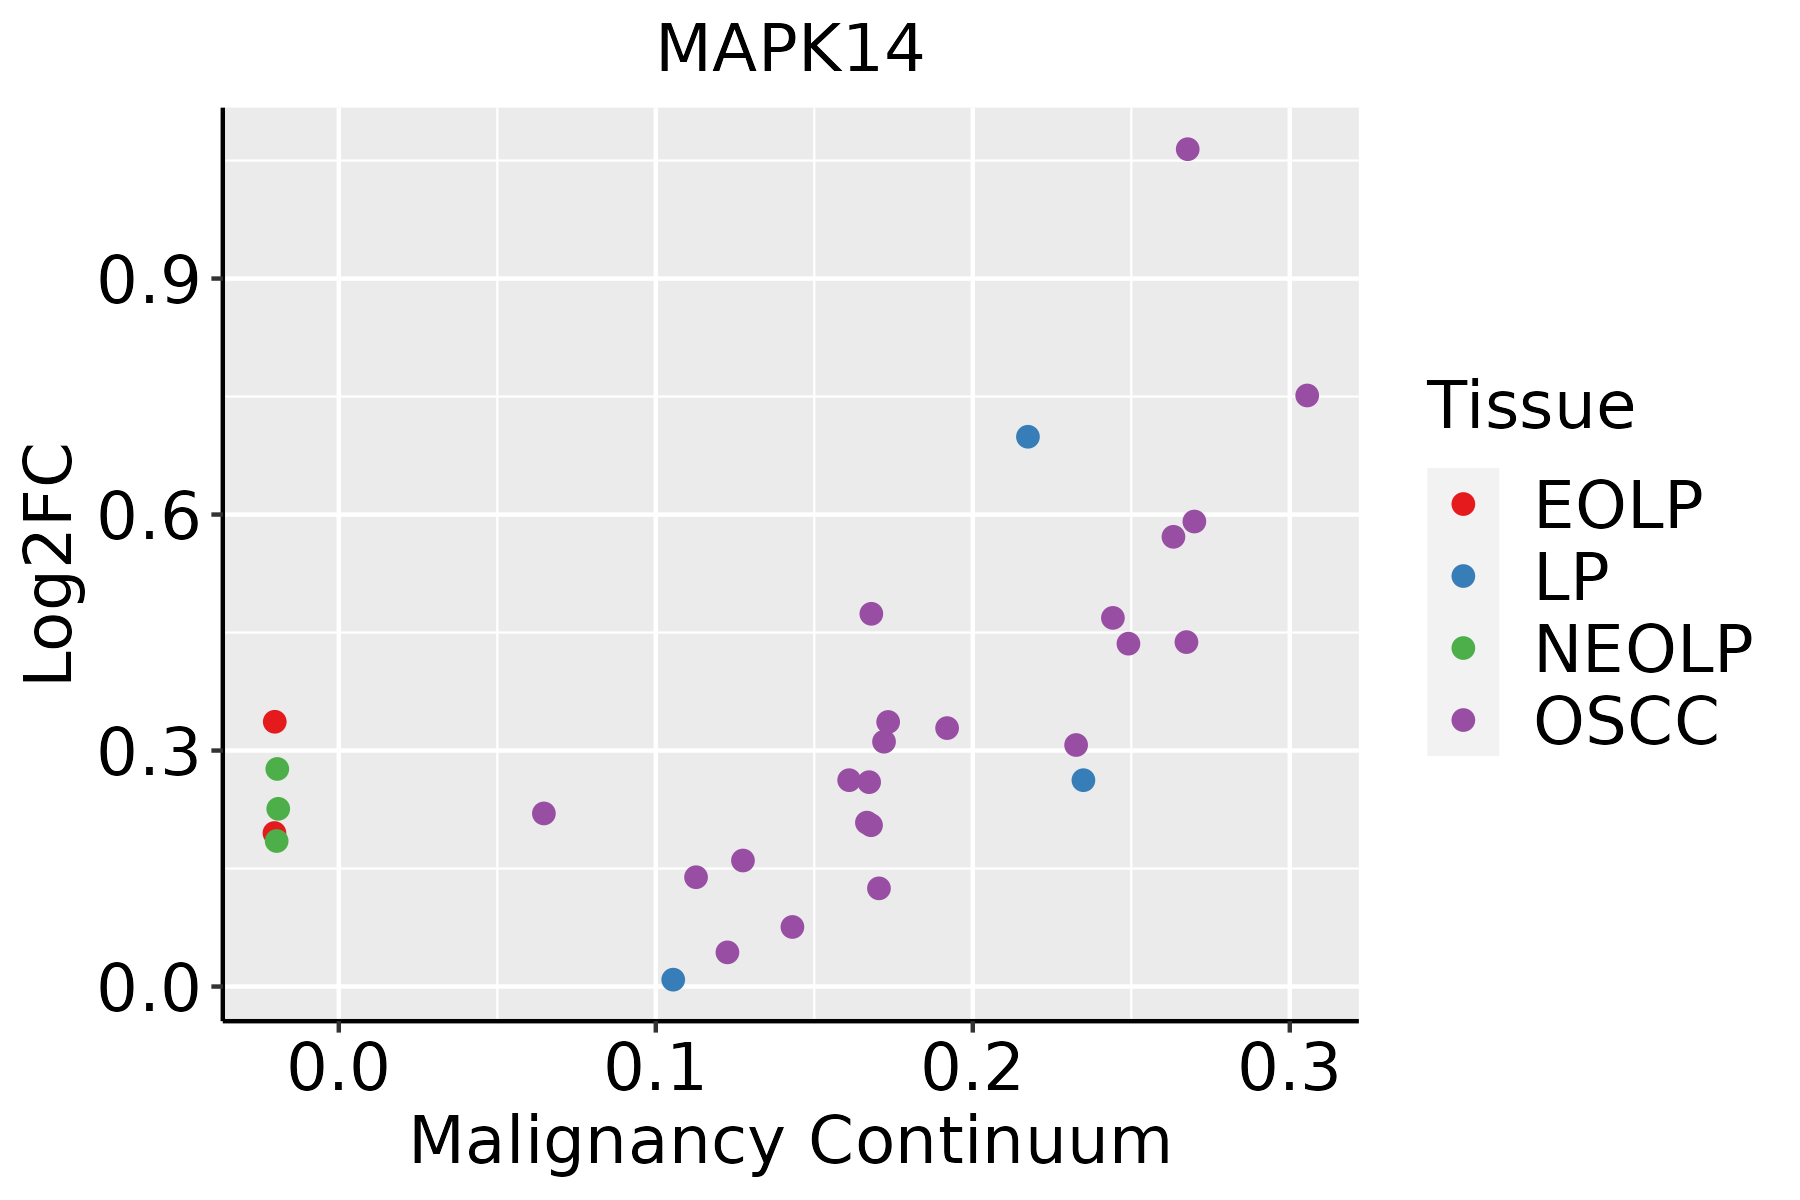 | EOLP: Erosive Oral lichen planus |
| LP: leukoplakia | ||
| NEOLP: Non-erosive oral lichen planus | ||
| OSCC: Oral squamous cell carcinoma | ||
| Prostate | 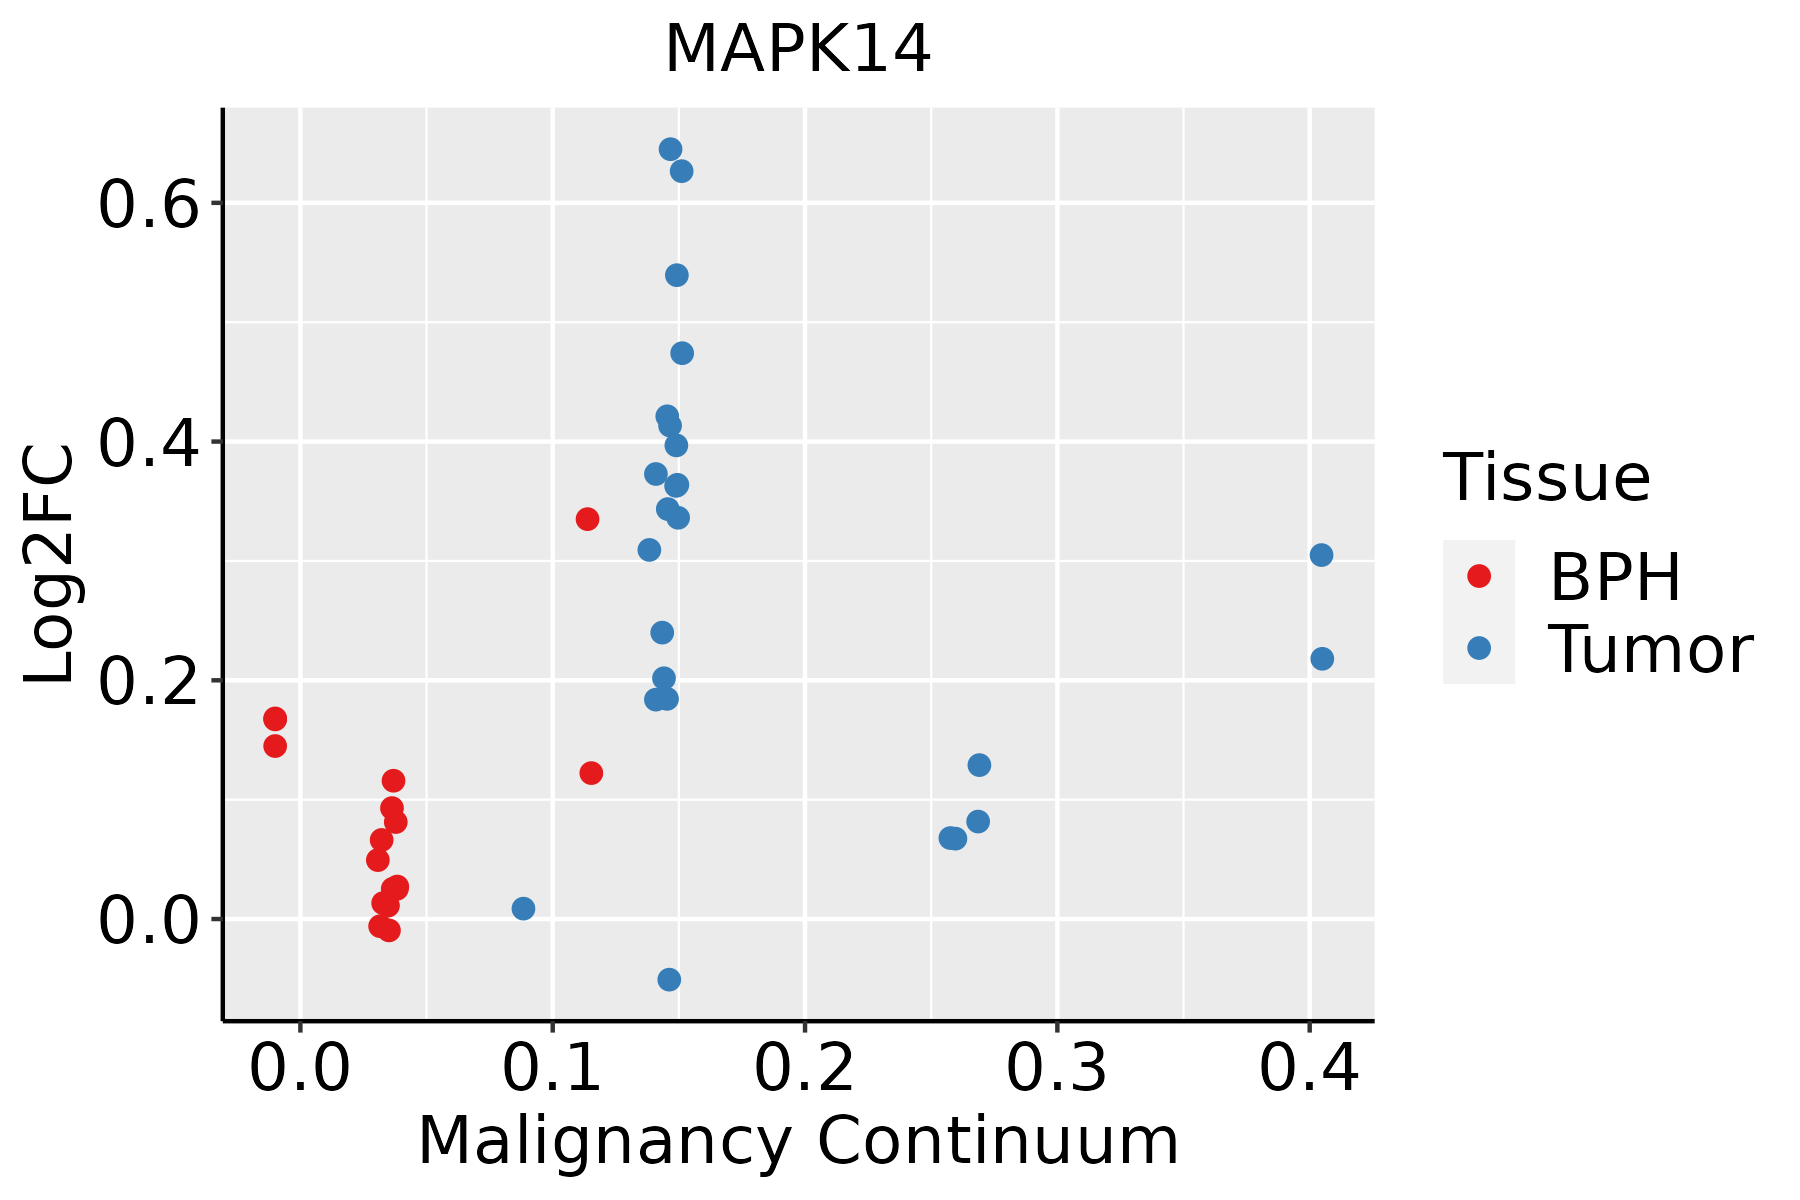 | BPH: Benign Prostatic Hyperplasia |
| Thyroid | 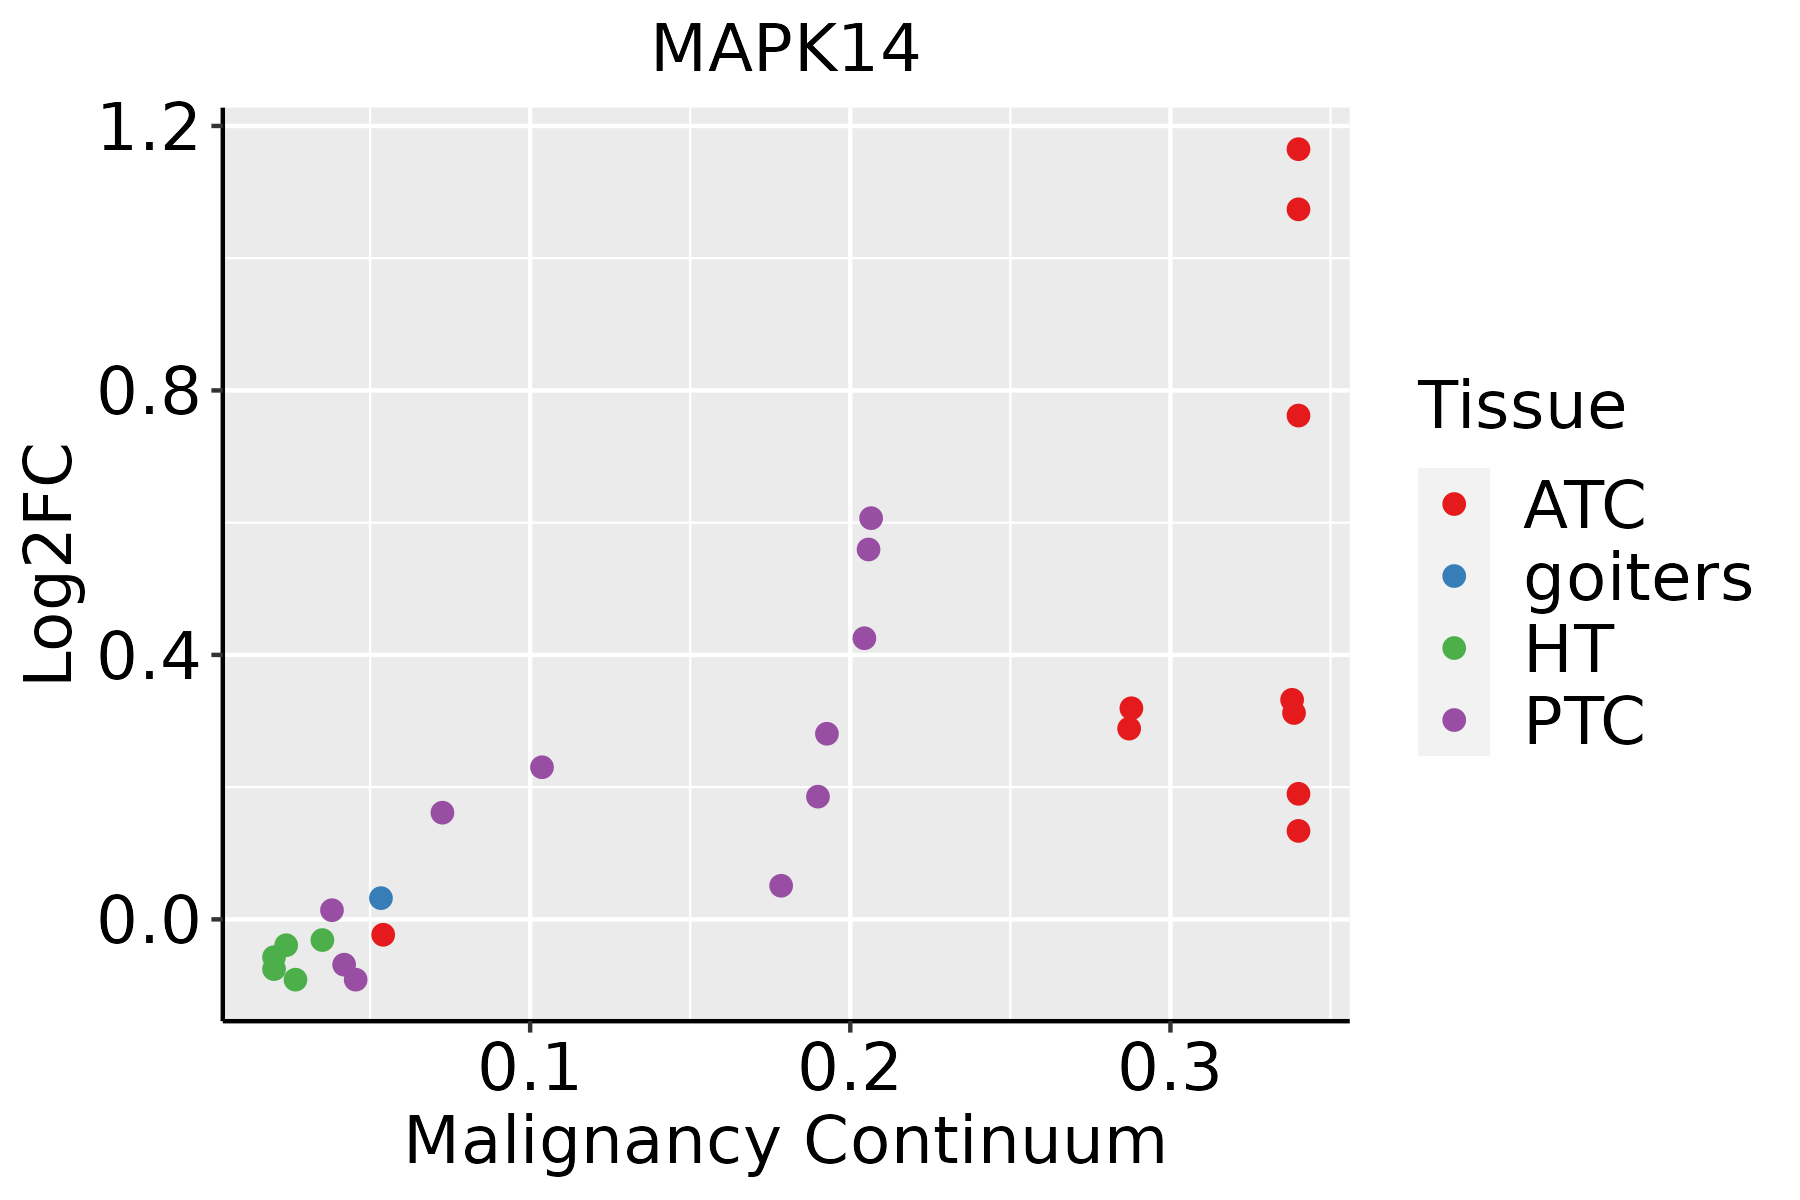 | ATC: Anaplastic thyroid cancer |
| HT: Hashimoto's thyroiditis | ||
| PTC: Papillary thyroid cancer |
| ∗log2FC in expression of this searched gene in stem-like cells from each diseased tissue sample relative to stem-like cells in normal samples in each tissue plotted against the malignancy continuum. Samples are colored based on if they are from different disease stage. |
Top |
Malignant transformation related pathway analysis |
| Find out the enriched GO biological processes and KEGG pathways involved in transition from healthy to precancer to cancer |
| Tissue | Disease Stage | Enriched GO biological Processes |
| Colorectum | AD |  |
| Colorectum | SER |  |
| Colorectum | MSS |  |
| Colorectum | MSI-H |  |
| Colorectum | FAP |  |
| ∗Top 15 enriched GO BP terms are showed in the bar plot of each disease state in each tissue. Each row represents a significant GO biological process which is colored according to the -log10(p.adjust). |
| Page: 1 2 3 4 5 6 7 8 9 |
| GO ID | Tissue | Disease Stage | Description | Gene Ratio | Bg Ratio | pvalue | p.adjust | Count |
| GO:004206010 | Cervix | CC | wound healing | 109/2311 | 422/18723 | 1.84e-14 | 1.57e-11 | 109 |
| GO:00725949 | Cervix | CC | establishment of protein localization to organelle | 99/2311 | 422/18723 | 1.23e-10 | 2.11e-08 | 99 |
| GO:002240710 | Cervix | CC | regulation of cell-cell adhesion | 103/2311 | 448/18723 | 1.78e-10 | 2.87e-08 | 103 |
| GO:190382910 | Cervix | CC | positive regulation of cellular protein localization | 72/2311 | 276/18723 | 3.20e-10 | 4.46e-08 | 72 |
| GO:00160557 | Cervix | CC | Wnt signaling pathway | 98/2311 | 444/18723 | 4.82e-09 | 4.65e-07 | 98 |
| GO:01987387 | Cervix | CC | cell-cell signaling by wnt | 98/2311 | 446/18723 | 6.16e-09 | 5.58e-07 | 98 |
| GO:005122210 | Cervix | CC | positive regulation of protein transport | 72/2311 | 303/18723 | 2.36e-08 | 1.70e-06 | 72 |
| GO:00026837 | Cervix | CC | negative regulation of immune system process | 94/2311 | 434/18723 | 2.63e-08 | 1.87e-06 | 94 |
| GO:00301117 | Cervix | CC | regulation of Wnt signaling pathway | 76/2311 | 328/18723 | 3.05e-08 | 2.08e-06 | 76 |
| GO:00069139 | Cervix | CC | nucleocytoplasmic transport | 71/2311 | 301/18723 | 4.04e-08 | 2.54e-06 | 71 |
| GO:00511699 | Cervix | CC | nuclear transport | 71/2311 | 301/18723 | 4.04e-08 | 2.54e-06 | 71 |
| GO:190495110 | Cervix | CC | positive regulation of establishment of protein localization | 73/2311 | 319/18723 | 9.69e-08 | 5.25e-06 | 73 |
| GO:00345048 | Cervix | CC | protein localization to nucleus | 68/2311 | 290/18723 | 9.91e-08 | 5.25e-06 | 68 |
| GO:003133010 | Cervix | CC | negative regulation of cellular catabolic process | 63/2311 | 262/18723 | 1.10e-07 | 5.68e-06 | 63 |
| GO:003009910 | Cervix | CC | myeloid cell differentiation | 83/2311 | 381/18723 | 1.31e-07 | 6.42e-06 | 83 |
| GO:190370610 | Cervix | CC | regulation of hemopoiesis | 80/2311 | 367/18723 | 2.14e-07 | 9.55e-06 | 80 |
| GO:000226210 | Cervix | CC | myeloid cell homeostasis | 43/2311 | 157/18723 | 2.66e-07 | 1.12e-05 | 43 |
| GO:00075689 | Cervix | CC | aging | 75/2311 | 339/18723 | 2.75e-07 | 1.13e-05 | 75 |
| GO:00018908 | Cervix | CC | placenta development | 40/2311 | 144/18723 | 4.59e-07 | 1.77e-05 | 40 |
| GO:00064029 | Cervix | CC | mRNA catabolic process | 56/2311 | 232/18723 | 4.81e-07 | 1.83e-05 | 56 |
| Page: 1 2 3 4 5 6 7 8 9 10 11 12 13 14 15 16 17 18 19 20 21 22 23 24 25 26 27 28 29 30 31 32 33 34 35 36 37 38 39 40 41 42 43 44 45 46 47 48 49 50 51 52 53 54 55 56 57 58 59 60 61 62 63 64 65 66 67 68 69 70 71 72 73 74 |
| Pathway ID | Tissue | Disease Stage | Description | Gene Ratio | Bg Ratio | pvalue | p.adjust | qvalue | Count |
| hsa0517120 | Cervix | CC | Coronavirus disease - COVID-19 | 111/1267 | 232/8465 | 1.82e-33 | 5.90e-31 | 3.49e-31 | 111 |
| hsa0520820 | Cervix | CC | Chemical carcinogenesis - reactive oxygen species | 92/1267 | 223/8465 | 4.71e-22 | 5.09e-20 | 3.01e-20 | 92 |
| hsa0502018 | Cervix | CC | Prion disease | 98/1267 | 273/8465 | 2.64e-18 | 1.42e-16 | 8.42e-17 | 98 |
| hsa0541520 | Cervix | CC | Diabetic cardiomyopathy | 76/1267 | 203/8465 | 1.40e-15 | 6.46e-14 | 3.82e-14 | 76 |
| hsa0502218 | Cervix | CC | Pathways of neurodegeneration - multiple diseases | 128/1267 | 476/8465 | 2.87e-12 | 9.29e-11 | 5.50e-11 | 128 |
| hsa0493218 | Cervix | CC | Non-alcoholic fatty liver disease | 58/1267 | 155/8465 | 3.58e-12 | 1.05e-10 | 6.23e-11 | 58 |
| hsa0471420 | Cervix | CC | Thermogenesis | 76/1267 | 232/8465 | 4.29e-12 | 1.16e-10 | 6.85e-11 | 76 |
| hsa0501418 | Cervix | CC | Amyotrophic lateral sclerosis | 103/1267 | 364/8465 | 1.79e-11 | 4.47e-10 | 2.64e-10 | 103 |
| hsa0541820 | Cervix | CC | Fluid shear stress and atherosclerosis | 50/1267 | 139/8465 | 5.71e-10 | 1.32e-08 | 7.81e-09 | 50 |
| hsa0513020 | Cervix | CC | Pathogenic Escherichia coli infection | 63/1267 | 197/8465 | 9.28e-10 | 2.00e-08 | 1.19e-08 | 63 |
| hsa0513220 | Cervix | CC | Salmonella infection | 74/1267 | 249/8465 | 1.33e-09 | 2.54e-08 | 1.50e-08 | 74 |
| hsa0541720 | Cervix | CC | Lipid and atherosclerosis | 65/1267 | 215/8465 | 6.47e-09 | 1.10e-07 | 6.52e-08 | 65 |
| hsa0516720 | Cervix | CC | Kaposi sarcoma-associated herpesvirus infection | 60/1267 | 194/8465 | 9.74e-09 | 1.58e-07 | 9.33e-08 | 60 |
| hsa0516318 | Cervix | CC | Human cytomegalovirus infection | 65/1267 | 225/8465 | 4.59e-08 | 6.47e-07 | 3.83e-07 | 65 |
| hsa0513120 | Cervix | CC | Shigellosis | 69/1267 | 247/8465 | 7.64e-08 | 1.03e-06 | 6.10e-07 | 69 |
| hsa0520516 | Cervix | CC | Proteoglycans in cancer | 60/1267 | 205/8465 | 9.13e-08 | 1.18e-06 | 7.00e-07 | 60 |
| hsa0421810 | Cervix | CC | Cellular senescence | 49/1267 | 156/8465 | 1.30e-07 | 1.63e-06 | 9.61e-07 | 49 |
| hsa0516920 | Cervix | CC | Epstein-Barr virus infection | 57/1267 | 202/8465 | 7.30e-07 | 7.39e-06 | 4.37e-06 | 57 |
| hsa0467020 | Cervix | CC | Leukocyte transendothelial migration | 36/1267 | 114/8465 | 5.22e-06 | 4.83e-05 | 2.86e-05 | 36 |
| hsa0401512 | Cervix | CC | Rap1 signaling pathway | 56/1267 | 210/8465 | 6.23e-06 | 5.61e-05 | 3.32e-05 | 56 |
| Page: 1 2 3 4 5 6 7 8 9 10 11 12 13 14 15 16 17 18 19 20 21 22 23 24 25 26 27 28 29 30 31 32 33 34 35 36 37 |
Top |
Cell-cell communication analysis |
| Identification of potential cell-cell interactions between two cell types and their ligand-receptor pairs for different disease states |
| Ligand | Receptor | LRpair | Pathway | Tissue | Disease Stage |
| Page: 1 |
Top |
Single-cell gene regulatory network inference analysis |
| Find out the significant the regulons (TFs) and the target genes of each regulon across cell types for different disease states |
| TF | Cell Type | Tissue | Disease Stage | Target Gene | RSS | Regulon Activity |
| ∗The dot plots of a searched regulon are shown for all cell subpopulations in each disease state of each tissue based on the regulon specific score inferred using pySCENIC and by calculating the average expression. |
| Page: 1 |
Top |
Somatic mutation of malignant transformation related genes |
| Annotation of somatic variants for genes involved in malignant transformation |
| Hugo Symbol | Variant Class | Variant Classification | dbSNP RS | HGVSc | HGVSp | HGVSp Short | SWISSPROT | BIOTYPE | SIFT | PolyPhen | Tumor Sample Barcode | Tissue | Histology | Sex | Age | Stage | Therapy Types | Drugs | Outcome |
| MAPK14 | SNV | Missense_Mutation | novel | c.495N>T | p.Lys165Asn | p.K165N | Q16539 | protein_coding | deleterious(0) | probably_damaging(0.96) | TCGA-AR-A0U0-01 | Breast | breast invasive carcinoma | Female | >=65 | I/II | Unknown | Unknown | SD |
| MAPK14 | SNV | Missense_Mutation | rs768171262 | c.472N>A | p.Val158Met | p.V158M | Q16539 | protein_coding | deleterious(0) | probably_damaging(0.987) | TCGA-D8-A27E-01 | Breast | breast invasive carcinoma | Female | >=65 | I/II | Hormone Therapy | tamoxiphen+anastrazolum | SD |
| MAPK14 | SNV | Missense_Mutation | novel | c.847G>A | p.Asp283Asn | p.D283N | Q16539 | protein_coding | tolerated(0.16) | benign(0.332) | TCGA-2W-A8YY-01 | Cervix | cervical & endocervical cancer | Female | <65 | I/II | Chemotherapy | cisplatin | CR |
| MAPK14 | SNV | Missense_Mutation | novel | c.337C>G | p.Leu113Val | p.L113V | Q16539 | protein_coding | deleterious(0.03) | benign(0.357) | TCGA-VS-A9V3-01 | Cervix | cervical & endocervical cancer | Female | <65 | I/II | Chemotherapy | cisplatin | PD |
| MAPK14 | SNV | Missense_Mutation | c.200N>T | p.Arg67Ile | p.R67I | Q16539 | protein_coding | deleterious(0) | probably_damaging(0.995) | TCGA-A6-6141-01 | Colorectum | colon adenocarcinoma | Male | <65 | I/II | Chemotherapy | 5-fu | SD | |
| MAPK14 | SNV | Missense_Mutation | c.265N>A | p.Val89Ile | p.V89I | Q16539 | protein_coding | tolerated(0.28) | benign(0.015) | TCGA-AA-3510-01 | Colorectum | colon adenocarcinoma | Male | >=65 | I/II | Unknown | Unknown | SD | |
| MAPK14 | SNV | Missense_Mutation | c.937N>A | p.Asp313Asn | p.D313N | Q16539 | protein_coding | deleterious(0.01) | possibly_damaging(0.485) | TCGA-AA-3984-01 | Colorectum | colon adenocarcinoma | Female | <65 | I/II | Unknown | Unknown | SD | |
| MAPK14 | SNV | Missense_Mutation | c.403C>A | p.Leu135Ile | p.L135I | Q16539 | protein_coding | deleterious(0) | probably_damaging(0.986) | TCGA-AA-A00N-01 | Colorectum | colon adenocarcinoma | Male | >=65 | I/II | Unknown | Unknown | PD | |
| MAPK14 | SNV | Missense_Mutation | c.430N>A | p.Ala144Thr | p.A144T | Q16539 | protein_coding | deleterious(0) | probably_damaging(0.964) | TCGA-AA-A010-01 | Colorectum | colon adenocarcinoma | Female | <65 | I/II | Chemotherapy | folinic | CR | |
| MAPK14 | SNV | Missense_Mutation | novel | c.244N>C | p.Asn82His | p.N82H | Q16539 | protein_coding | deleterious(0) | probably_damaging(0.998) | TCGA-CA-6717-01 | Colorectum | colon adenocarcinoma | Male | <65 | I/II | Chemotherapy | oxaliplatin | CR |
| Page: 1 2 3 4 |
Top |
Related drugs of malignant transformation related genes |
| Identification of chemicals and drugs interact with genes involved in malignant transfromation |
| (DGIdb 4.0) |
| Entrez ID | Symbol | Category | Interaction Types | Drug Claim Name | Drug Name | PMIDs |
| 1432 | MAPK14 | TRANSCRIPTION FACTOR, KINASE, SERINE THREONINE KINASE, DRUGGABLE GENOME, ENZYME | SORAFENIB | SORAFENIB | ||
| 1432 | MAPK14 | TRANSCRIPTION FACTOR, KINASE, SERINE THREONINE KINASE, DRUGGABLE GENOME, ENZYME | inhibitor | CHEMBL585902 | AMG-548 | |
| 1432 | MAPK14 | TRANSCRIPTION FACTOR, KINASE, SERINE THREONINE KINASE, DRUGGABLE GENOME, ENZYME | inhibitor | CHEMBL3544930 | SC-80036 | |
| 1432 | MAPK14 | TRANSCRIPTION FACTOR, KINASE, SERINE THREONINE KINASE, DRUGGABLE GENOME, ENZYME | GEFITINIB | GEFITINIB | ||
| 1432 | MAPK14 | TRANSCRIPTION FACTOR, KINASE, SERINE THREONINE KINASE, DRUGGABLE GENOME, ENZYME | RHAMNETIN | RHAMNETIN | 24397781 | |
| 1432 | MAPK14 | TRANSCRIPTION FACTOR, KINASE, SERINE THREONINE KINASE, DRUGGABLE GENOME, ENZYME | OPHIOBOLIN O | OPHIOBOLIN O | 22130129 | |
| 1432 | MAPK14 | TRANSCRIPTION FACTOR, KINASE, SERINE THREONINE KINASE, DRUGGABLE GENOME, ENZYME | inhibitor | CHEMBL2107779 | SEMAPIMOD | |
| 1432 | MAPK14 | TRANSCRIPTION FACTOR, KINASE, SERINE THREONINE KINASE, DRUGGABLE GENOME, ENZYME | inhibitor | 249565642 | RALIMETINIB | |
| 1432 | MAPK14 | TRANSCRIPTION FACTOR, KINASE, SERINE THREONINE KINASE, DRUGGABLE GENOME, ENZYME | inhibitor | CHEMBL1766582 | R-1487 | |
| 1432 | MAPK14 | TRANSCRIPTION FACTOR, KINASE, SERINE THREONINE KINASE, DRUGGABLE GENOME, ENZYME | OSI-632 | OSI-632 |
| Page: 1 2 3 4 5 6 7 8 9 10 11 12 13 14 |

Copyright 2023-Present -The University of Texas Health Science Center at Houston |