
|
|||||
|
 | |
| |
| |
| |
| |
| |
|
Gene: MAP9 |
Gene summary for MAP9 |
| Gene information | Species | Human | Gene symbol | MAP9 | Gene ID | 79884 |
| Gene name | microtubule associated protein 9 | |
| Gene Alias | ASAP | |
| Cytomap | 4q32.1 | |
| Gene Type | protein-coding | GO ID | GO:0000226 | UniProtAcc | Q05CN5 |
Top |
Malignant transformation analysis |
| Identification of the aberrant gene expression in precancerous and cancerous lesions by comparing the gene expression of stem-like cells in diseased tissues with normal stem cells |
| Entrez ID | Symbol | Replicates | Species | Organ | Tissue | Adj P-value | Log2FC | Malignancy |
| 79884 | MAP9 | LZE4T | Human | Esophagus | ESCC | 3.55e-04 | 1.65e-01 | 0.0811 |
| 79884 | MAP9 | P2T-E | Human | Esophagus | ESCC | 4.61e-36 | 7.01e-01 | 0.1177 |
| 79884 | MAP9 | P9T-E | Human | Esophagus | ESCC | 2.32e-03 | 9.82e-02 | 0.1131 |
| 79884 | MAP9 | P10T-E | Human | Esophagus | ESCC | 3.02e-14 | 2.66e-01 | 0.116 |
| 79884 | MAP9 | P11T-E | Human | Esophagus | ESCC | 4.43e-08 | 2.98e-01 | 0.1426 |
| 79884 | MAP9 | P12T-E | Human | Esophagus | ESCC | 2.21e-03 | 1.06e-01 | 0.1122 |
| 79884 | MAP9 | P16T-E | Human | Esophagus | ESCC | 2.47e-28 | 5.97e-01 | 0.1153 |
| 79884 | MAP9 | P22T-E | Human | Esophagus | ESCC | 3.91e-40 | 7.17e-01 | 0.1236 |
| 79884 | MAP9 | P23T-E | Human | Esophagus | ESCC | 1.60e-06 | 1.48e-01 | 0.108 |
| 79884 | MAP9 | P24T-E | Human | Esophagus | ESCC | 2.87e-02 | 6.17e-02 | 0.1287 |
| 79884 | MAP9 | P27T-E | Human | Esophagus | ESCC | 3.49e-10 | 1.95e-01 | 0.1055 |
| 79884 | MAP9 | P36T-E | Human | Esophagus | ESCC | 9.90e-06 | 1.99e-01 | 0.1187 |
| 79884 | MAP9 | P47T-E | Human | Esophagus | ESCC | 1.26e-03 | 9.91e-02 | 0.1067 |
| 79884 | MAP9 | P49T-E | Human | Esophagus | ESCC | 4.52e-04 | 5.08e-01 | 0.1768 |
| 79884 | MAP9 | P52T-E | Human | Esophagus | ESCC | 2.35e-06 | 1.00e-01 | 0.1555 |
| 79884 | MAP9 | P56T-E | Human | Esophagus | ESCC | 2.27e-10 | 1.02e+00 | 0.1613 |
| 79884 | MAP9 | P57T-E | Human | Esophagus | ESCC | 6.53e-09 | 1.67e-01 | 0.0926 |
| 79884 | MAP9 | P61T-E | Human | Esophagus | ESCC | 3.61e-04 | 1.18e-01 | 0.099 |
| 79884 | MAP9 | P74T-E | Human | Esophagus | ESCC | 3.18e-17 | 4.94e-01 | 0.1479 |
| 79884 | MAP9 | P75T-E | Human | Esophagus | ESCC | 8.29e-06 | 1.05e-01 | 0.1125 |
| Page: 1 2 3 |
| Tissue | Expression Dynamics | Abbreviation |
| Esophagus | 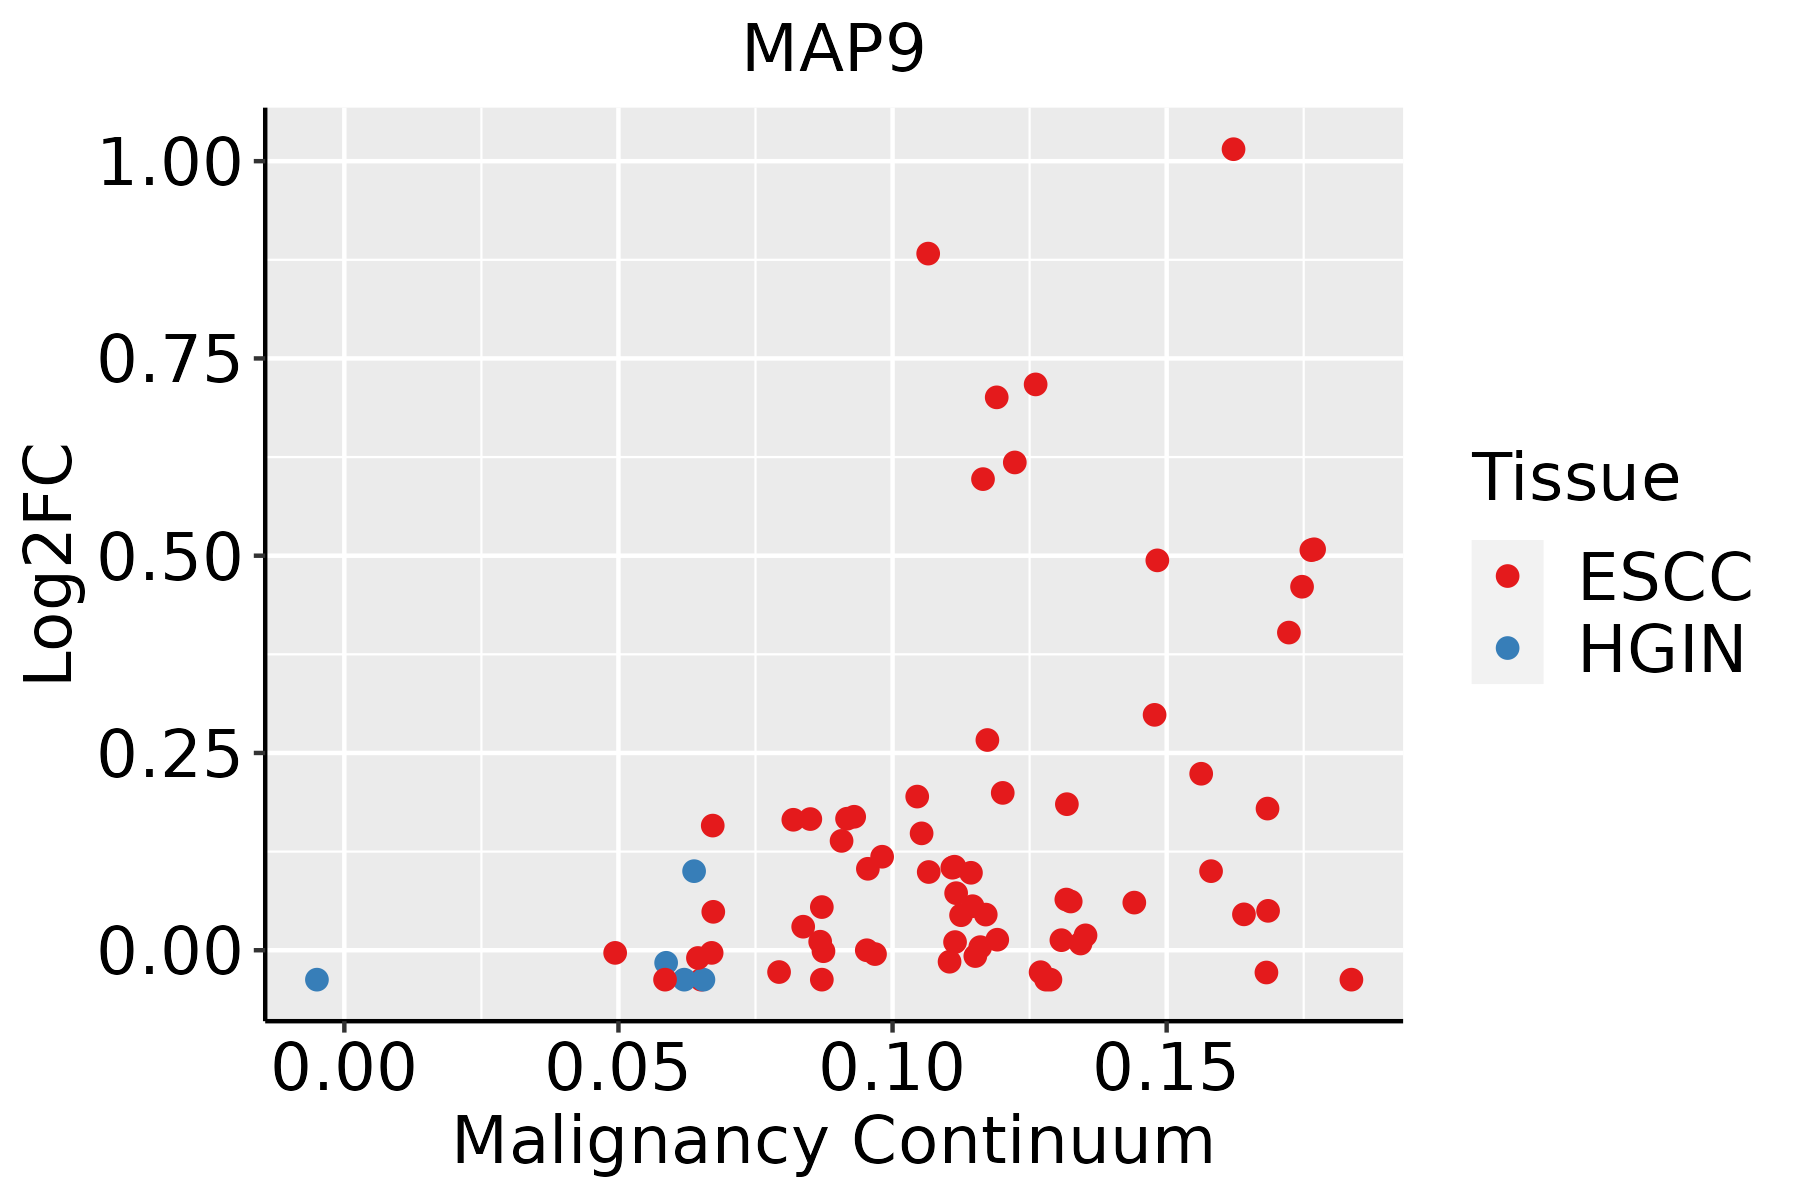 | ESCC: Esophageal squamous cell carcinoma |
| HGIN: High-grade intraepithelial neoplasias | ||
| LGIN: Low-grade intraepithelial neoplasias | ||
| Oral Cavity | 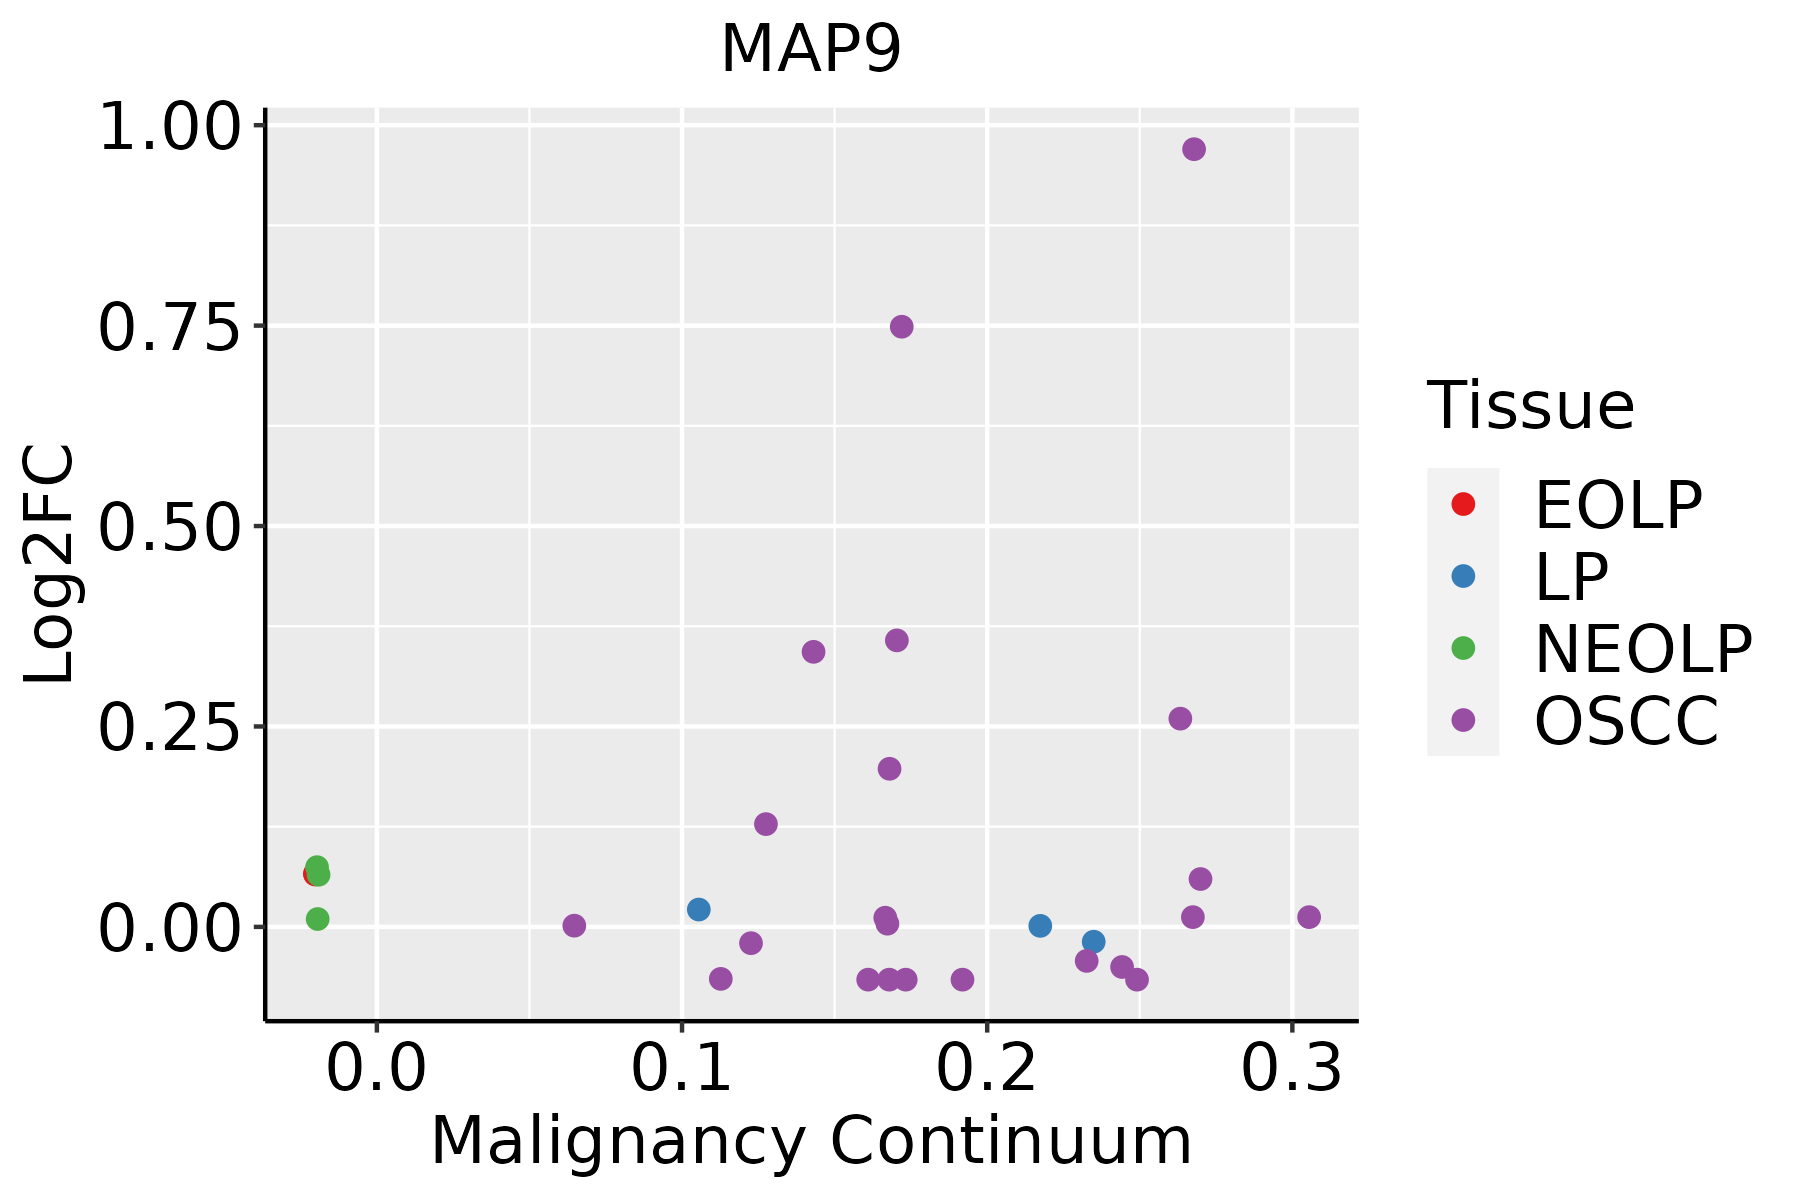 | EOLP: Erosive Oral lichen planus |
| LP: leukoplakia | ||
| NEOLP: Non-erosive oral lichen planus | ||
| OSCC: Oral squamous cell carcinoma | ||
| Thyroid |  | ATC: Anaplastic thyroid cancer |
| HT: Hashimoto's thyroiditis | ||
| PTC: Papillary thyroid cancer |
| ∗log2FC in expression of this searched gene in stem-like cells from each diseased tissue sample relative to stem-like cells in normal samples in each tissue plotted against the malignancy continuum. Samples are colored based on if they are from different disease stage. |
Top |
Malignant transformation related pathway analysis |
| Find out the enriched GO biological processes and KEGG pathways involved in transition from healthy to precancer to cancer |
| Tissue | Disease Stage | Enriched GO biological Processes |
| Colorectum | AD |  |
| Colorectum | SER |  |
| Colorectum | MSS |  |
| Colorectum | MSI-H |  |
| Colorectum | FAP |  |
| ∗Top 15 enriched GO BP terms are showed in the bar plot of each disease state in each tissue. Each row represents a significant GO biological process which is colored according to the -log10(p.adjust). |
| Page: 1 2 3 4 5 6 7 8 9 |
| GO ID | Tissue | Disease Stage | Description | Gene Ratio | Bg Ratio | pvalue | p.adjust | Count |
| GO:014001414 | Esophagus | ESCC | mitotic nuclear division | 218/8552 | 287/18723 | 6.17e-26 | 1.78e-23 | 218 |
| GO:190285015 | Esophagus | ESCC | microtubule cytoskeleton organization involved in mitosis | 116/8552 | 147/18723 | 1.25e-16 | 9.91e-15 | 116 |
| GO:000705214 | Esophagus | ESCC | mitotic spindle organization | 97/8552 | 120/18723 | 2.17e-15 | 1.33e-13 | 97 |
| GO:000705114 | Esophagus | ESCC | spindle organization | 134/8552 | 184/18723 | 5.70e-14 | 2.87e-12 | 134 |
| GO:00482853 | Esophagus | ESCC | organelle fission | 301/8552 | 488/18723 | 4.64e-13 | 2.12e-11 | 301 |
| GO:00002802 | Esophagus | ESCC | nuclear division | 270/8552 | 439/18723 | 1.17e-11 | 4.24e-10 | 270 |
| GO:000028115 | Esophagus | ESCC | mitotic cytokinesis | 58/8552 | 71/18723 | 4.34e-10 | 1.15e-08 | 58 |
| GO:00512256 | Esophagus | ESCC | spindle assembly | 85/8552 | 117/18723 | 2.72e-09 | 5.98e-08 | 85 |
| GO:009030715 | Esophagus | ESCC | mitotic spindle assembly | 52/8552 | 65/18723 | 1.41e-08 | 2.77e-07 | 52 |
| GO:000091016 | Esophagus | ESCC | cytokinesis | 115/8552 | 173/18723 | 2.48e-08 | 4.68e-07 | 115 |
| GO:006164015 | Esophagus | ESCC | cytoskeleton-dependent cytokinesis | 72/8552 | 100/18723 | 8.10e-08 | 1.39e-06 | 72 |
| GO:00705078 | Esophagus | ESCC | regulation of microtubule cytoskeleton organization | 99/8552 | 148/18723 | 1.43e-07 | 2.29e-06 | 99 |
| GO:009022413 | Esophagus | ESCC | regulation of spindle organization | 32/8552 | 39/18723 | 3.27e-06 | 3.65e-05 | 32 |
| GO:00070982 | Esophagus | ESCC | centrosome cycle | 85/8552 | 130/18723 | 4.41e-06 | 4.69e-05 | 85 |
| GO:00310233 | Esophagus | ESCC | microtubule organizing center organization | 92/8552 | 143/18723 | 5.04e-06 | 5.31e-05 | 92 |
| GO:006023614 | Esophagus | ESCC | regulation of mitotic spindle organization | 29/8552 | 35/18723 | 6.61e-06 | 6.75e-05 | 29 |
| GO:00328864 | Esophagus | ESCC | regulation of microtubule-based process | 134/8552 | 240/18723 | 9.44e-04 | 4.80e-03 | 134 |
| GO:00324653 | Esophagus | ESCC | regulation of cytokinesis | 57/8552 | 92/18723 | 1.20e-03 | 5.88e-03 | 57 |
| GO:0007100 | Esophagus | ESCC | mitotic centrosome separation | 12/8552 | 14/18723 | 2.51e-03 | 1.08e-02 | 12 |
| GO:0051299 | Esophagus | ESCC | centrosome separation | 12/8552 | 15/18723 | 7.31e-03 | 2.63e-02 | 12 |
| Page: 1 2 3 4 |
| Pathway ID | Tissue | Disease Stage | Description | Gene Ratio | Bg Ratio | pvalue | p.adjust | qvalue | Count |
| Page: 1 |
Top |
Cell-cell communication analysis |
| Identification of potential cell-cell interactions between two cell types and their ligand-receptor pairs for different disease states |
| Ligand | Receptor | LRpair | Pathway | Tissue | Disease Stage |
| Page: 1 |
Top |
Single-cell gene regulatory network inference analysis |
| Find out the significant the regulons (TFs) and the target genes of each regulon across cell types for different disease states |
| TF | Cell Type | Tissue | Disease Stage | Target Gene | RSS | Regulon Activity |
| ∗The dot plots of a searched regulon are shown for all cell subpopulations in each disease state of each tissue based on the regulon specific score inferred using pySCENIC and by calculating the average expression. |
| Page: 1 |
Top |
Somatic mutation of malignant transformation related genes |
| Annotation of somatic variants for genes involved in malignant transformation |
| Hugo Symbol | Variant Class | Variant Classification | dbSNP RS | HGVSc | HGVSp | HGVSp Short | SWISSPROT | BIOTYPE | SIFT | PolyPhen | Tumor Sample Barcode | Tissue | Histology | Sex | Age | Stage | Therapy Types | Drugs | Outcome |
| MAP9 | SNV | Missense_Mutation | novel | c.1494G>T | p.Lys498Asn | p.K498N | Q49MG5 | protein_coding | deleterious(0.02) | possibly_damaging(0.451) | TCGA-AN-A046-01 | Breast | breast invasive carcinoma | Female | >=65 | I/II | Unknown | Unknown | SD |
| MAP9 | SNV | Missense_Mutation | novel | c.1300G>A | p.Glu434Lys | p.E434K | Q49MG5 | protein_coding | tolerated(0.1) | benign(0.225) | TCGA-AR-A2LE-01 | Breast | breast invasive carcinoma | Female | >=65 | I/II | Hormone Therapy | tamoxiphen | PD |
| MAP9 | SNV | Missense_Mutation | novel | c.626N>G | p.Ser209Cys | p.S209C | Q49MG5 | protein_coding | deleterious(0.02) | probably_damaging(0.911) | TCGA-BH-A5J0-01 | Breast | breast invasive carcinoma | Female | <65 | I/II | Unknown | Unknown | SD |
| MAP9 | SNV | Missense_Mutation | c.1039G>A | p.Ala347Thr | p.A347T | Q49MG5 | protein_coding | tolerated(0.36) | benign(0.099) | TCGA-D8-A1JA-01 | Breast | breast invasive carcinoma | Female | <65 | III/IV | Chemotherapy | adriamycin | PD | |
| MAP9 | SNV | Missense_Mutation | novel | c.1888G>A | p.Glu630Lys | p.E630K | Q49MG5 | protein_coding | deleterious(0.03) | benign(0.164) | TCGA-C5-A902-01 | Cervix | cervical & endocervical cancer | Female | <65 | I/II | Chemotherapy | cisplatin | SD |
| MAP9 | SNV | Missense_Mutation | c.1212A>C | p.Lys404Asn | p.K404N | Q49MG5 | protein_coding | deleterious(0) | possibly_damaging(0.849) | TCGA-EA-A43B-01 | Cervix | cervical & endocervical cancer | Female | <65 | I/II | Chemotherapy | cisplatin | CR | |
| MAP9 | SNV | Missense_Mutation | c.104N>A | p.Arg35His | p.R35H | Q49MG5 | protein_coding | tolerated(0.06) | probably_damaging(0.998) | TCGA-FU-A3HZ-01 | Cervix | cervical & endocervical cancer | Female | <65 | I/II | Chemotherapy | cisplatin | CR | |
| MAP9 | SNV | Missense_Mutation | c.779N>T | p.Ser260Phe | p.S260F | Q49MG5 | protein_coding | tolerated(0.08) | probably_damaging(0.912) | TCGA-Q1-A73P-01 | Cervix | cervical & endocervical cancer | Female | <65 | I/II | Unknown | Unknown | SD | |
| MAP9 | SNV | Missense_Mutation | c.104G>A | p.Arg35His | p.R35H | Q49MG5 | protein_coding | tolerated(0.06) | probably_damaging(0.998) | TCGA-VS-A9UD-01 | Cervix | cervical & endocervical cancer | Female | >=65 | III/IV | Chemotherapy | cisplatin | CR | |
| MAP9 | SNV | Missense_Mutation | c.1007C>A | p.Ser336Tyr | p.S336Y | Q49MG5 | protein_coding | deleterious(0.01) | possibly_damaging(0.885) | TCGA-A6-6141-01 | Colorectum | colon adenocarcinoma | Male | <65 | I/II | Chemotherapy | 5-fu | SD |
| Page: 1 2 3 4 5 6 7 8 9 10 11 12 13 |
Top |
Related drugs of malignant transformation related genes |
| Identification of chemicals and drugs interact with genes involved in malignant transfromation |
| (DGIdb 4.0) |
| Entrez ID | Symbol | Category | Interaction Types | Drug Claim Name | Drug Name | PMIDs |
| Page: 1 |

Copyright 2023-Present -The University of Texas Health Science Center at Houston |