
|
|||||
|
 | |
| |
| |
| |
| |
| |
|
Gene: MAP7D3 |
Gene summary for MAP7D3 |
| Gene information | Species | Human | Gene symbol | MAP7D3 | Gene ID | 79649 |
| Gene name | MAP7 domain containing 3 | |
| Gene Alias | MDP3 | |
| Cytomap | Xq26.3 | |
| Gene Type | protein-coding | GO ID | GO:0000226 | UniProtAcc | Q8IWC1 |
Top |
Malignant transformation analysis |
| Identification of the aberrant gene expression in precancerous and cancerous lesions by comparing the gene expression of stem-like cells in diseased tissues with normal stem cells |
| Entrez ID | Symbol | Replicates | Species | Organ | Tissue | Adj P-value | Log2FC | Malignancy |
| 79649 | MAP7D3 | LZE4T | Human | Esophagus | ESCC | 1.63e-10 | 2.44e-01 | 0.0811 |
| 79649 | MAP7D3 | LZE7T | Human | Esophagus | ESCC | 1.67e-02 | 2.30e-01 | 0.0667 |
| 79649 | MAP7D3 | LZE24T | Human | Esophagus | ESCC | 7.57e-15 | 2.36e-01 | 0.0596 |
| 79649 | MAP7D3 | P1T-E | Human | Esophagus | ESCC | 3.21e-03 | 1.67e-01 | 0.0875 |
| 79649 | MAP7D3 | P2T-E | Human | Esophagus | ESCC | 3.18e-17 | 3.00e-01 | 0.1177 |
| 79649 | MAP7D3 | P4T-E | Human | Esophagus | ESCC | 3.68e-12 | 1.99e-01 | 0.1323 |
| 79649 | MAP7D3 | P5T-E | Human | Esophagus | ESCC | 9.09e-14 | 2.52e-01 | 0.1327 |
| 79649 | MAP7D3 | P8T-E | Human | Esophagus | ESCC | 3.10e-11 | 1.39e-01 | 0.0889 |
| 79649 | MAP7D3 | P9T-E | Human | Esophagus | ESCC | 4.01e-17 | 4.59e-01 | 0.1131 |
| 79649 | MAP7D3 | P10T-E | Human | Esophagus | ESCC | 6.66e-33 | 5.63e-01 | 0.116 |
| 79649 | MAP7D3 | P11T-E | Human | Esophagus | ESCC | 1.89e-02 | 2.16e-01 | 0.1426 |
| 79649 | MAP7D3 | P12T-E | Human | Esophagus | ESCC | 1.20e-12 | 2.99e-01 | 0.1122 |
| 79649 | MAP7D3 | P15T-E | Human | Esophagus | ESCC | 2.61e-09 | 1.78e-01 | 0.1149 |
| 79649 | MAP7D3 | P16T-E | Human | Esophagus | ESCC | 1.24e-18 | 1.09e-01 | 0.1153 |
| 79649 | MAP7D3 | P17T-E | Human | Esophagus | ESCC | 1.49e-02 | 2.33e-01 | 0.1278 |
| 79649 | MAP7D3 | P20T-E | Human | Esophagus | ESCC | 2.61e-10 | 1.72e-01 | 0.1124 |
| 79649 | MAP7D3 | P21T-E | Human | Esophagus | ESCC | 1.11e-19 | 3.85e-01 | 0.1617 |
| 79649 | MAP7D3 | P22T-E | Human | Esophagus | ESCC | 2.08e-17 | 2.55e-01 | 0.1236 |
| 79649 | MAP7D3 | P23T-E | Human | Esophagus | ESCC | 3.04e-09 | 3.27e-01 | 0.108 |
| 79649 | MAP7D3 | P24T-E | Human | Esophagus | ESCC | 2.42e-16 | 2.46e-01 | 0.1287 |
| Page: 1 2 3 4 5 |
| Tissue | Expression Dynamics | Abbreviation |
| Esophagus | 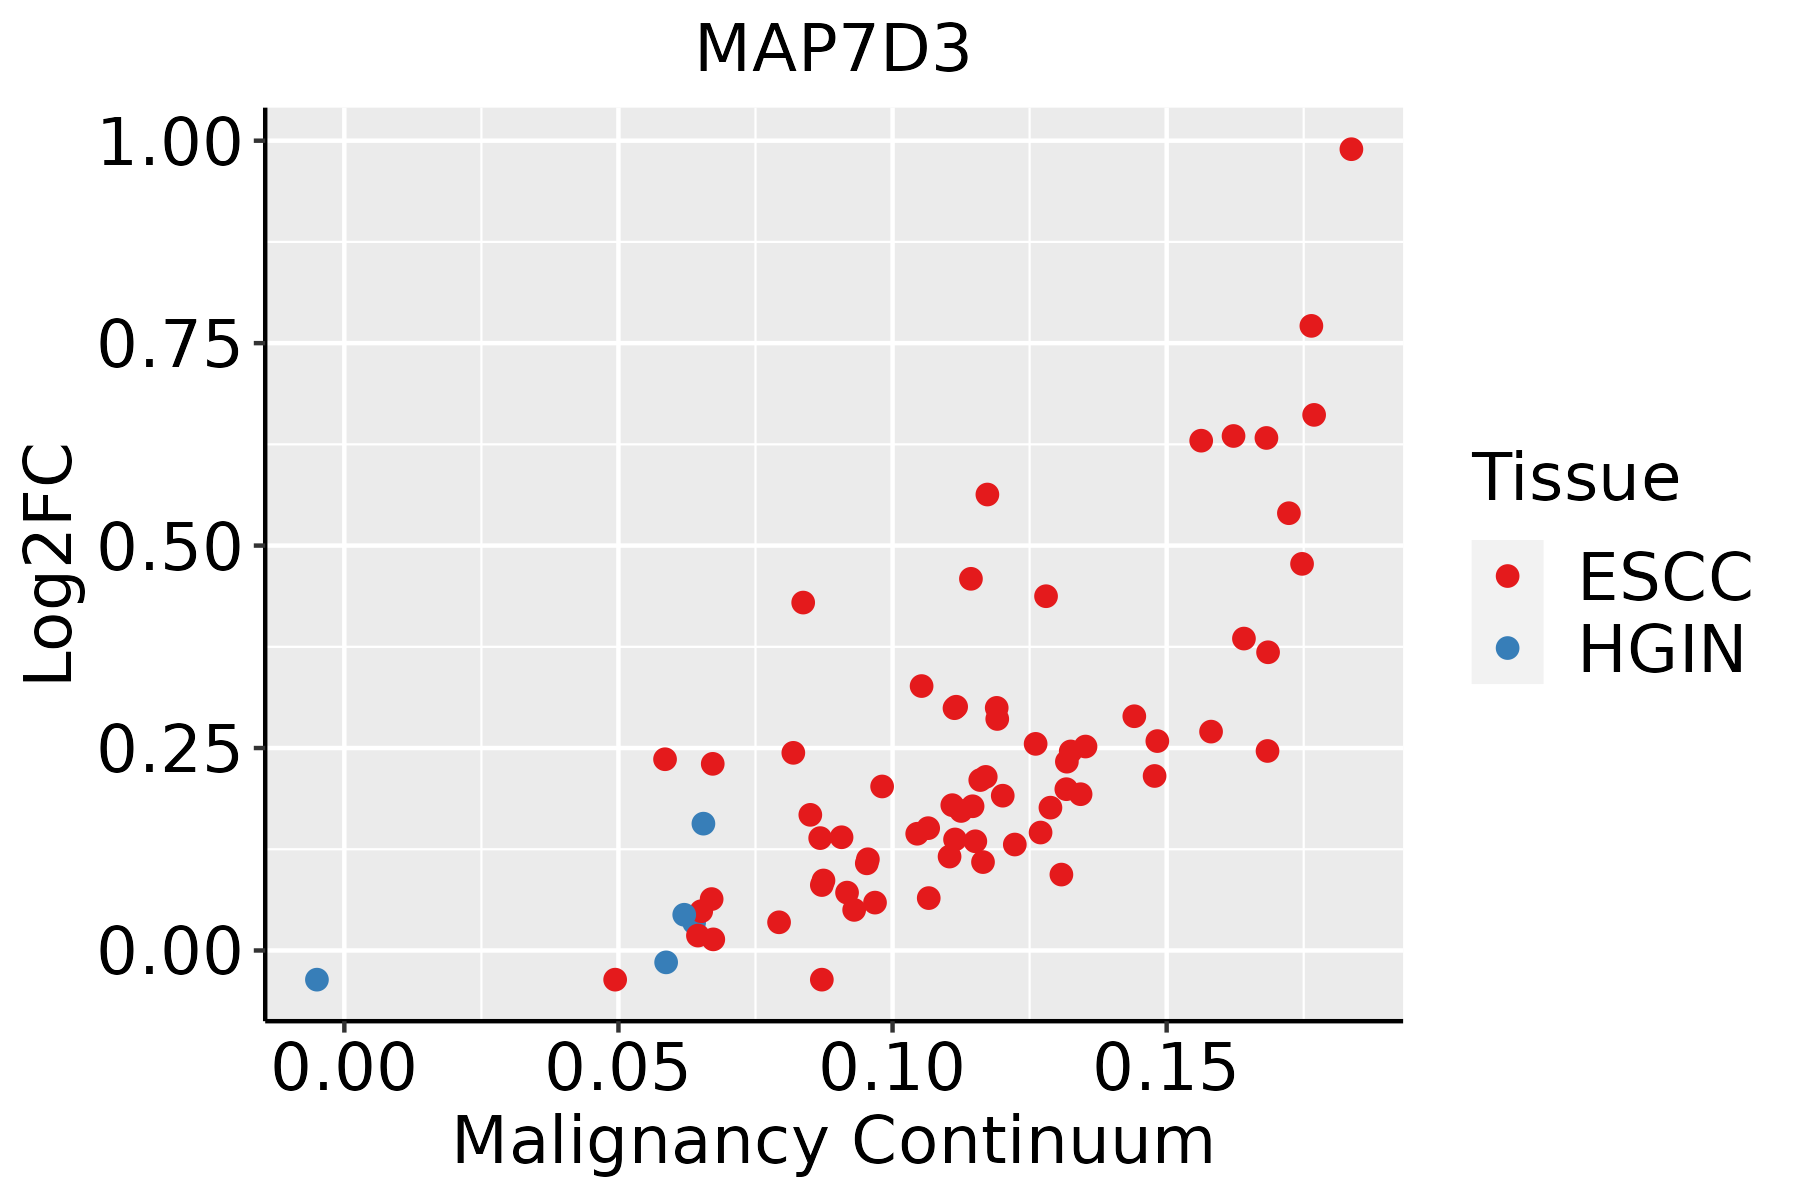 | ESCC: Esophageal squamous cell carcinoma |
| HGIN: High-grade intraepithelial neoplasias | ||
| LGIN: Low-grade intraepithelial neoplasias | ||
| Liver | 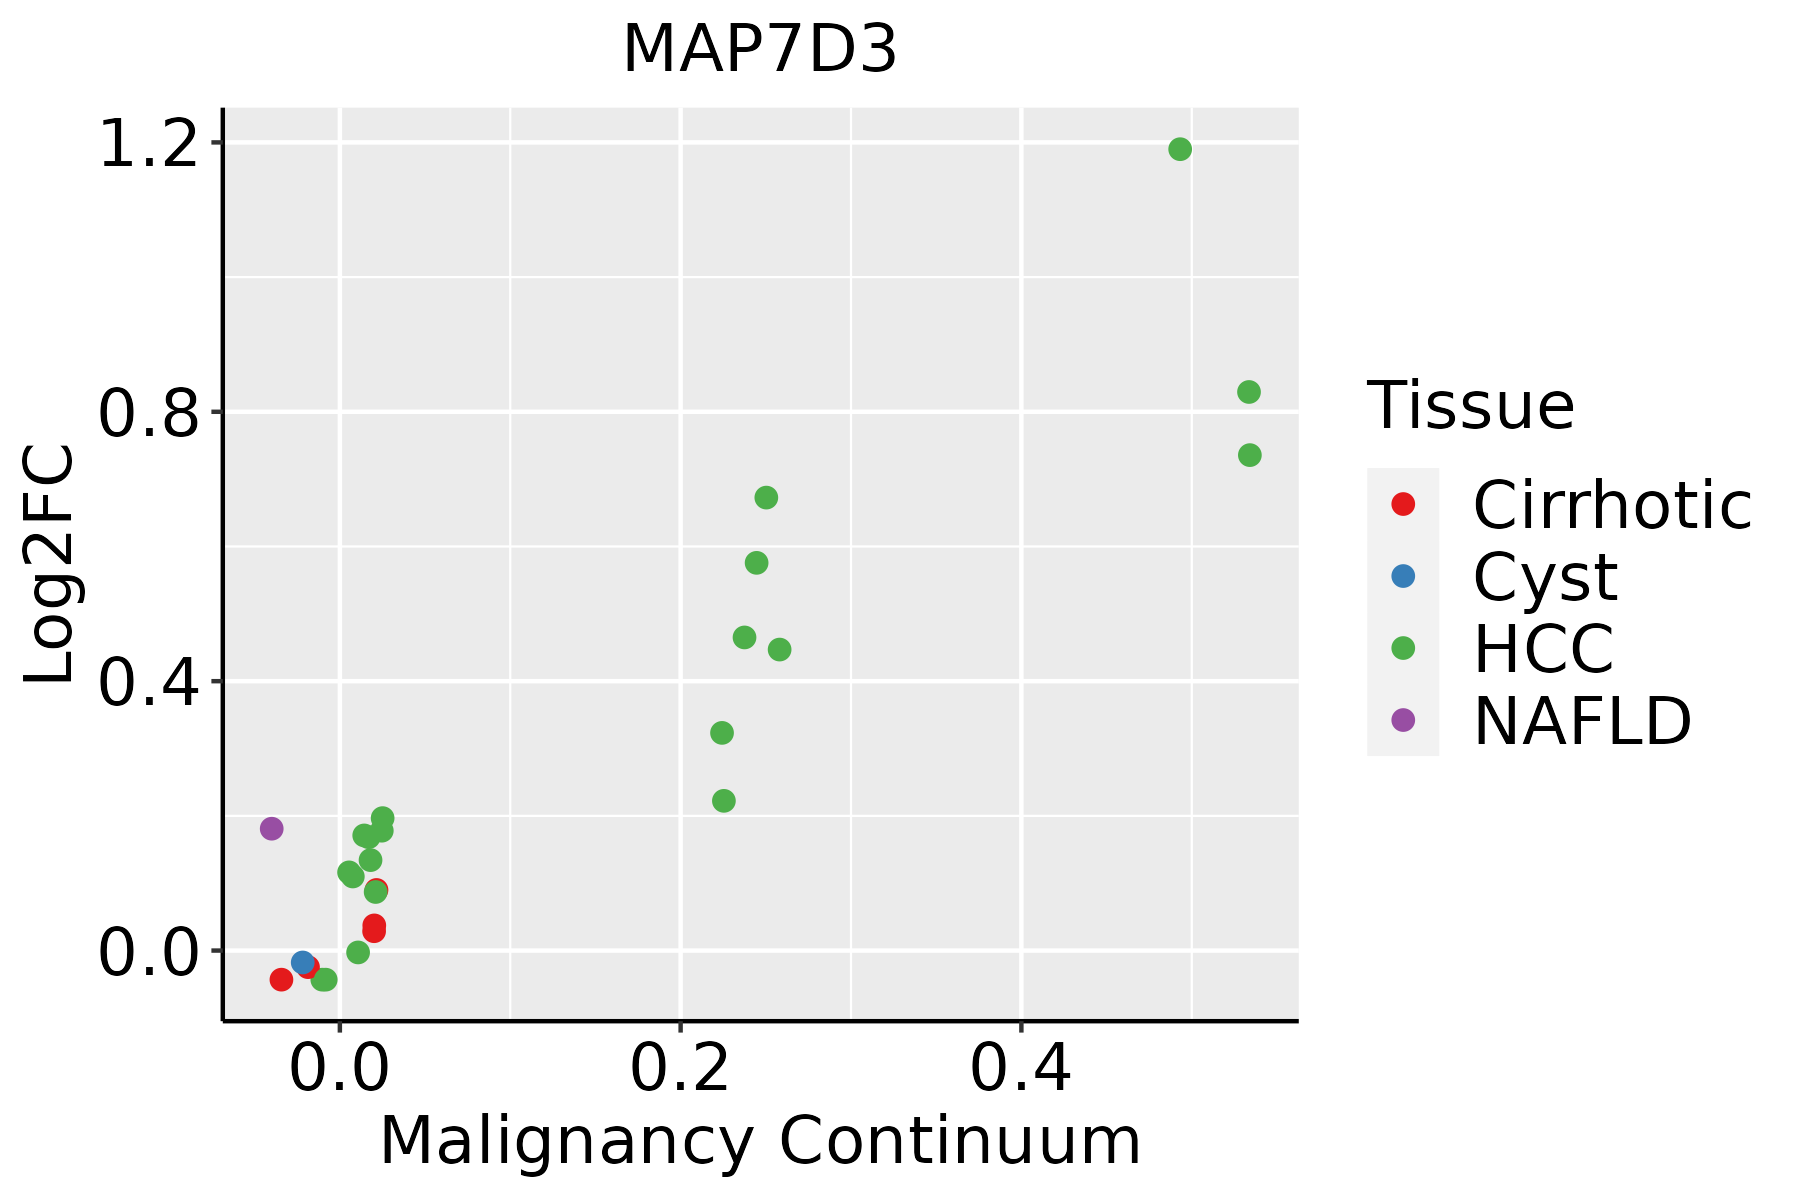 | HCC: Hepatocellular carcinoma |
| NAFLD: Non-alcoholic fatty liver disease | ||
| Oral Cavity |  | EOLP: Erosive Oral lichen planus |
| LP: leukoplakia | ||
| NEOLP: Non-erosive oral lichen planus | ||
| OSCC: Oral squamous cell carcinoma | ||
| Thyroid |  | ATC: Anaplastic thyroid cancer |
| HT: Hashimoto's thyroiditis | ||
| PTC: Papillary thyroid cancer |
| ∗log2FC in expression of this searched gene in stem-like cells from each diseased tissue sample relative to stem-like cells in normal samples in each tissue plotted against the malignancy continuum. Samples are colored based on if they are from different disease stage. |
Top |
Malignant transformation related pathway analysis |
| Find out the enriched GO biological processes and KEGG pathways involved in transition from healthy to precancer to cancer |
| Tissue | Disease Stage | Enriched GO biological Processes |
| Colorectum | AD |  |
| Colorectum | SER |  |
| Colorectum | MSS |  |
| Colorectum | MSI-H |  |
| Colorectum | FAP |  |
| ∗Top 15 enriched GO BP terms are showed in the bar plot of each disease state in each tissue. Each row represents a significant GO biological process which is colored according to the -log10(p.adjust). |
| Page: 1 2 3 4 5 6 7 8 9 |
| GO ID | Tissue | Disease Stage | Description | Gene Ratio | Bg Ratio | pvalue | p.adjust | Count |
| GO:0051258111 | Esophagus | ESCC | protein polymerization | 183/8552 | 297/18723 | 1.94e-08 | 3.75e-07 | 183 |
| GO:00311094 | Esophagus | ESCC | microtubule polymerization or depolymerization | 77/8552 | 122/18723 | 7.60e-05 | 5.68e-04 | 77 |
| GO:00467856 | Esophagus | ESCC | microtubule polymerization | 55/8552 | 83/18723 | 1.21e-04 | 8.31e-04 | 55 |
| GO:005125822 | Liver | HCC | protein polymerization | 182/7958 | 297/18723 | 4.17e-11 | 1.58e-09 | 182 |
| GO:0046785 | Liver | HCC | microtubule polymerization | 51/7958 | 83/18723 | 3.82e-04 | 2.61e-03 | 51 |
| GO:0031109 | Liver | HCC | microtubule polymerization or depolymerization | 68/7958 | 122/18723 | 2.14e-03 | 1.08e-02 | 68 |
| GO:005125820 | Oral cavity | OSCC | protein polymerization | 169/7305 | 297/18723 | 2.57e-10 | 7.17e-09 | 169 |
| GO:00467855 | Oral cavity | OSCC | microtubule polymerization | 53/7305 | 83/18723 | 3.96e-06 | 4.65e-05 | 53 |
| GO:00311093 | Oral cavity | OSCC | microtubule polymerization or depolymerization | 68/7305 | 122/18723 | 1.29e-04 | 9.21e-04 | 68 |
| GO:005125833 | Oral cavity | NEOLP | protein polymerization | 67/2005 | 297/18723 | 2.27e-09 | 1.40e-07 | 67 |
| GO:004678531 | Oral cavity | NEOLP | microtubule polymerization | 22/2005 | 83/18723 | 4.31e-05 | 6.10e-04 | 22 |
| GO:00311092 | Oral cavity | NEOLP | microtubule polymerization or depolymerization | 26/2005 | 122/18723 | 4.52e-04 | 4.06e-03 | 26 |
| GO:0051258113 | Thyroid | PTC | protein polymerization | 154/5968 | 297/18723 | 5.35e-13 | 2.66e-11 | 154 |
| GO:00467858 | Thyroid | PTC | microtubule polymerization | 43/5968 | 83/18723 | 1.26e-04 | 9.98e-04 | 43 |
| GO:00311096 | Thyroid | PTC | microtubule polymerization or depolymerization | 57/5968 | 122/18723 | 4.19e-04 | 2.81e-03 | 57 |
| GO:005125829 | Thyroid | ATC | protein polymerization | 159/6293 | 297/18723 | 9.33e-13 | 3.96e-11 | 159 |
| GO:004678514 | Thyroid | ATC | microtubule polymerization | 45/6293 | 83/18723 | 8.75e-05 | 6.51e-04 | 45 |
| GO:003110912 | Thyroid | ATC | microtubule polymerization or depolymerization | 61/6293 | 122/18723 | 1.30e-04 | 9.15e-04 | 61 |
| Page: 1 |
| Pathway ID | Tissue | Disease Stage | Description | Gene Ratio | Bg Ratio | pvalue | p.adjust | qvalue | Count |
| Page: 1 |
Top |
Cell-cell communication analysis |
| Identification of potential cell-cell interactions between two cell types and their ligand-receptor pairs for different disease states |
| Ligand | Receptor | LRpair | Pathway | Tissue | Disease Stage |
| Page: 1 |
Top |
Single-cell gene regulatory network inference analysis |
| Find out the significant the regulons (TFs) and the target genes of each regulon across cell types for different disease states |
| TF | Cell Type | Tissue | Disease Stage | Target Gene | RSS | Regulon Activity |
| ∗The dot plots of a searched regulon are shown for all cell subpopulations in each disease state of each tissue based on the regulon specific score inferred using pySCENIC and by calculating the average expression. |
| Page: 1 |
Top |
Somatic mutation of malignant transformation related genes |
| Annotation of somatic variants for genes involved in malignant transformation |
| Hugo Symbol | Variant Class | Variant Classification | dbSNP RS | HGVSc | HGVSp | HGVSp Short | SWISSPROT | BIOTYPE | SIFT | PolyPhen | Tumor Sample Barcode | Tissue | Histology | Sex | Age | Stage | Therapy Types | Drugs | Outcome |
| MAP7D3 | SNV | Missense_Mutation | novel | c.1858G>A | p.Glu620Lys | p.E620K | Q8IWC1 | protein_coding | tolerated(0.07) | probably_damaging(0.996) | TCGA-BH-A0DZ-01 | Breast | breast invasive carcinoma | Female | <65 | I/II | Chemotherapy | docetaxel | SD |
| MAP7D3 | SNV | Missense_Mutation | c.1953A>T | p.Lys651Asn | p.K651N | Q8IWC1 | protein_coding | deleterious(0.02) | probably_damaging(0.958) | TCGA-E2-A10C-01 | Breast | breast invasive carcinoma | Female | <65 | I/II | Chemotherapy | cytoxan | SD | |
| MAP7D3 | SNV | Missense_Mutation | novel | c.1605N>C | p.Gln535His | p.Q535H | Q8IWC1 | protein_coding | tolerated(0.13) | benign(0.001) | TCGA-E9-A5FK-01 | Breast | breast invasive carcinoma | Female | <65 | III/IV | Chemotherapy | cyclophosphamide | CR |
| MAP7D3 | SNV | Missense_Mutation | rs371634445 | c.1819C>T | p.Arg607Cys | p.R607C | Q8IWC1 | protein_coding | deleterious(0) | probably_damaging(0.989) | TCGA-EW-A2FW-01 | Breast | breast invasive carcinoma | Female | <65 | I/II | Hormone Therapy | exemestane | SD |
| MAP7D3 | SNV | Missense_Mutation | novel | c.1868G>T | p.Arg623Leu | p.R623L | Q8IWC1 | protein_coding | deleterious(0.03) | possibly_damaging(0.6) | TCGA-S3-AA17-01 | Breast | breast invasive carcinoma | Female | <65 | I/II | Hormone Therapy | anastrozole | SD |
| MAP7D3 | insertion | Frame_Shift_Ins | novel | c.809_810insCCTGGAAGCACCCCCGGAAGTGAGTCTGGAA | p.Arg270SerfsTer73 | p.R270Sfs*73 | Q8IWC1 | protein_coding | TCGA-A2-A04V-01 | Breast | breast invasive carcinoma | Female | <65 | I/II | Chemotherapy | cytoxan | PD | ||
| MAP7D3 | insertion | Frame_Shift_Ins | novel | c.498_499insAA | p.Gly167LysfsTer31 | p.G167Kfs*31 | Q8IWC1 | protein_coding | TCGA-A8-A07J-01 | Breast | breast invasive carcinoma | Female | <65 | I/II | Chemotherapy | 5-fluorouracil | CR | ||
| MAP7D3 | insertion | Frame_Shift_Ins | novel | c.497_498insTATTTGTTGCTTTTTGTTTCATACCAAACCATTCCTTTACA | p.Trp166CysfsTer45 | p.W166Cfs*45 | Q8IWC1 | protein_coding | TCGA-A8-A07J-01 | Breast | breast invasive carcinoma | Female | <65 | I/II | Chemotherapy | 5-fluorouracil | CR | ||
| MAP7D3 | insertion | Nonsense_Mutation | novel | c.860_861insTCAGGATTTGATCTCTCAGCACCAGAGTGGTATATAAGAACAGATC | p.Glu288GlnfsTer12 | p.E288Qfs*12 | Q8IWC1 | protein_coding | TCGA-BH-A0BM-01 | Breast | breast invasive carcinoma | Female | <65 | I/II | Chemotherapy | adriamycin | SD | ||
| MAP7D3 | insertion | Nonsense_Mutation | novel | c.790_791insATTGCTATTTTGCCTGTTACGTGCATTCTTAATACCCATG | p.Cys264TyrfsTer11 | p.C264Yfs*11 | Q8IWC1 | protein_coding | TCGA-BH-A0HF-01 | Breast | breast invasive carcinoma | Female | >=65 | I/II | Hormone Therapy | arimidex | SD |
| Page: 1 2 3 4 5 6 7 8 9 10 11 12 13 14 15 |
Top |
Related drugs of malignant transformation related genes |
| Identification of chemicals and drugs interact with genes involved in malignant transfromation |
| (DGIdb 4.0) |
| Entrez ID | Symbol | Category | Interaction Types | Drug Claim Name | Drug Name | PMIDs |
| Page: 1 |

Copyright 2023-Present -The University of Texas Health Science Center at Houston |