Schematic overview of the cellular and molecular mechanisms involved in the cancer progression, including the proposed cellular and molecular mechanisms in cancer cells trajectory. AT1: alveolar type 1 cells; AT2: alveolar type 2 cells; AAH: atypical adenomatous hyperplasia; AIS: adenocarcinoma in situ; MIA: minimally invasive adenocarcinoma; IA: invasive adenocarcinoma; EMT: epithelial-mesenchymal transition

Home

Download

Statistics

Help

Contact

Center for Computational Systems Medicine
leaf

Gene summary

leaf

Malignant transformation analysis

leaf

Malignant transformation related pathway analysis

leaf

Cell-cell communication analysis

leaf

Single-cell gene regulatory network inference analysis

leaf

Somatic mutation of malignant transformation related genes

leaf

Related drugs of malignant transformation related genes

Gene: MAP7

Gene summary for MAP7

check button Gene summary.

Gene informationSpeciesHuman
Gene symbol

MAP7

Gene ID

9053

Gene namemicrotubule associated protein 7
Gene AliasE-MAP-115
Cytomap6q23.3
Gene Typeprotein-coding
GO ID

GO:0000226

UniProtAcc

Q14244


Top

Malignant transformation analysis

check button Identification of the aberrant gene expression in precancerous and cancerous lesions by comparing the gene expression of stem-like cells in diseased tissues with normal stem cells
check button Malignant transformation involving gene list.
Entrez IDSymbolReplicatesSpeciesOrganTissueAdj P-valueLog2FCMalignancy
9053MAP7CCI_1HumanCervixCC8.69e-098.41e-010.528
9053MAP7CCI_2HumanCervixCC1.39e-068.50e-010.5249
9053MAP7CCI_3HumanCervixCC5.98e-097.39e-010.516
9053MAP7HTA11_3410_2000001011HumanColorectumAD3.74e-19-6.07e-010.0155
9053MAP7HTA11_2487_2000001011HumanColorectumSER6.99e-06-4.42e-01-0.1808
9053MAP7HTA11_2951_2000001011HumanColorectumAD6.10e-09-9.38e-010.0216
9053MAP7HTA11_347_2000001011HumanColorectumAD8.19e-075.75e-01-0.1954
9053MAP7HTA11_411_2000001011HumanColorectumSER3.50e-046.02e-01-0.2602
9053MAP7HTA11_5212_2000001011HumanColorectumAD1.61e-04-5.34e-01-0.2061
9053MAP7HTA11_5216_2000001011HumanColorectumSER7.98e-07-5.69e-01-0.1462
9053MAP7HTA11_7862_2000001011HumanColorectumAD1.96e-04-3.48e-01-0.0179
9053MAP7HTA11_8622_2000001021HumanColorectumSER2.71e-07-5.09e-010.0528
9053MAP7HTA11_10711_2000001011HumanColorectumAD2.02e-02-4.11e-010.0338
9053MAP7HTA11_7696_3000711011HumanColorectumAD2.53e-06-4.18e-010.0674
9053MAP7HTA11_7469_2000001011HumanColorectumAD2.76e-04-5.58e-01-0.0124
9053MAP7HTA11_99999965062_69753HumanColorectumMSI-H7.74e-138.43e-010.3487
9053MAP7HTA11_99999965104_69814HumanColorectumMSS3.65e-075.57e-010.281
9053MAP7HTA11_99999973899_84307HumanColorectumMSS2.01e-09-6.78e-010.2585
9053MAP7HTA11_99999974143_84620HumanColorectumMSS2.96e-17-5.93e-010.3005
9053MAP7F007HumanColorectumFAP3.14e-03-3.39e-010.1176
Page: 1 2 3 4 5 6 7 8 9 10 

check button Transcriptomic changes along malignancy continuum.
TissueExpression DynamicsAbbreviation
CervixThe image shows the transcriptomic changes along malignancy continuum.log2FC in expression of this searched gene in stem-like cells from each diseased tissue sample relative to stem-like cells in normal samples in each tissue plotted against the malignancy continuum. Samples are colored based on if they are from different disease stage.CC: Cervix cancer
HSIL_HPV: HPV-infected high-grade squamous intraepithelial lesions
N_HPV: HPV-infected normal cervix
Colorectum (GSE201348)The image shows the transcriptomic changes along malignancy continuum.log2FC in expression of this searched gene in stem-like cells from each diseased tissue sample relative to stem-like cells in normal samples in each tissue plotted against the malignancy continuum. Samples are colored based on if they are from different disease stage.FAP: Familial adenomatous polyposis
CRC: Colorectal cancer
Colorectum (HTA11)The image shows the transcriptomic changes along malignancy continuum.log2FC in expression of this searched gene in stem-like cells from each diseased tissue sample relative to stem-like cells in normal samples in each tissue plotted against the malignancy continuum. Samples are colored based on if they are from different disease stage.AD: Adenomas
SER: Sessile serrated lesions
MSI-H: Microsatellite-high colorectal cancer
MSS: Microsatellite stable colorectal cancer
EndometriumThe image shows the transcriptomic changes along malignancy continuum.log2FC in expression of this searched gene in stem-like cells from each diseased tissue sample relative to stem-like cells in normal samples in each tissue plotted against the malignancy continuum. Samples are colored based on if they are from different disease stage.AEH: Atypical endometrial hyperplasia
EEC: Endometrioid Cancer
EsophagusThe image shows the transcriptomic changes along malignancy continuum.log2FC in expression of this searched gene in stem-like cells from each diseased tissue sample relative to stem-like cells in normal samples in each tissue plotted against the malignancy continuum. Samples are colored based on if they are from different disease stage.ESCC: Esophageal squamous cell carcinoma
HGIN: High-grade intraepithelial neoplasias
LGIN: Low-grade intraepithelial neoplasias
LiverThe image shows the transcriptomic changes along malignancy continuum.log2FC in expression of this searched gene in stem-like cells from each diseased tissue sample relative to stem-like cells in normal samples in each tissue plotted against the malignancy continuum. Samples are colored based on if they are from different disease stage.
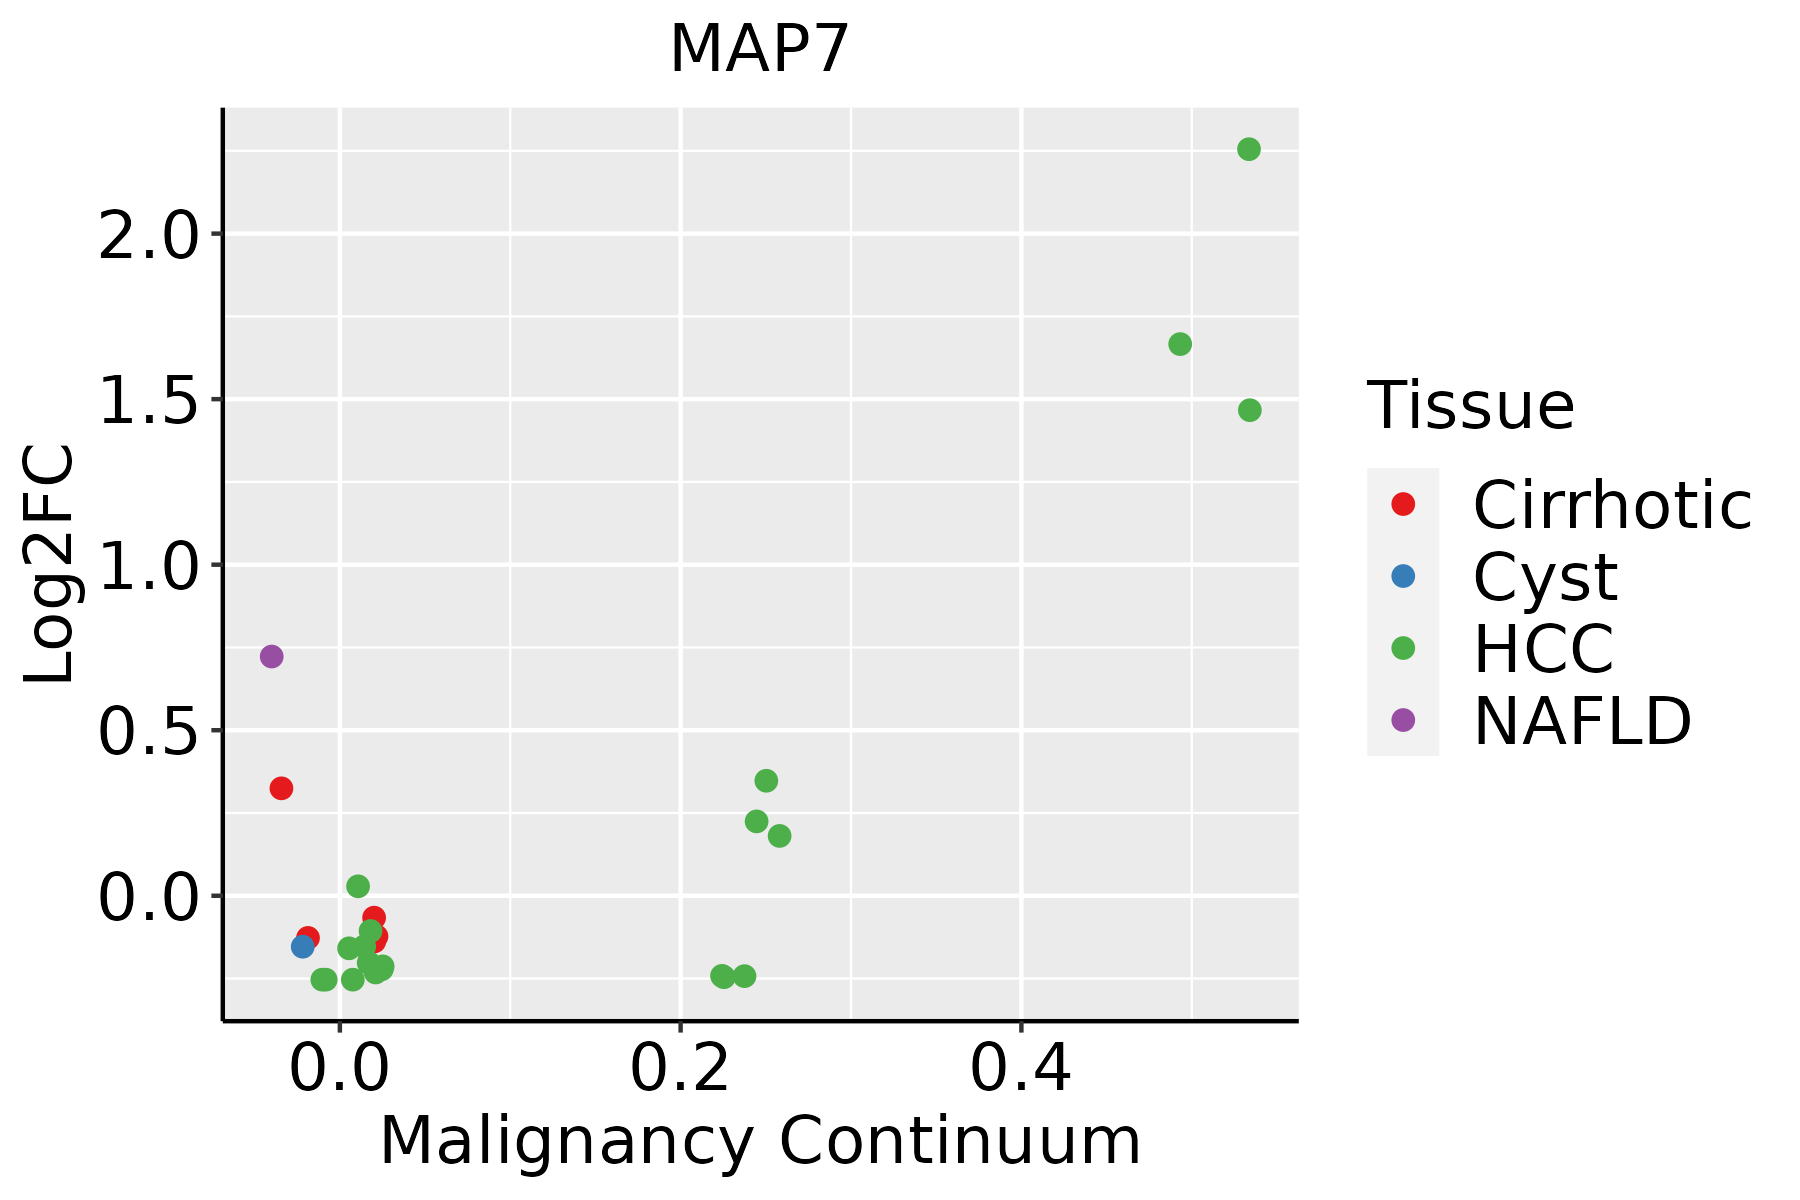
HCC: Hepatocellular carcinoma
NAFLD: Non-alcoholic fatty liver disease
LungThe image shows the transcriptomic changes along malignancy continuum.log2FC in expression of this searched gene in stem-like cells from each diseased tissue sample relative to stem-like cells in normal samples in each tissue plotted against the malignancy continuum. Samples are colored based on if they are from different disease stage.AAH: Atypical adenomatous hyperplasia
AIS: Adenocarcinoma in situ
IAC: Invasive lung adenocarcinoma
MIA: Minimally invasive adenocarcinoma
Oral CavityThe image shows the transcriptomic changes along malignancy continuum.log2FC in expression of this searched gene in stem-like cells from each diseased tissue sample relative to stem-like cells in normal samples in each tissue plotted against the malignancy continuum. Samples are colored based on if they are from different disease stage.
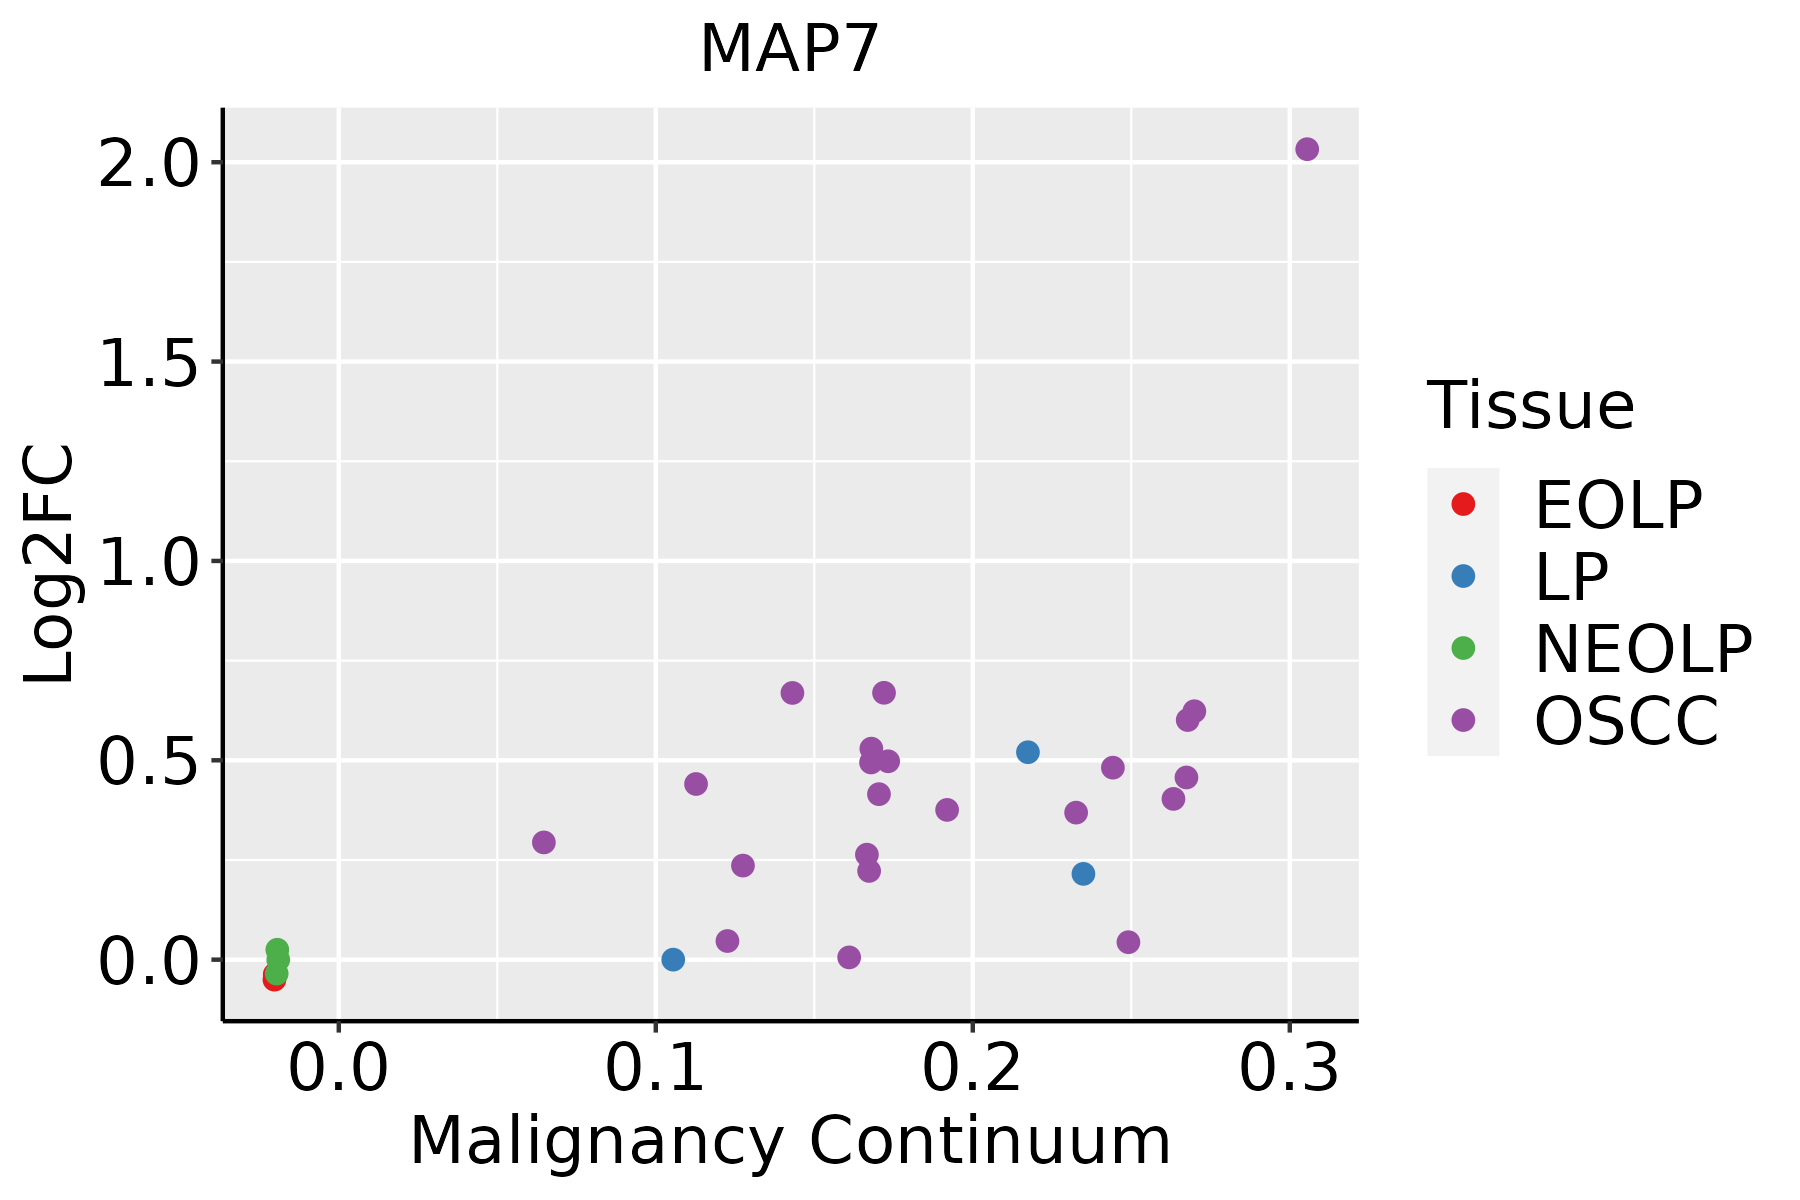
EOLP: Erosive Oral lichen planus
LP: leukoplakia
NEOLP: Non-erosive oral lichen planus
OSCC: Oral squamous cell carcinoma
ProstateThe image shows the transcriptomic changes along malignancy continuum.log2FC in expression of this searched gene in stem-like cells from each diseased tissue sample relative to stem-like cells in normal samples in each tissue plotted against the malignancy continuum. Samples are colored based on if they are from different disease stage.BPH: Benign Prostatic Hyperplasia
SkinThe image shows the transcriptomic changes along malignancy continuum.log2FC in expression of this searched gene in stem-like cells from each diseased tissue sample relative to stem-like cells in normal samples in each tissue plotted against the malignancy continuum. Samples are colored based on if they are from different disease stage.AK: Actinic keratosis
cSCC: Cutaneous squamous cell carcinoma
SCCIS:squamous cell carcinoma in situ
ThyroidThe image shows the transcriptomic changes along malignancy continuum.log2FC in expression of this searched gene in stem-like cells from each diseased tissue sample relative to stem-like cells in normal samples in each tissue plotted against the malignancy continuum. Samples are colored based on if they are from different disease stage.
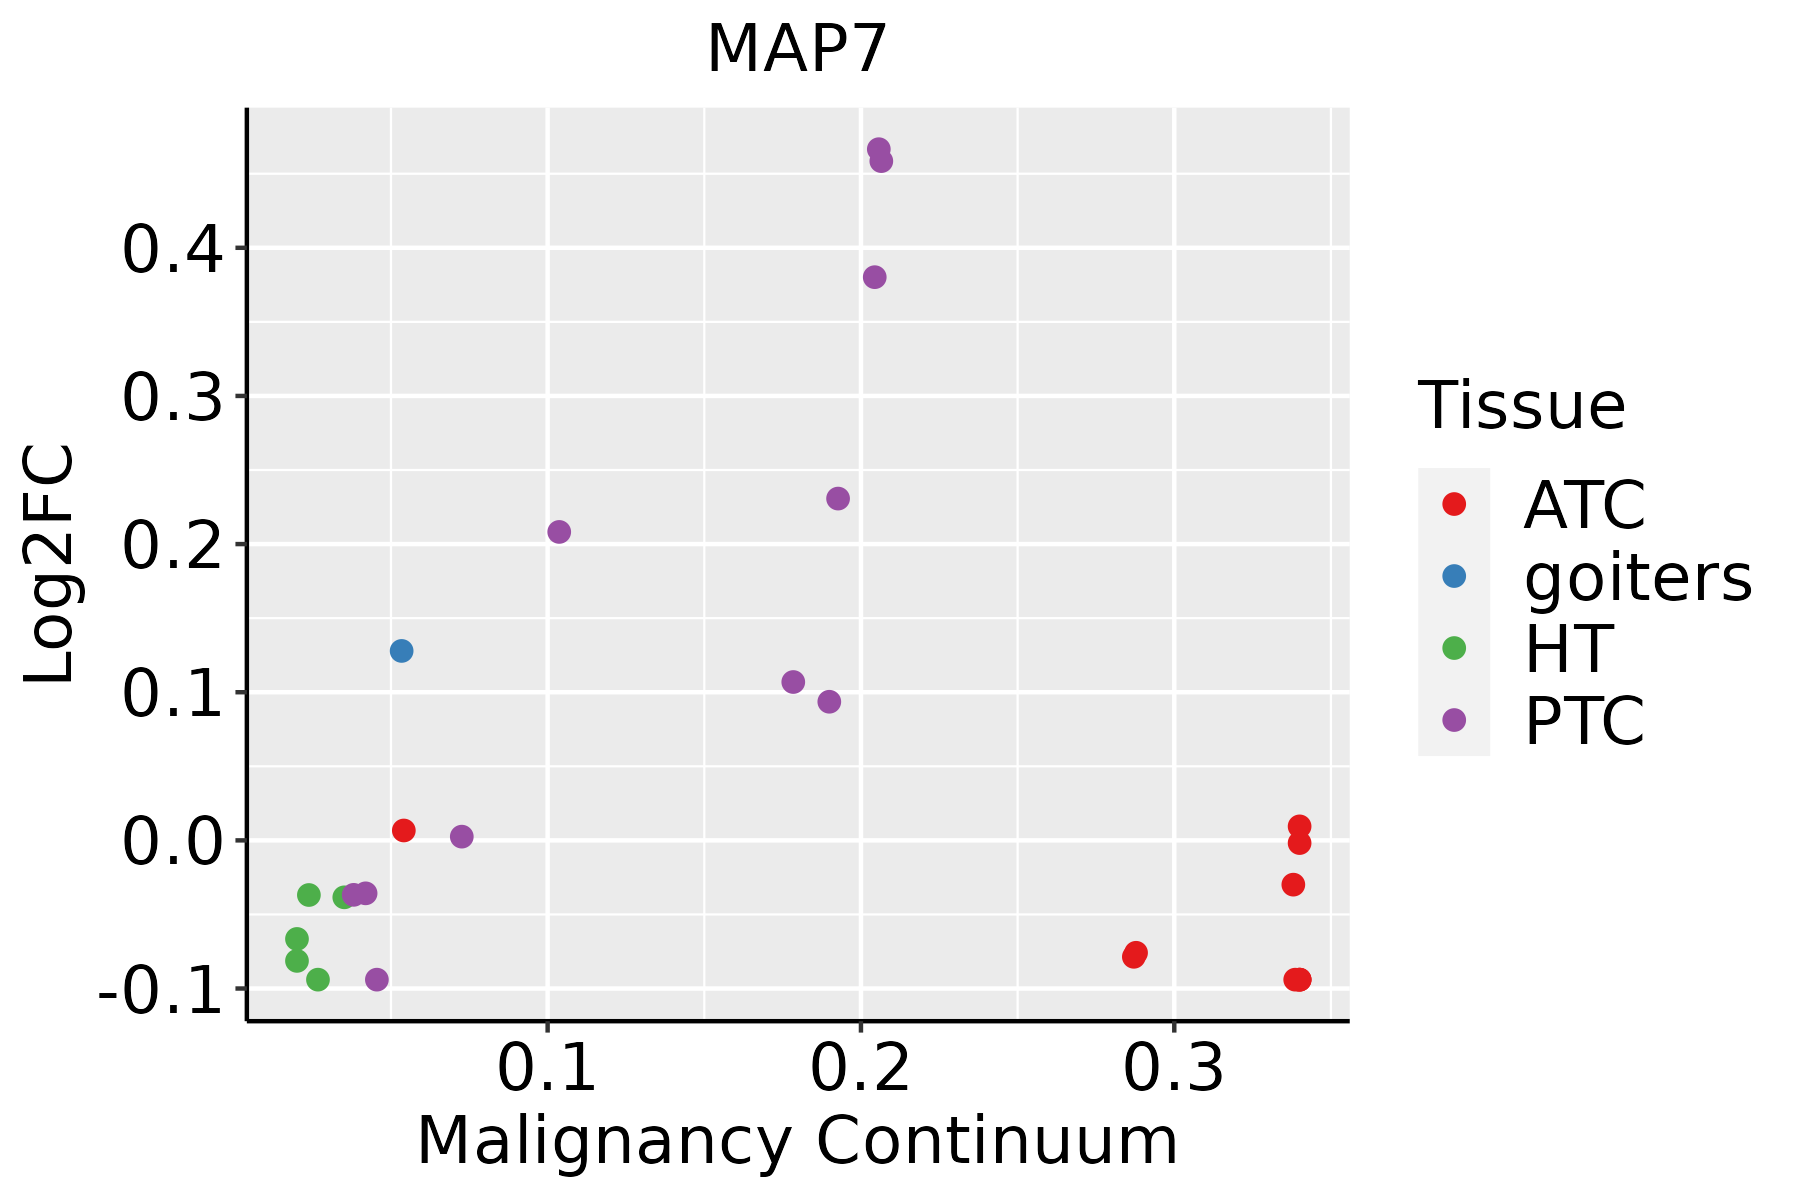
ATC: Anaplastic thyroid cancer
HT: Hashimoto's thyroiditis
PTC: Papillary thyroid cancer
∗log2FC in expression of this searched gene in stem-like cells from each diseased tissue sample relative to stem-like cells in normal samples in each tissue plotted against the malignancy continuum. Samples are colored based on if they are from different disease stage.

Top

Malignant transformation related pathway analysis

check buttonFind out the enriched GO biological processes and KEGG pathways involved in transition from healthy to precancer to cancer
check button Figure of enriched GO biological processes.
TissueDisease StageEnriched GO biological Processes
ColorectumADGO analysis - Figure of enriched GO biological processes: Top 15 enriched GO BP terms are showed in the bar plot of each disease state in each tissue. Each row represents a significant GO biological process which is colored according to the -log10(p.adjust).
ColorectumSERGO analysis - Figure of enriched GO biological processes: Top 15 enriched GO BP terms are showed in the bar plot of each disease state in each tissue. Each row represents a significant GO biological process which is colored according to the -log10(p.adjust).
ColorectumMSSGO analysis - Figure of enriched GO biological processes: Top 15 enriched GO BP terms are showed in the bar plot of each disease state in each tissue. Each row represents a significant GO biological process which is colored according to the -log10(p.adjust).
ColorectumMSI-HGO analysis - Figure of enriched GO biological processes: Top 15 enriched GO BP terms are showed in the bar plot of each disease state in each tissue. Each row represents a significant GO biological process which is colored according to the -log10(p.adjust).
ColorectumFAPGO analysis - Figure of enriched GO biological processes: Top 15 enriched GO BP terms are showed in the bar plot of each disease state in each tissue. Each row represents a significant GO biological process which is colored according to the -log10(p.adjust).
∗Top 15 enriched GO BP terms are showed in the bar plot of each disease state in each tissue. Each row represents a significant GO biological process which is colored according to the -log10(p.adjust).
Page: 1 2 3 4 5 6 7 8 9 

check button Enriched GO biological processes.
GO IDTissueDisease StageDescriptionGene RatioBg Ratiopvaluep.adjustCount
GO:00071639CervixCCestablishment or maintenance of cell polarity63/2311218/187234.25e-118.76e-0963
GO:007265910CervixCCprotein localization to plasma membrane73/2311284/187234.95e-106.73e-0873
GO:19907788CervixCCprotein localization to cell periphery78/2311333/187231.22e-089.73e-0778
GO:0072659ColorectumADprotein localization to plasma membrane122/3918284/187232.86e-171.49e-14122
GO:1990778ColorectumADprotein localization to cell periphery129/3918333/187235.51e-141.15e-11129
GO:0007163ColorectumADestablishment or maintenance of cell polarity77/3918218/187235.72e-072.08e-0577
GO:00726591ColorectumSERprotein localization to plasma membrane92/2897284/187236.36e-131.86e-1092
GO:19907781ColorectumSERprotein localization to cell periphery98/2897333/187236.09e-119.57e-0998
GO:00071631ColorectumSERestablishment or maintenance of cell polarity60/2897218/187233.45e-061.33e-0460
GO:0006970ColorectumSERresponse to osmotic stress23/289784/187233.61e-033.03e-0223
GO:00726592ColorectumMSSprotein localization to plasma membrane113/3467284/187233.23e-171.55e-14113
GO:19907782ColorectumMSSprotein localization to cell periphery120/3467333/187232.02e-145.47e-12120
GO:00071632ColorectumMSSestablishment or maintenance of cell polarity72/3467218/187231.90e-078.30e-0672
GO:00726593ColorectumMSI-Hprotein localization to plasma membrane38/1319284/187231.03e-043.18e-0338
GO:19907783ColorectumMSI-Hprotein localization to cell periphery40/1319333/187236.61e-041.27e-0240
GO:00726594ColorectumFAPprotein localization to plasma membrane95/2622284/187234.86e-179.93e-1495
GO:19907784ColorectumFAPprotein localization to cell periphery100/2622333/187232.19e-142.68e-11100
GO:00071633ColorectumFAPestablishment or maintenance of cell polarity64/2622218/187232.83e-095.07e-0764
GO:00069701ColorectumFAPresponse to osmotic stress25/262284/187231.43e-042.24e-0325
GO:00726595ColorectumCRCprotein localization to plasma membrane80/2078284/187231.36e-154.07e-1280
Page: 1 2 3 4 5 6 

check button Enriched KEGG pathways.
Pathway IDTissueDisease StageDescriptionGene RatioBg Ratiopvaluep.adjustqvalueCount
Page: 1 

Top

Cell-cell communication analysis

check buttonIdentification of potential cell-cell interactions between two cell types and their ligand-receptor pairs for different disease states
LigandReceptorLRpairPathwayTissueDisease Stage
Page: 1 

Top

Single-cell gene regulatory network inference analysis

check buttonFind out the significant the regulons (TFs) and the target genes of each regulon across cell types for different disease states
TFCell TypeTissueDisease StageTarget GeneRSSRegulon Activity
∗The dot plots of a searched regulon are shown for all cell subpopulations in each disease state of each tissue based on the regulon specific score inferred using pySCENIC and by calculating the average expression.
Page: 1 

Top

Somatic mutation of malignant transformation related genes

check buttonAnnotation of somatic variants for genes involved in malignant transformation
Hugo SymbolVariant ClassVariant ClassificationdbSNP RSHGVScHGVSpHGVSp ShortSWISSPROTBIOTYPESIFTPolyPhenTumor Sample BarcodeTissueHistologySexAgeStageTherapy TypesDrugsOutcome
MAP7SNVMissense_Mutationc.2154G>Cp.Gln718Hisp.Q718Hprotein_codingdeleterious(0)possibly_damaging(0.824)TCGA-3C-AALI-01Breastbreast invasive carcinomaFemale<65I/IIUnspecificPoly EComplete Response
MAP7SNVMissense_Mutationnovelc.1157C>Tp.Ala386Valp.A386Vprotein_codingtolerated(0.23)benign(0.395)TCGA-A7-A0CJ-01Breastbreast invasive carcinomaFemale<65I/IIChemotherapycytoxanSD
MAP7SNVMissense_Mutationc.2272G>Ap.Glu758Lysp.E758Kprotein_codingtolerated(0.45)benign(0.013)TCGA-AC-A23H-01Breastbreast invasive carcinomaFemale>=65I/IIUnknownUnknownPD
MAP7SNVMissense_Mutationnovelc.902G>Ap.Arg301Glnp.R301Qprotein_codingdeleterious(0.02)possibly_damaging(0.758)TCGA-AN-A046-01Breastbreast invasive carcinomaFemale>=65I/IIUnknownUnknownSD
MAP7SNVMissense_Mutationc.1231N>Cp.Glu411Glnp.E411Qprotein_codingtolerated(0.12)probably_damaging(0.986)TCGA-D8-A1J8-01Breastbreast invasive carcinomaFemale>=65I/IIHormone TherapynolvadexSD
MAP7insertionNonsense_Mutationnovelc.1157_1158insATAATATTTp.Ala386_Ala387insTerp.A386_A387ins*protein_codingTCGA-A7-A0CJ-01Breastbreast invasive carcinomaFemale<65I/IIChemotherapycytoxanSD
MAP7deletionFrame_Shift_Delc.1283delNp.Leu428GlnfsTer7p.L428Qfs*7protein_codingTCGA-BH-A0B1-01Breastbreast invasive carcinomaFemale>=65I/IIChemotherapyadriamycinSD
MAP7SNVMissense_Mutationrs750272702c.739G>Ap.Val247Ilep.V247Iprotein_codingtolerated(1)benign(0.341)TCGA-2W-A8YY-01Cervixcervical & endocervical cancerFemale<65I/IIChemotherapycisplatinCR
MAP7SNVMissense_Mutationnovelc.513N>Cp.Arg171Serp.R171Sprotein_codingdeleterious(0)probably_damaging(0.999)TCGA-C5-A1BQ-01Cervixcervical & endocervical cancerFemale>=65III/IVChemotherapycisplatinCR
MAP7SNVMissense_Mutationrs755861106c.448C>Tp.Arg150Trpp.R150Wprotein_codingdeleterious(0)probably_damaging(1)TCGA-5M-AAT6-01Colorectumcolon adenocarcinomaFemale<65III/IVUnknownUnknownPD
Page: 1 2 3 4 5 6 7 8 

Top

Related drugs of malignant transformation related genes

check buttonIdentification of chemicals and drugs interact with genes involved in malignant transfromation
(DGIdb 4.0)
Entrez IDSymbolCategoryInteraction TypesDrug Claim NameDrug NamePMIDs
Page: 1