
|
|||||
|
 | |
| |
| |
| |
| |
| |
|
Gene: MAP4K5 |
Gene summary for MAP4K5 |
| Gene information | Species | Human | Gene symbol | MAP4K5 | Gene ID | 11183 |
| Gene name | mitogen-activated protein kinase kinase kinase kinase 5 | |
| Gene Alias | GCKR | |
| Cytomap | 14q22.1 | |
| Gene Type | protein-coding | GO ID | GO:0000165 | UniProtAcc | B3KWC4 |
Top |
Malignant transformation analysis |
| Identification of the aberrant gene expression in precancerous and cancerous lesions by comparing the gene expression of stem-like cells in diseased tissues with normal stem cells |
| Entrez ID | Symbol | Replicates | Species | Organ | Tissue | Adj P-value | Log2FC | Malignancy |
| 11183 | MAP4K5 | HTA11_3410_2000001011 | Human | Colorectum | AD | 7.09e-15 | -5.85e-01 | 0.0155 |
| 11183 | MAP4K5 | HTA11_2487_2000001011 | Human | Colorectum | SER | 1.79e-03 | -4.39e-01 | -0.1808 |
| 11183 | MAP4K5 | HTA11_2951_2000001011 | Human | Colorectum | AD | 1.14e-03 | -7.13e-01 | 0.0216 |
| 11183 | MAP4K5 | HTA11_3361_2000001011 | Human | Colorectum | AD | 1.12e-04 | -5.56e-01 | -0.1207 |
| 11183 | MAP4K5 | HTA11_696_2000001011 | Human | Colorectum | AD | 1.40e-08 | -4.19e-01 | -0.1464 |
| 11183 | MAP4K5 | HTA11_866_3004761011 | Human | Colorectum | AD | 1.31e-04 | -4.74e-01 | 0.096 |
| 11183 | MAP4K5 | HTA11_10711_2000001011 | Human | Colorectum | AD | 7.96e-03 | -4.20e-01 | 0.0338 |
| 11183 | MAP4K5 | HTA11_7696_3000711011 | Human | Colorectum | AD | 2.85e-05 | -4.11e-01 | 0.0674 |
| 11183 | MAP4K5 | HTA11_99999970781_79442 | Human | Colorectum | MSS | 2.44e-13 | -4.11e-01 | 0.294 |
| 11183 | MAP4K5 | HTA11_99999971662_82457 | Human | Colorectum | MSS | 1.77e-12 | -4.95e-01 | 0.3859 |
| 11183 | MAP4K5 | HTA11_99999974143_84620 | Human | Colorectum | MSS | 2.97e-08 | -3.91e-01 | 0.3005 |
| 11183 | MAP4K5 | A001-C-207 | Human | Colorectum | FAP | 4.22e-04 | -2.86e-01 | 0.1278 |
| 11183 | MAP4K5 | A015-C-203 | Human | Colorectum | FAP | 1.09e-28 | -4.77e-01 | -0.1294 |
| 11183 | MAP4K5 | A015-C-204 | Human | Colorectum | FAP | 3.52e-06 | -3.61e-01 | -0.0228 |
| 11183 | MAP4K5 | A014-C-040 | Human | Colorectum | FAP | 1.46e-02 | -2.19e-01 | -0.1184 |
| 11183 | MAP4K5 | A002-C-201 | Human | Colorectum | FAP | 3.16e-12 | -4.27e-01 | 0.0324 |
| 11183 | MAP4K5 | A002-C-203 | Human | Colorectum | FAP | 6.87e-09 | -2.63e-01 | 0.2786 |
| 11183 | MAP4K5 | A001-C-119 | Human | Colorectum | FAP | 1.77e-04 | -4.08e-01 | -0.1557 |
| 11183 | MAP4K5 | A001-C-108 | Human | Colorectum | FAP | 4.29e-17 | -3.37e-01 | -0.0272 |
| 11183 | MAP4K5 | A002-C-205 | Human | Colorectum | FAP | 2.28e-20 | -4.84e-01 | -0.1236 |
| Page: 1 2 3 4 5 6 7 8 9 |
| Tissue | Expression Dynamics | Abbreviation |
| Colorectum (GSE201348) |  | FAP: Familial adenomatous polyposis |
| CRC: Colorectal cancer | ||
| Colorectum (HTA11) |  | AD: Adenomas |
| SER: Sessile serrated lesions | ||
| MSI-H: Microsatellite-high colorectal cancer | ||
| MSS: Microsatellite stable colorectal cancer | ||
| Esophagus |  | ESCC: Esophageal squamous cell carcinoma |
| HGIN: High-grade intraepithelial neoplasias | ||
| LGIN: Low-grade intraepithelial neoplasias | ||
| Liver | 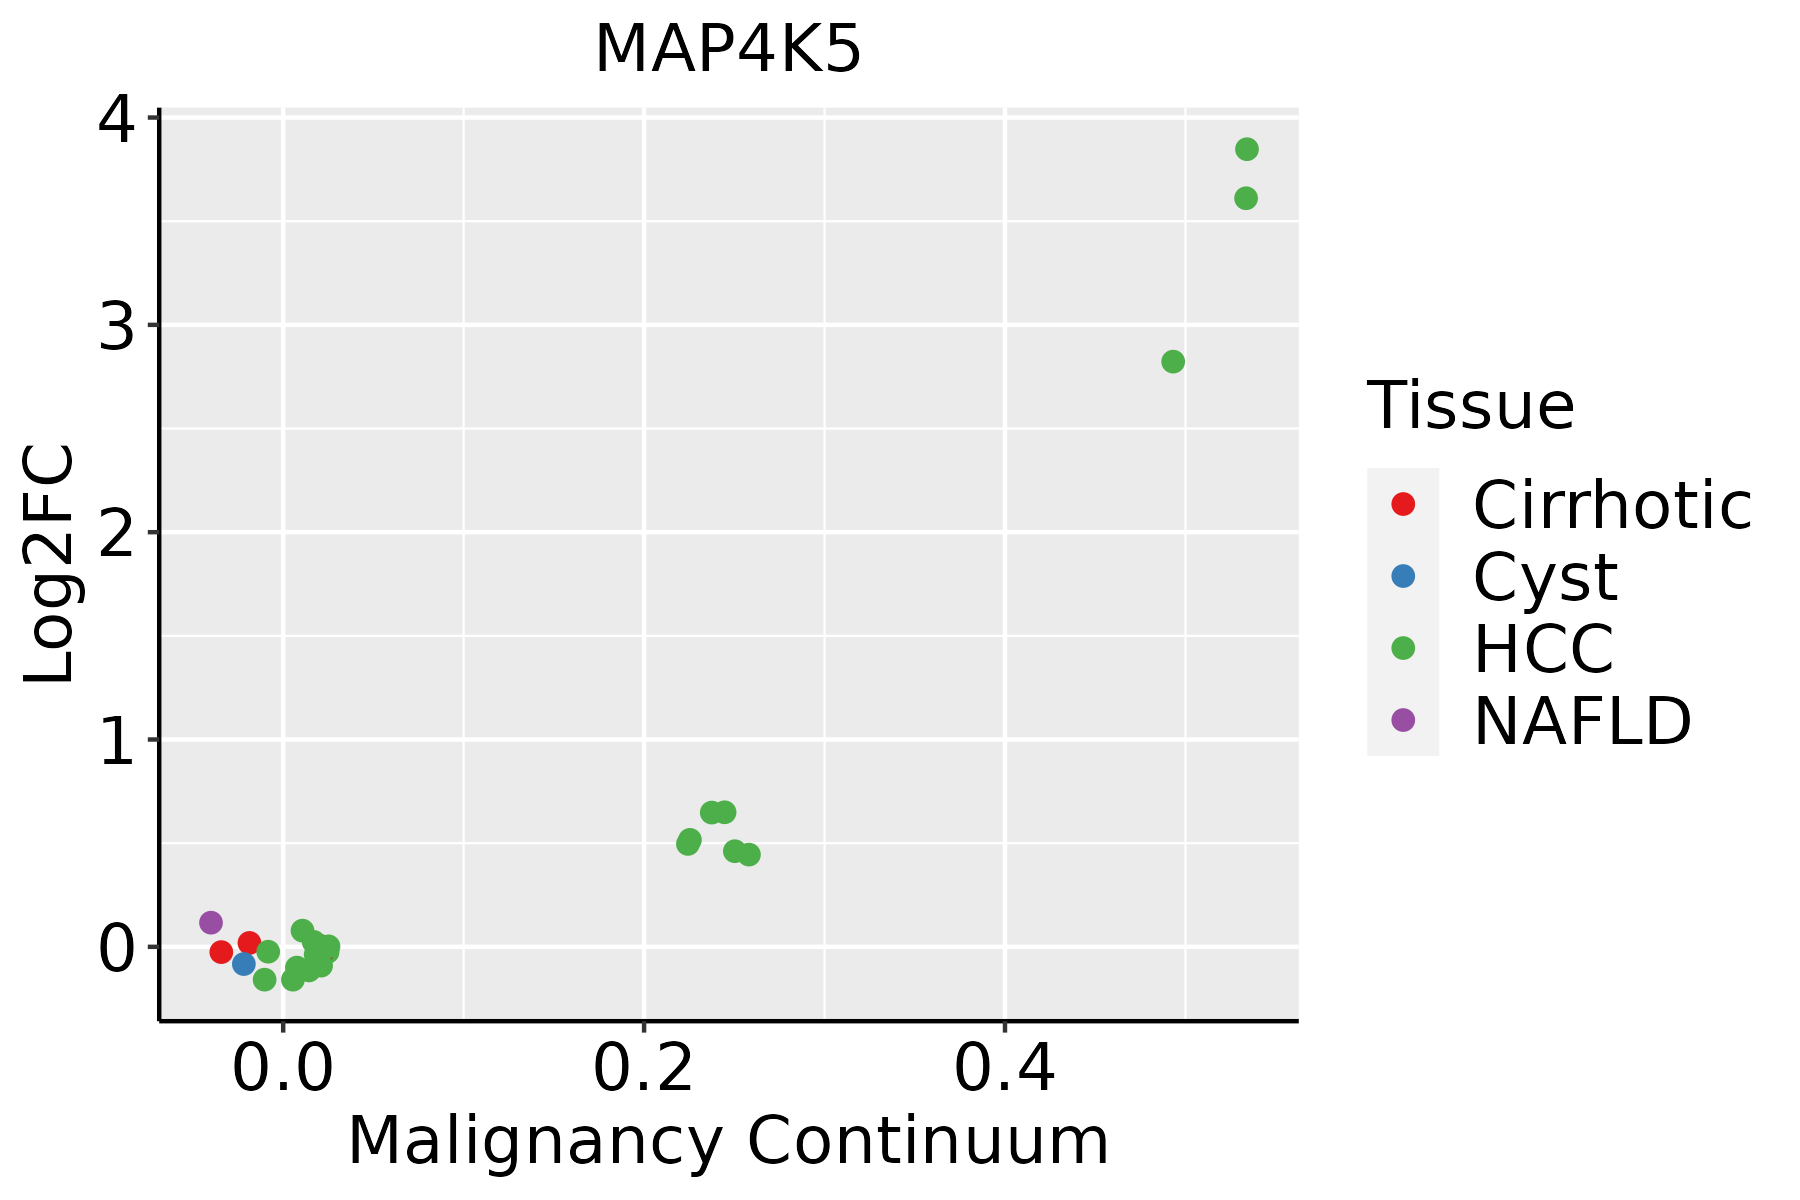 | HCC: Hepatocellular carcinoma |
| NAFLD: Non-alcoholic fatty liver disease | ||
| Lung | 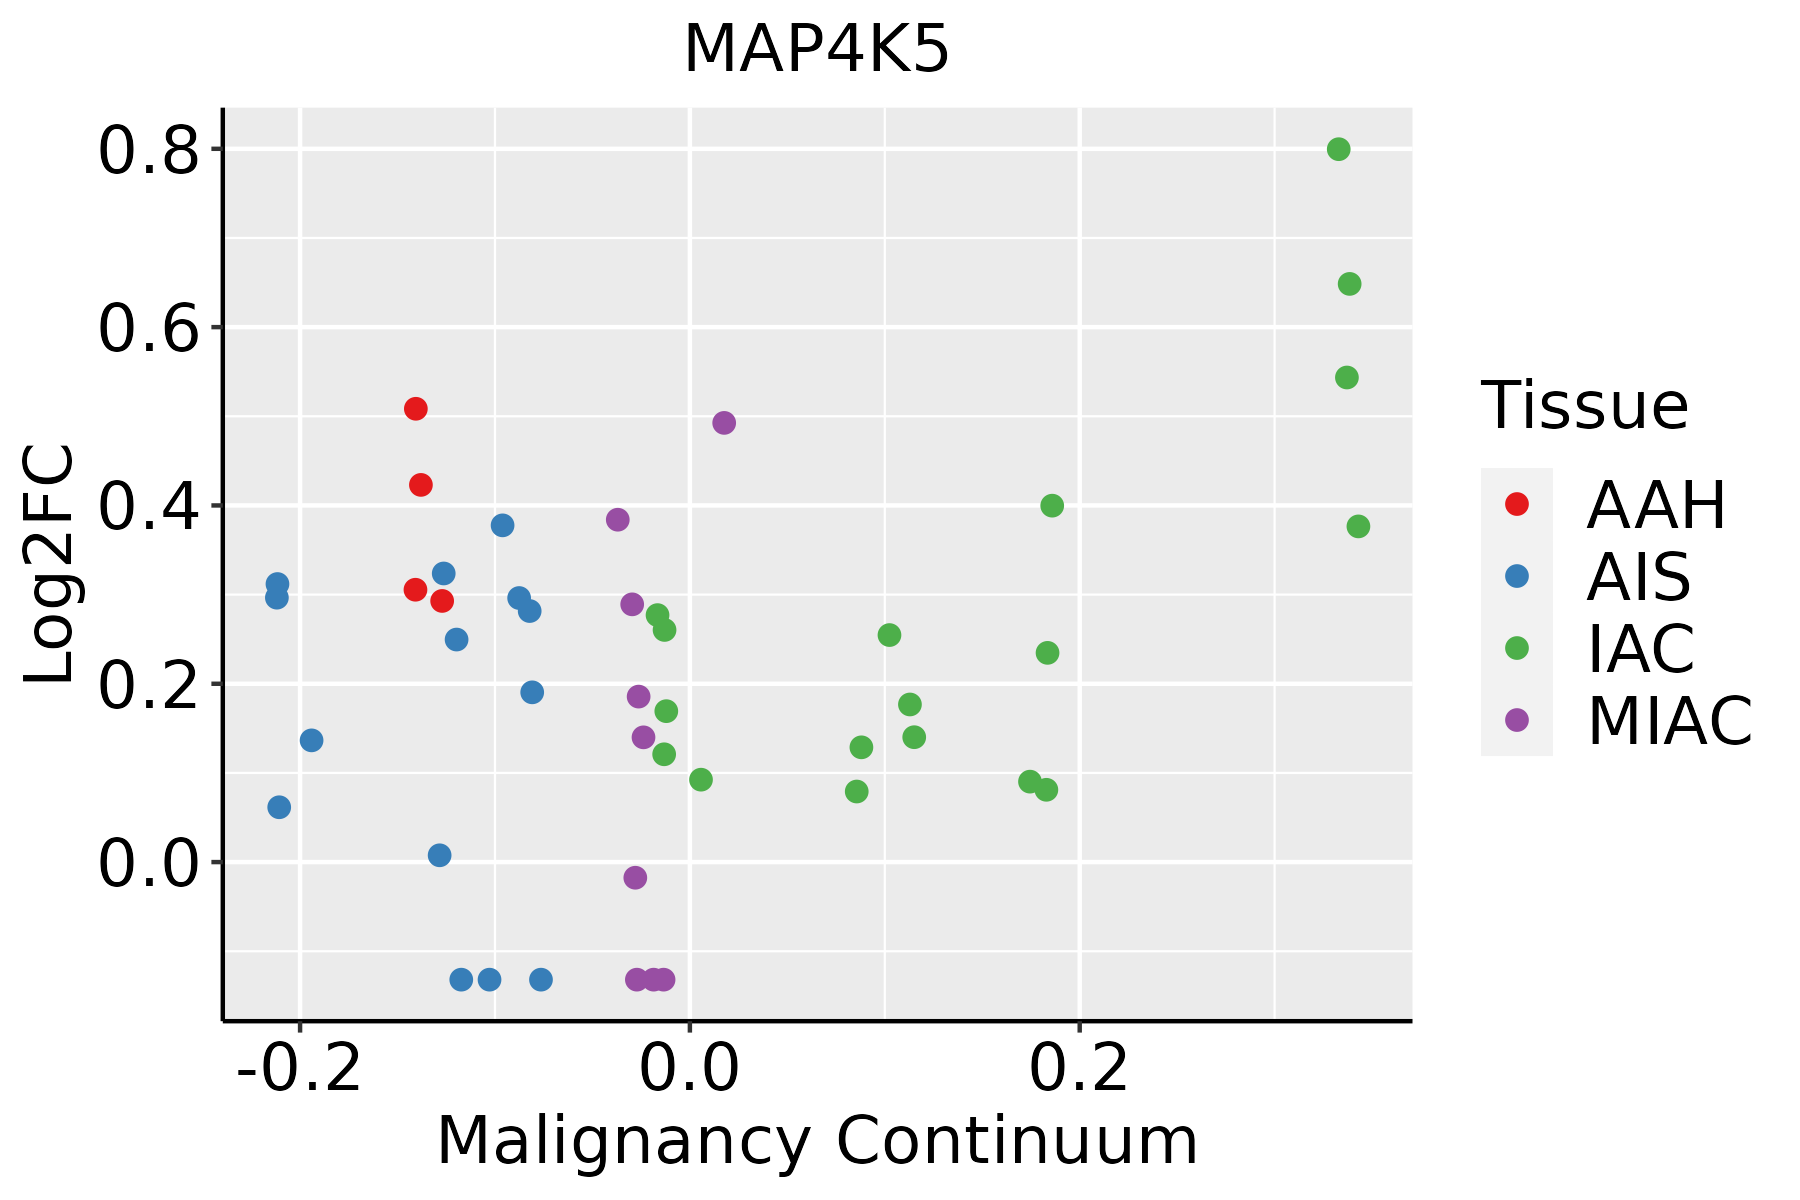 | AAH: Atypical adenomatous hyperplasia |
| AIS: Adenocarcinoma in situ | ||
| IAC: Invasive lung adenocarcinoma | ||
| MIA: Minimally invasive adenocarcinoma | ||
| Oral Cavity | 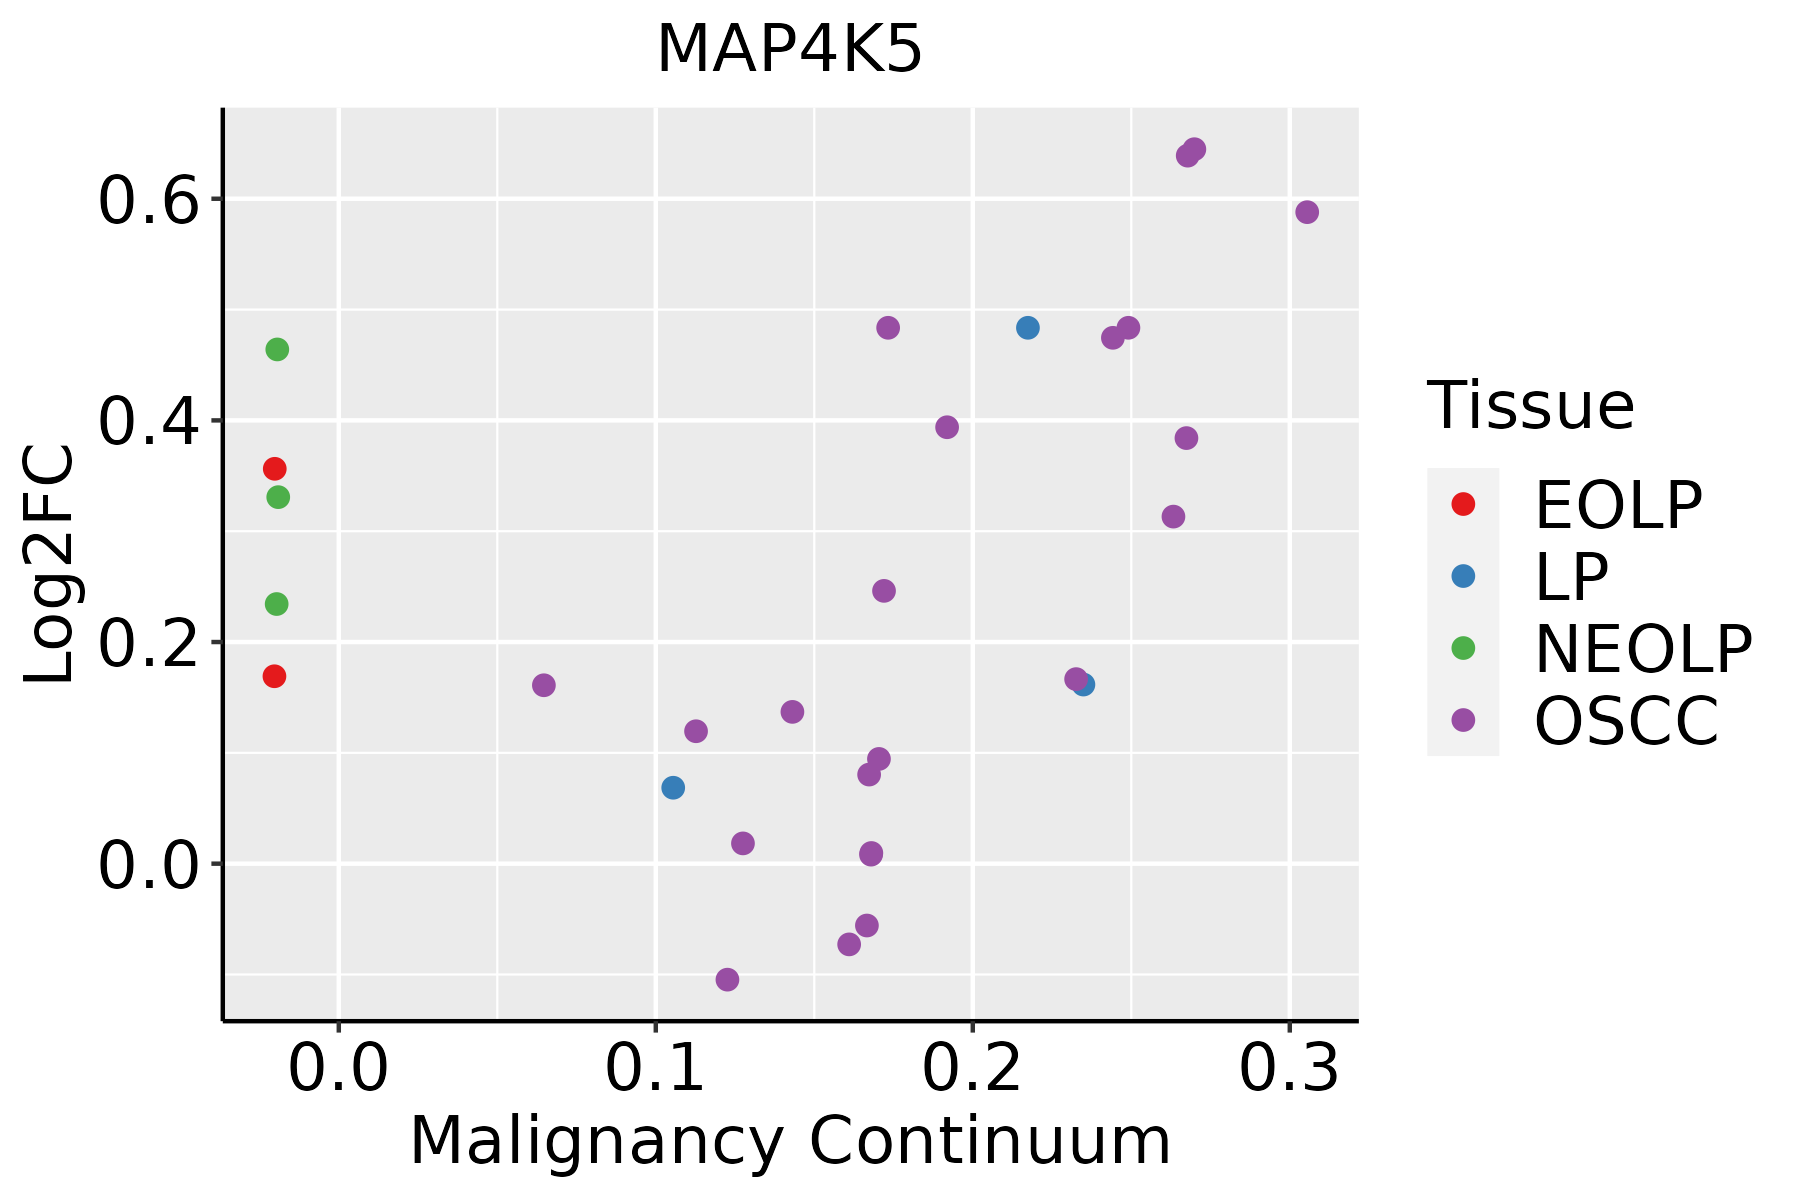 | EOLP: Erosive Oral lichen planus |
| LP: leukoplakia | ||
| NEOLP: Non-erosive oral lichen planus | ||
| OSCC: Oral squamous cell carcinoma | ||
| Prostate | 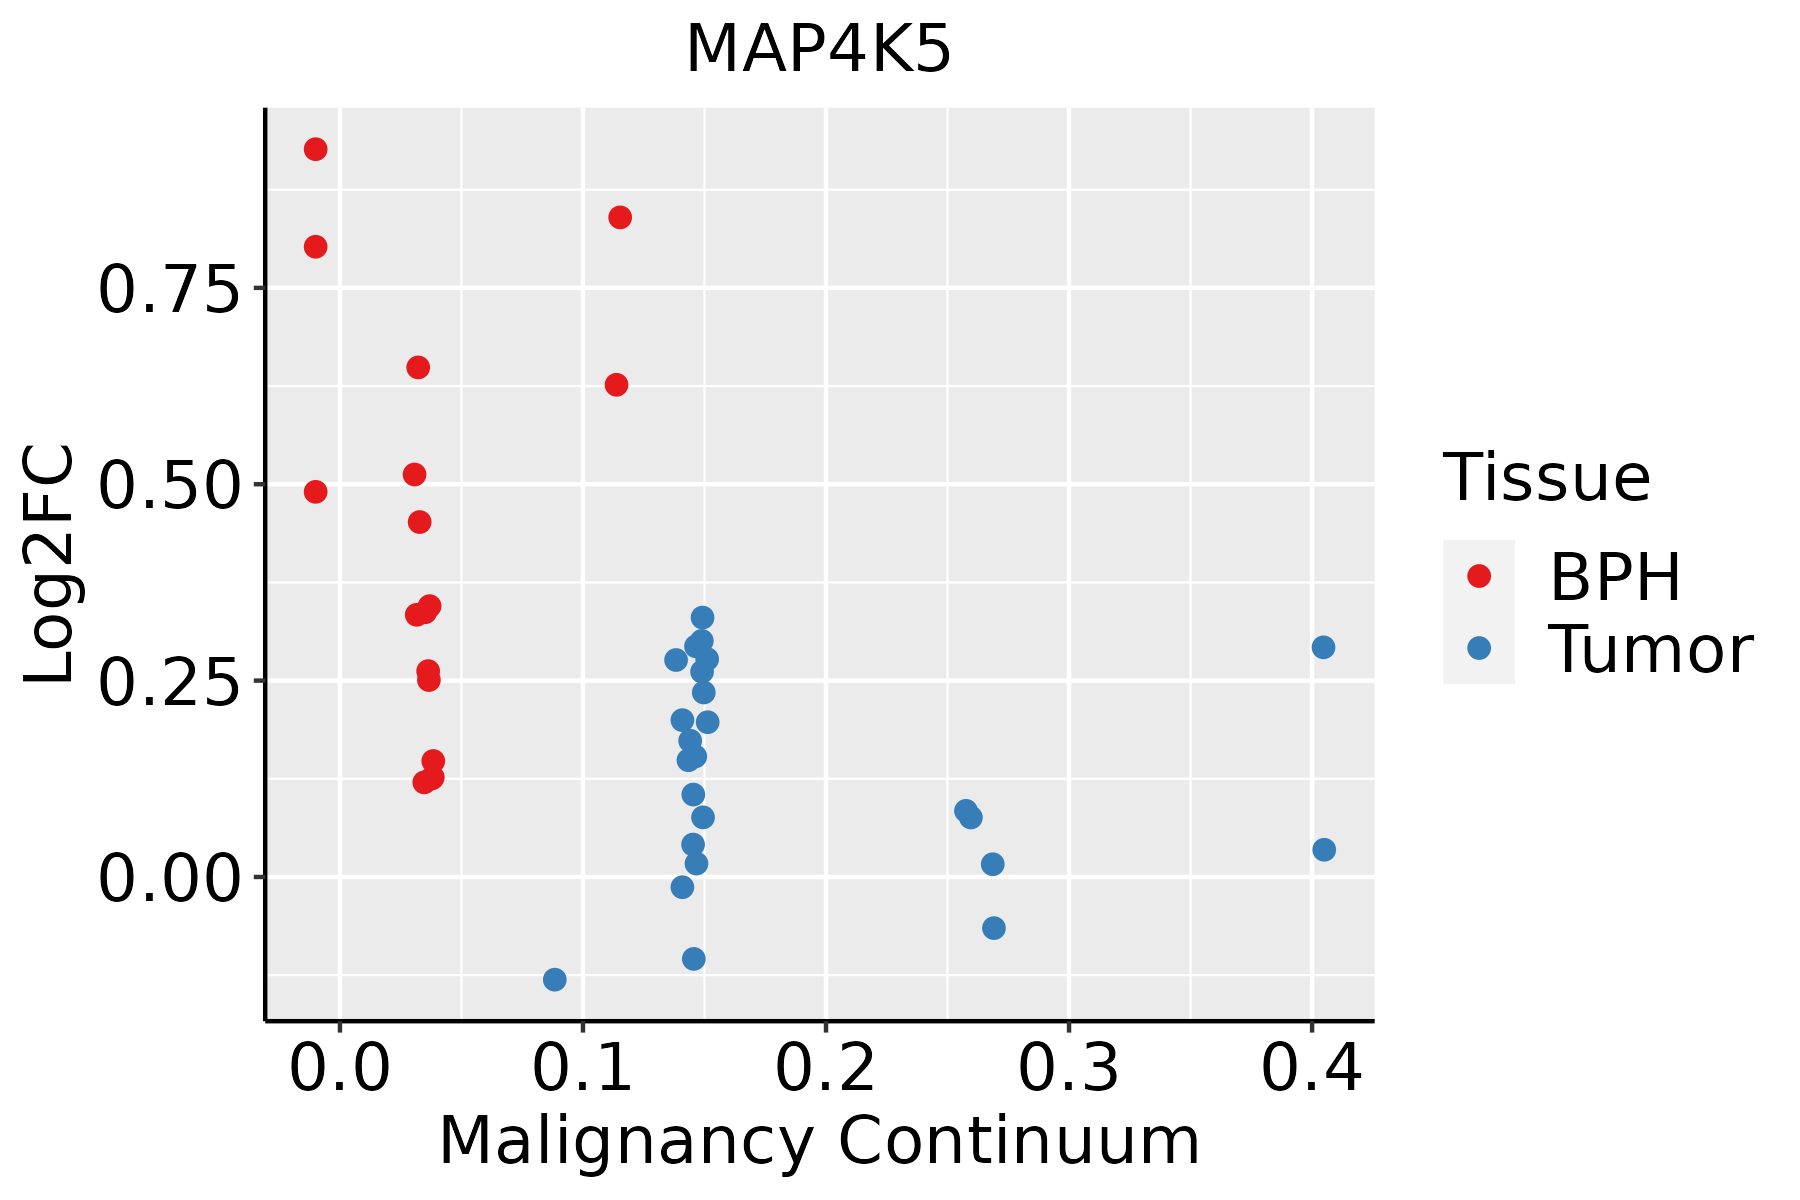 | BPH: Benign Prostatic Hyperplasia |
| Skin | 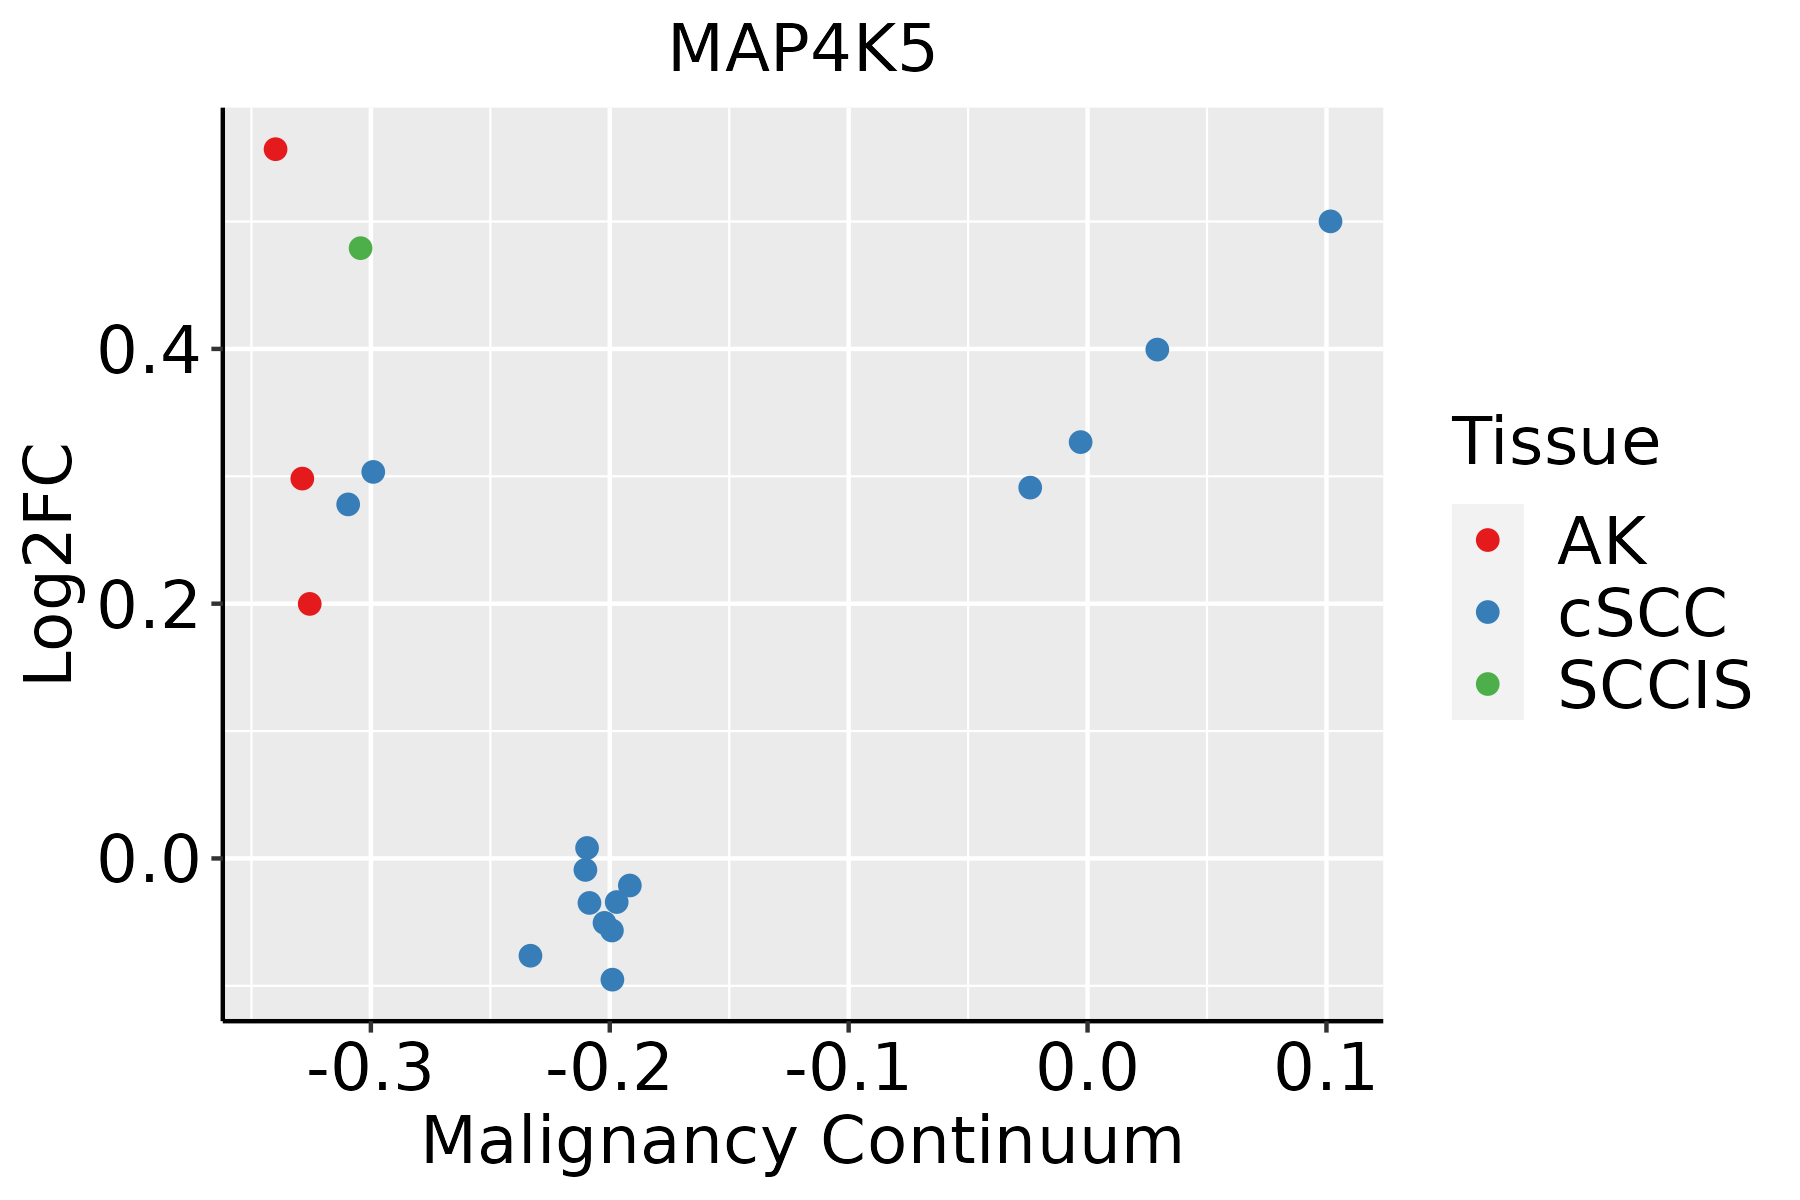 | AK: Actinic keratosis |
| cSCC: Cutaneous squamous cell carcinoma | ||
| SCCIS:squamous cell carcinoma in situ | ||
| Thyroid | 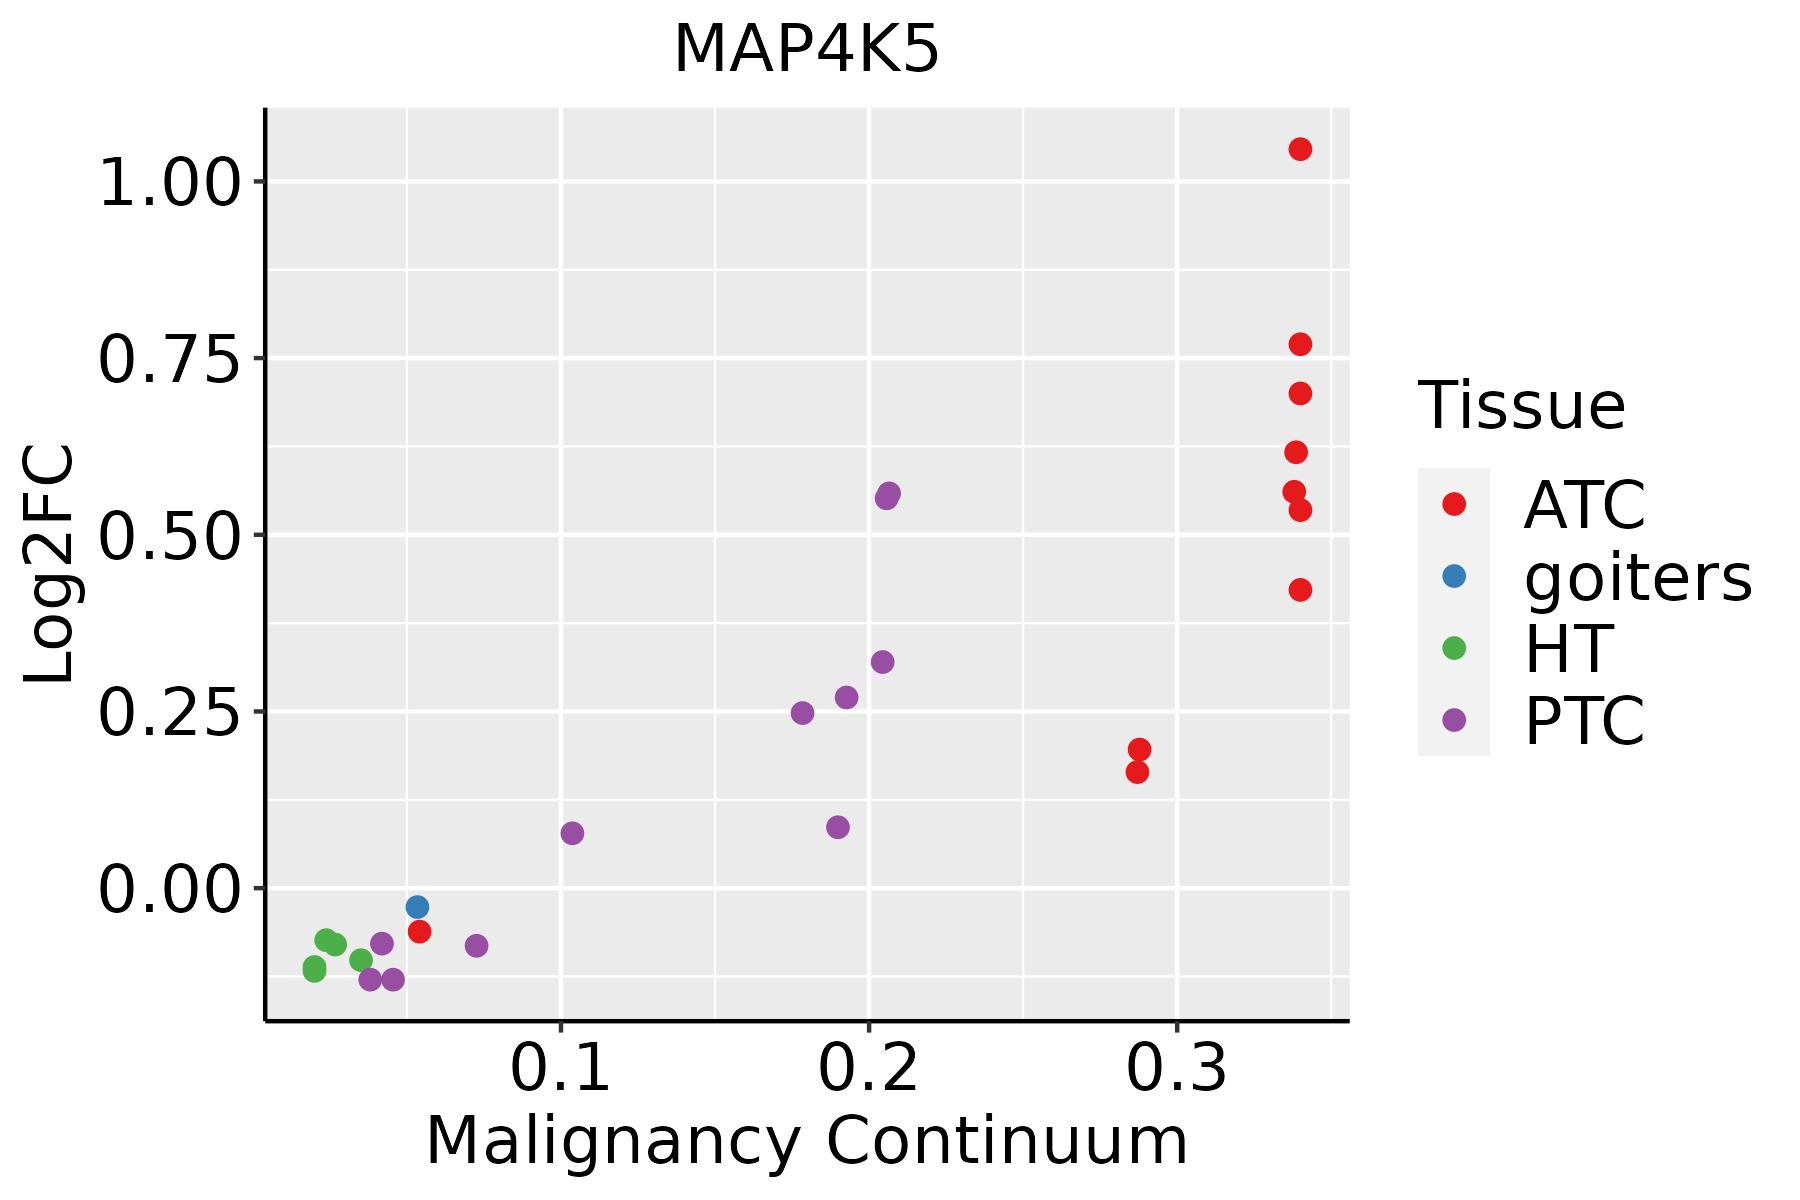 | ATC: Anaplastic thyroid cancer |
| HT: Hashimoto's thyroiditis | ||
| PTC: Papillary thyroid cancer |
| ∗log2FC in expression of this searched gene in stem-like cells from each diseased tissue sample relative to stem-like cells in normal samples in each tissue plotted against the malignancy continuum. Samples are colored based on if they are from different disease stage. |
Top |
Malignant transformation related pathway analysis |
| Find out the enriched GO biological processes and KEGG pathways involved in transition from healthy to precancer to cancer |
| Tissue | Disease Stage | Enriched GO biological Processes |
| Colorectum | AD |  |
| Colorectum | SER |  |
| Colorectum | MSS |  |
| Colorectum | MSI-H |  |
| Colorectum | FAP |  |
| ∗Top 15 enriched GO BP terms are showed in the bar plot of each disease state in each tissue. Each row represents a significant GO biological process which is colored according to the -log10(p.adjust). |
| Page: 1 2 3 4 5 6 7 8 9 |
| GO ID | Tissue | Disease Stage | Description | Gene Ratio | Bg Ratio | pvalue | p.adjust | Count |
| Page: 1 |
| Pathway ID | Tissue | Disease Stage | Description | Gene Ratio | Bg Ratio | pvalue | p.adjust | qvalue | Count |
| Page: 1 |
Top |
Cell-cell communication analysis |
| Identification of potential cell-cell interactions between two cell types and their ligand-receptor pairs for different disease states |
| Ligand | Receptor | LRpair | Pathway | Tissue | Disease Stage |
| Page: 1 |
Top |
Single-cell gene regulatory network inference analysis |
| Find out the significant the regulons (TFs) and the target genes of each regulon across cell types for different disease states |
| TF | Cell Type | Tissue | Disease Stage | Target Gene | RSS | Regulon Activity |
| ∗The dot plots of a searched regulon are shown for all cell subpopulations in each disease state of each tissue based on the regulon specific score inferred using pySCENIC and by calculating the average expression. |
| Page: 1 |
Top |
Somatic mutation of malignant transformation related genes |
| Annotation of somatic variants for genes involved in malignant transformation |
| Hugo Symbol | Variant Class | Variant Classification | dbSNP RS | HGVSc | HGVSp | HGVSp Short | SWISSPROT | BIOTYPE | SIFT | PolyPhen | Tumor Sample Barcode | Tissue | Histology | Sex | Age | Stage | Therapy Types | Drugs | Outcome |
| MAP4K5 | SNV | Missense_Mutation | novel | c.412C>A | p.His138Asn | p.H138N | protein_coding | deleterious(0) | probably_damaging(0.995) | TCGA-AR-A0U0-01 | Breast | breast invasive carcinoma | Female | >=65 | I/II | Unknown | Unknown | SD | |
| MAP4K5 | SNV | Missense_Mutation | novel | c.95N>T | p.Gly32Val | p.G32V | protein_coding | deleterious(0) | probably_damaging(1) | TCGA-AR-A24H-01 | Breast | breast invasive carcinoma | Female | >=65 | I/II | Hormone Therapy | tamoxiphen | SD | |
| MAP4K5 | insertion | Frame_Shift_Ins | novel | c.410_411insATCAATGATT | p.Met137IlefsTer6 | p.M137Ifs*6 | protein_coding | TCGA-AR-A0U0-01 | Breast | breast invasive carcinoma | Female | >=65 | I/II | Unknown | Unknown | SD | |||
| MAP4K5 | SNV | Missense_Mutation | novel | c.1396N>C | p.Ala466Pro | p.A466P | protein_coding | tolerated(1) | benign(0.003) | TCGA-EA-A43B-01 | Cervix | cervical & endocervical cancer | Female | <65 | I/II | Chemotherapy | cisplatin | CR | |
| MAP4K5 | SNV | Missense_Mutation | c.1612C>T | p.Leu538Phe | p.L538F | protein_coding | deleterious(0) | probably_damaging(0.999) | TCGA-FU-A5XV-01 | Cervix | cervical & endocervical cancer | Female | <65 | III/IV | Unknown | Unknown | SD | ||
| MAP4K5 | SNV | Missense_Mutation | c.2385C>G | p.Phe795Leu | p.F795L | protein_coding | tolerated(0.57) | probably_damaging(0.995) | TCGA-IR-A3LK-01 | Cervix | cervical & endocervical cancer | Female | >=65 | I/II | Chemotherapy | cisplatin | PD | ||
| MAP4K5 | SNV | Missense_Mutation | c.183N>C | p.Leu61Phe | p.L61F | protein_coding | deleterious(0.01) | probably_damaging(0.915) | TCGA-JW-A5VL-01 | Cervix | cervical & endocervical cancer | Female | <65 | I/II | Unknown | Unknown | SD | ||
| MAP4K5 | SNV | Missense_Mutation | rs368497445 | c.901N>A | p.Ala301Thr | p.A301T | protein_coding | tolerated(0.7) | benign(0) | TCGA-A6-2686-01 | Colorectum | colon adenocarcinoma | Female | >=65 | I/II | Unknown | Unknown | SD | |
| MAP4K5 | SNV | Missense_Mutation | c.2212A>G | p.Thr738Ala | p.T738A | protein_coding | tolerated(0.15) | probably_damaging(0.995) | TCGA-AA-3811-01 | Colorectum | colon adenocarcinoma | Female | >=65 | III/IV | Unknown | Unknown | PD | ||
| MAP4K5 | SNV | Missense_Mutation | c.2434N>T | p.Arg812Cys | p.R812C | protein_coding | deleterious(0) | possibly_damaging(0.88) | TCGA-AA-3864-01 | Colorectum | colon adenocarcinoma | Male | >=65 | I/II | Unknown | Unknown | SD |
| Page: 1 2 3 4 5 6 |
Top |
Related drugs of malignant transformation related genes |
| Identification of chemicals and drugs interact with genes involved in malignant transfromation |
| (DGIdb 4.0) |
| Entrez ID | Symbol | Category | Interaction Types | Drug Claim Name | Drug Name | PMIDs |
| 11183 | MAP4K5 | DRUGGABLE GENOME, KINASE, SERINE THREONINE KINASE, ENZYME | CYC-116 | CYC-116 | ||
| 11183 | MAP4K5 | DRUGGABLE GENOME, KINASE, SERINE THREONINE KINASE, ENZYME | LAS38096 | CHEMBL375293 | ||
| 11183 | MAP4K5 | DRUGGABLE GENOME, KINASE, SERINE THREONINE KINASE, ENZYME | AZD-1152-HQPA | AZD-1152-HQPA | ||
| 11183 | MAP4K5 | DRUGGABLE GENOME, KINASE, SERINE THREONINE KINASE, ENZYME | GW843682X | GW843682X | ||
| 11183 | MAP4K5 | DRUGGABLE GENOME, KINASE, SERINE THREONINE KINASE, ENZYME | SORAFENIB | SORAFENIB | ||
| 11183 | MAP4K5 | DRUGGABLE GENOME, KINASE, SERINE THREONINE KINASE, ENZYME | SOTRASTAURIN | SOTRASTAURIN | ||
| 11183 | MAP4K5 | DRUGGABLE GENOME, KINASE, SERINE THREONINE KINASE, ENZYME | SB-220025 | SB-220025 | ||
| 11183 | MAP4K5 | DRUGGABLE GENOME, KINASE, SERINE THREONINE KINASE, ENZYME | SB-242235 | SB-242235 | ||
| 11183 | MAP4K5 | DRUGGABLE GENOME, KINASE, SERINE THREONINE KINASE, ENZYME | DACTOLISIB | DACTOLISIB | ||
| 11183 | MAP4K5 | DRUGGABLE GENOME, KINASE, SERINE THREONINE KINASE, ENZYME | PALBOCICLIB | PALBOCICLIB |
| Page: 1 2 3 4 |

Copyright 2023-Present -The University of Texas Health Science Center at Houston |