
|
|||||
|
 | |
| |
| |
| |
| |
| |
|
Gene: MAP3K8 |
Gene summary for MAP3K8 |
| Gene information | Species | Human | Gene symbol | MAP3K8 | Gene ID | 1326 |
| Gene name | mitogen-activated protein kinase kinase kinase 8 | |
| Gene Alias | AURA2 | |
| Cytomap | 10p11.23 | |
| Gene Type | protein-coding | GO ID | GO:0000165 | UniProtAcc | P41279 |
Top |
Malignant transformation analysis |
| Identification of the aberrant gene expression in precancerous and cancerous lesions by comparing the gene expression of stem-like cells in diseased tissues with normal stem cells |
| Entrez ID | Symbol | Replicates | Species | Organ | Tissue | Adj P-value | Log2FC | Malignancy |
| 1326 | MAP3K8 | AEH-subject1 | Human | Endometrium | AEH | 1.05e-31 | 7.37e-01 | -0.3059 |
| 1326 | MAP3K8 | AEH-subject2 | Human | Endometrium | AEH | 1.08e-13 | 4.60e-01 | -0.2525 |
| 1326 | MAP3K8 | AEH-subject3 | Human | Endometrium | AEH | 4.06e-07 | 3.55e-01 | -0.2576 |
| 1326 | MAP3K8 | AEH-subject4 | Human | Endometrium | AEH | 2.41e-21 | 6.70e-01 | -0.2657 |
| 1326 | MAP3K8 | AEH-subject5 | Human | Endometrium | AEH | 2.30e-13 | 5.32e-01 | -0.2953 |
| 1326 | MAP3K8 | EEC-subject1 | Human | Endometrium | EEC | 5.43e-10 | 4.72e-01 | -0.2682 |
| 1326 | MAP3K8 | EEC-subject2 | Human | Endometrium | EEC | 4.43e-18 | 5.36e-01 | -0.2607 |
| 1326 | MAP3K8 | GSM6177620_NYU_UCEC1_lib1_lib1 | Human | Endometrium | EEC | 6.27e-03 | 4.41e-02 | -0.1869 |
| 1326 | MAP3K8 | GSM6177620_NYU_UCEC1_lib2_lib2 | Human | Endometrium | EEC | 8.74e-03 | -2.49e-02 | -0.1875 |
| 1326 | MAP3K8 | GSM6177620_NYU_UCEC1_lib3_lib3 | Human | Endometrium | EEC | 2.71e-02 | 1.12e-03 | -0.1883 |
| 1326 | MAP3K8 | GSM6177622_NYU_UCEC3_lib1_lib1 | Human | Endometrium | EEC | 3.23e-03 | 6.17e-02 | -0.1917 |
| 1326 | MAP3K8 | GSM6177622_NYU_UCEC3_lib2_lib2 | Human | Endometrium | EEC | 7.53e-06 | 7.26e-02 | -0.1916 |
| 1326 | MAP3K8 | LZE7T | Human | Esophagus | ESCC | 4.36e-09 | 5.37e-01 | 0.0667 |
| 1326 | MAP3K8 | LZE8T | Human | Esophagus | ESCC | 3.66e-09 | 1.81e-01 | 0.067 |
| 1326 | MAP3K8 | LZE20T | Human | Esophagus | ESCC | 1.48e-03 | 4.65e-01 | 0.0662 |
| 1326 | MAP3K8 | LZE24T | Human | Esophagus | ESCC | 2.94e-28 | 1.45e+00 | 0.0596 |
| 1326 | MAP3K8 | LZE21T | Human | Esophagus | ESCC | 1.94e-03 | 8.17e-01 | 0.0655 |
| 1326 | MAP3K8 | P1T-E | Human | Esophagus | ESCC | 2.21e-09 | 1.76e+00 | 0.0875 |
| 1326 | MAP3K8 | P2T-E | Human | Esophagus | ESCC | 8.72e-25 | 7.46e-01 | 0.1177 |
| 1326 | MAP3K8 | P4T-E | Human | Esophagus | ESCC | 1.12e-39 | 1.35e+00 | 0.1323 |
| Page: 1 2 3 4 5 |
| Tissue | Expression Dynamics | Abbreviation |
| Endometrium | 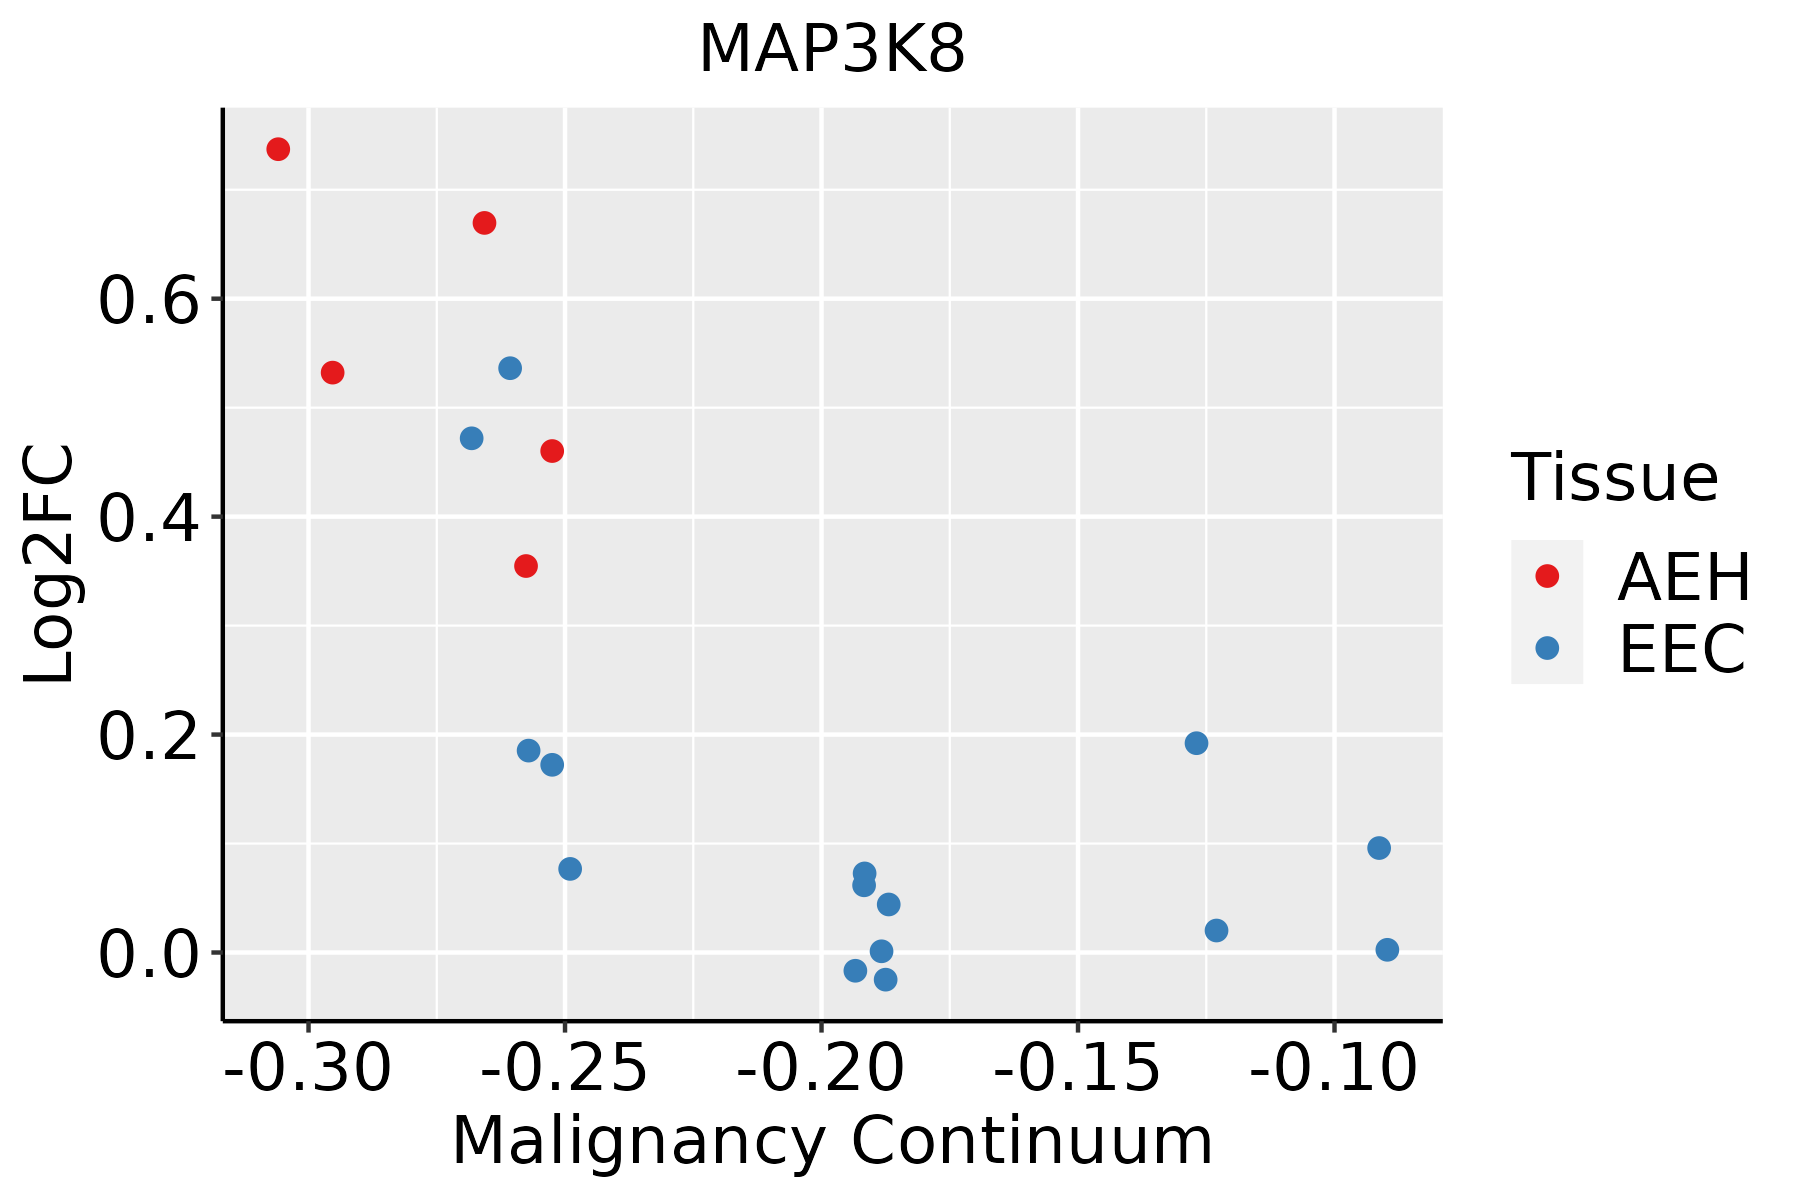 | AEH: Atypical endometrial hyperplasia |
| EEC: Endometrioid Cancer | ||
| Esophagus | 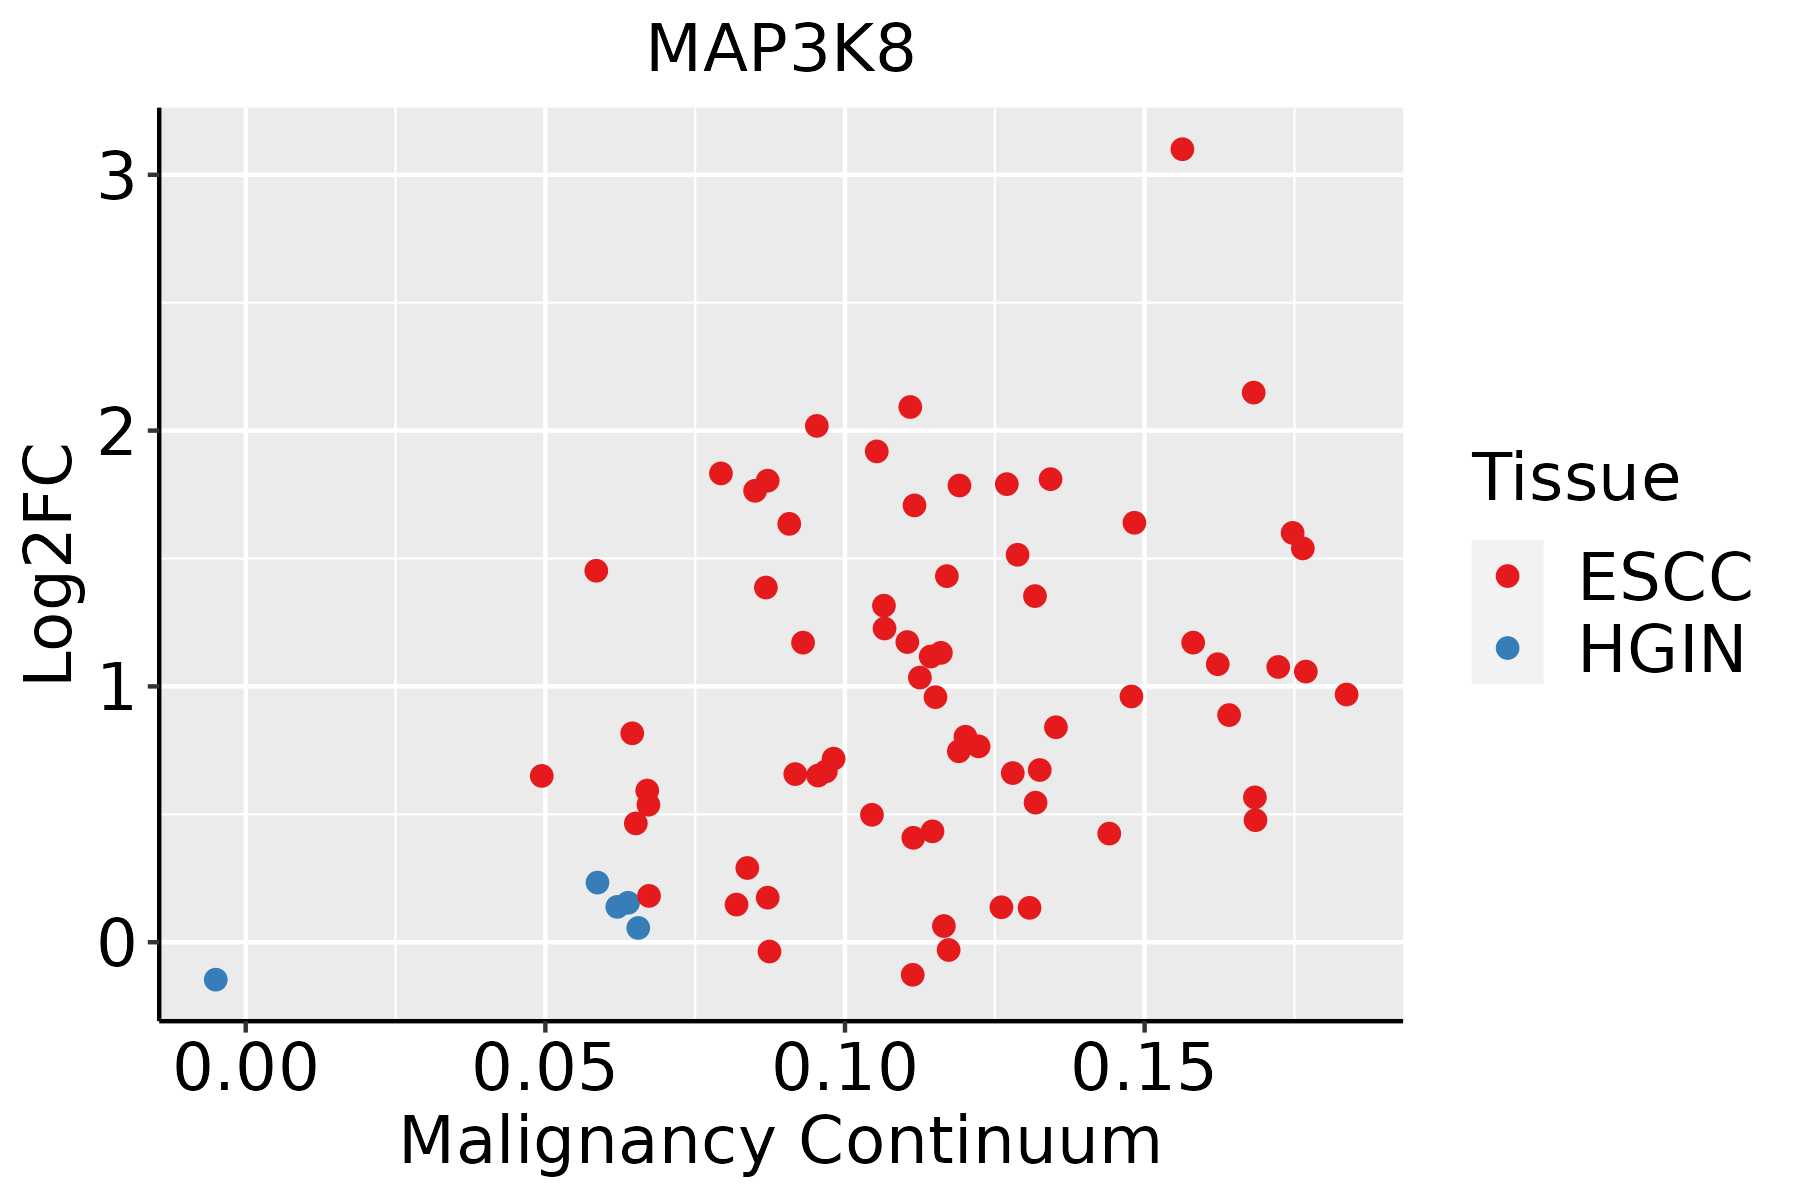 | ESCC: Esophageal squamous cell carcinoma |
| HGIN: High-grade intraepithelial neoplasias | ||
| LGIN: Low-grade intraepithelial neoplasias | ||
| Liver | 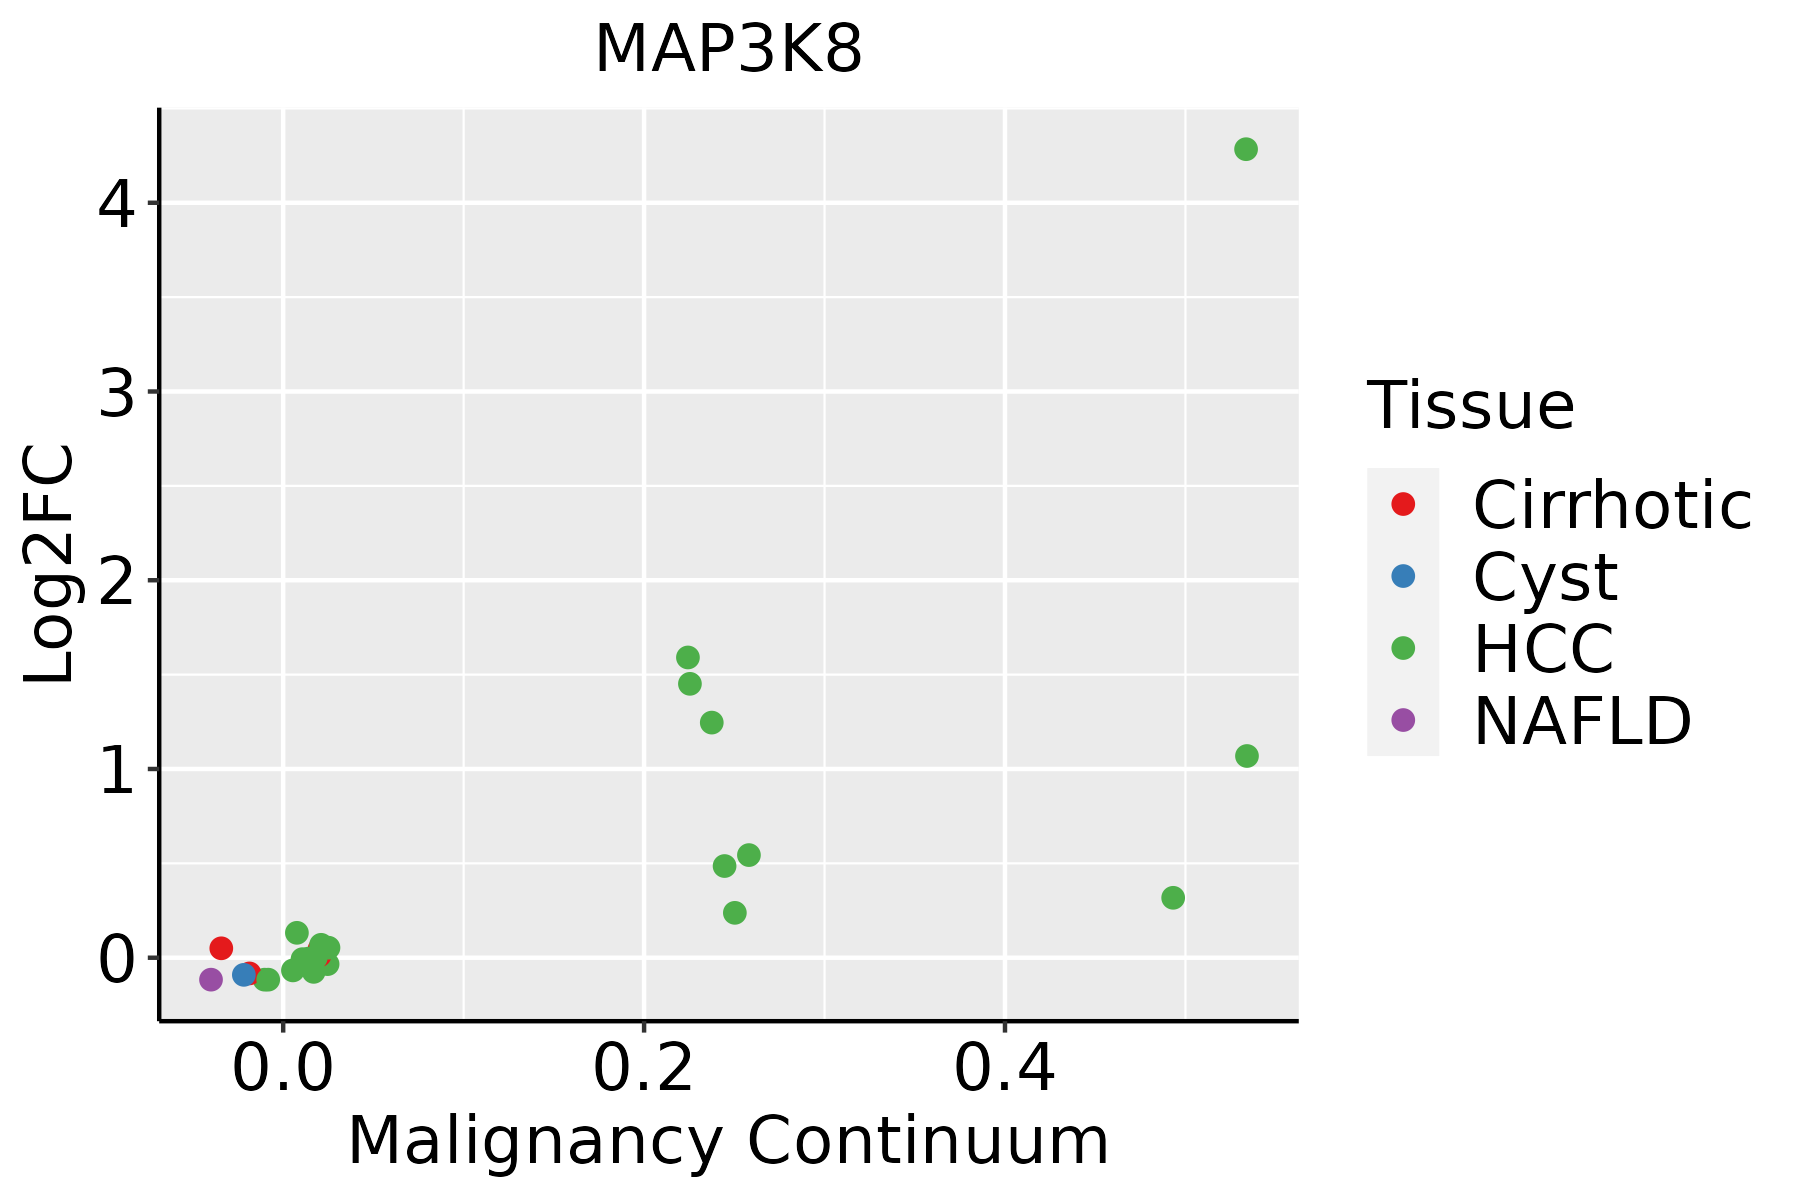 | HCC: Hepatocellular carcinoma |
| NAFLD: Non-alcoholic fatty liver disease | ||
| Oral Cavity | 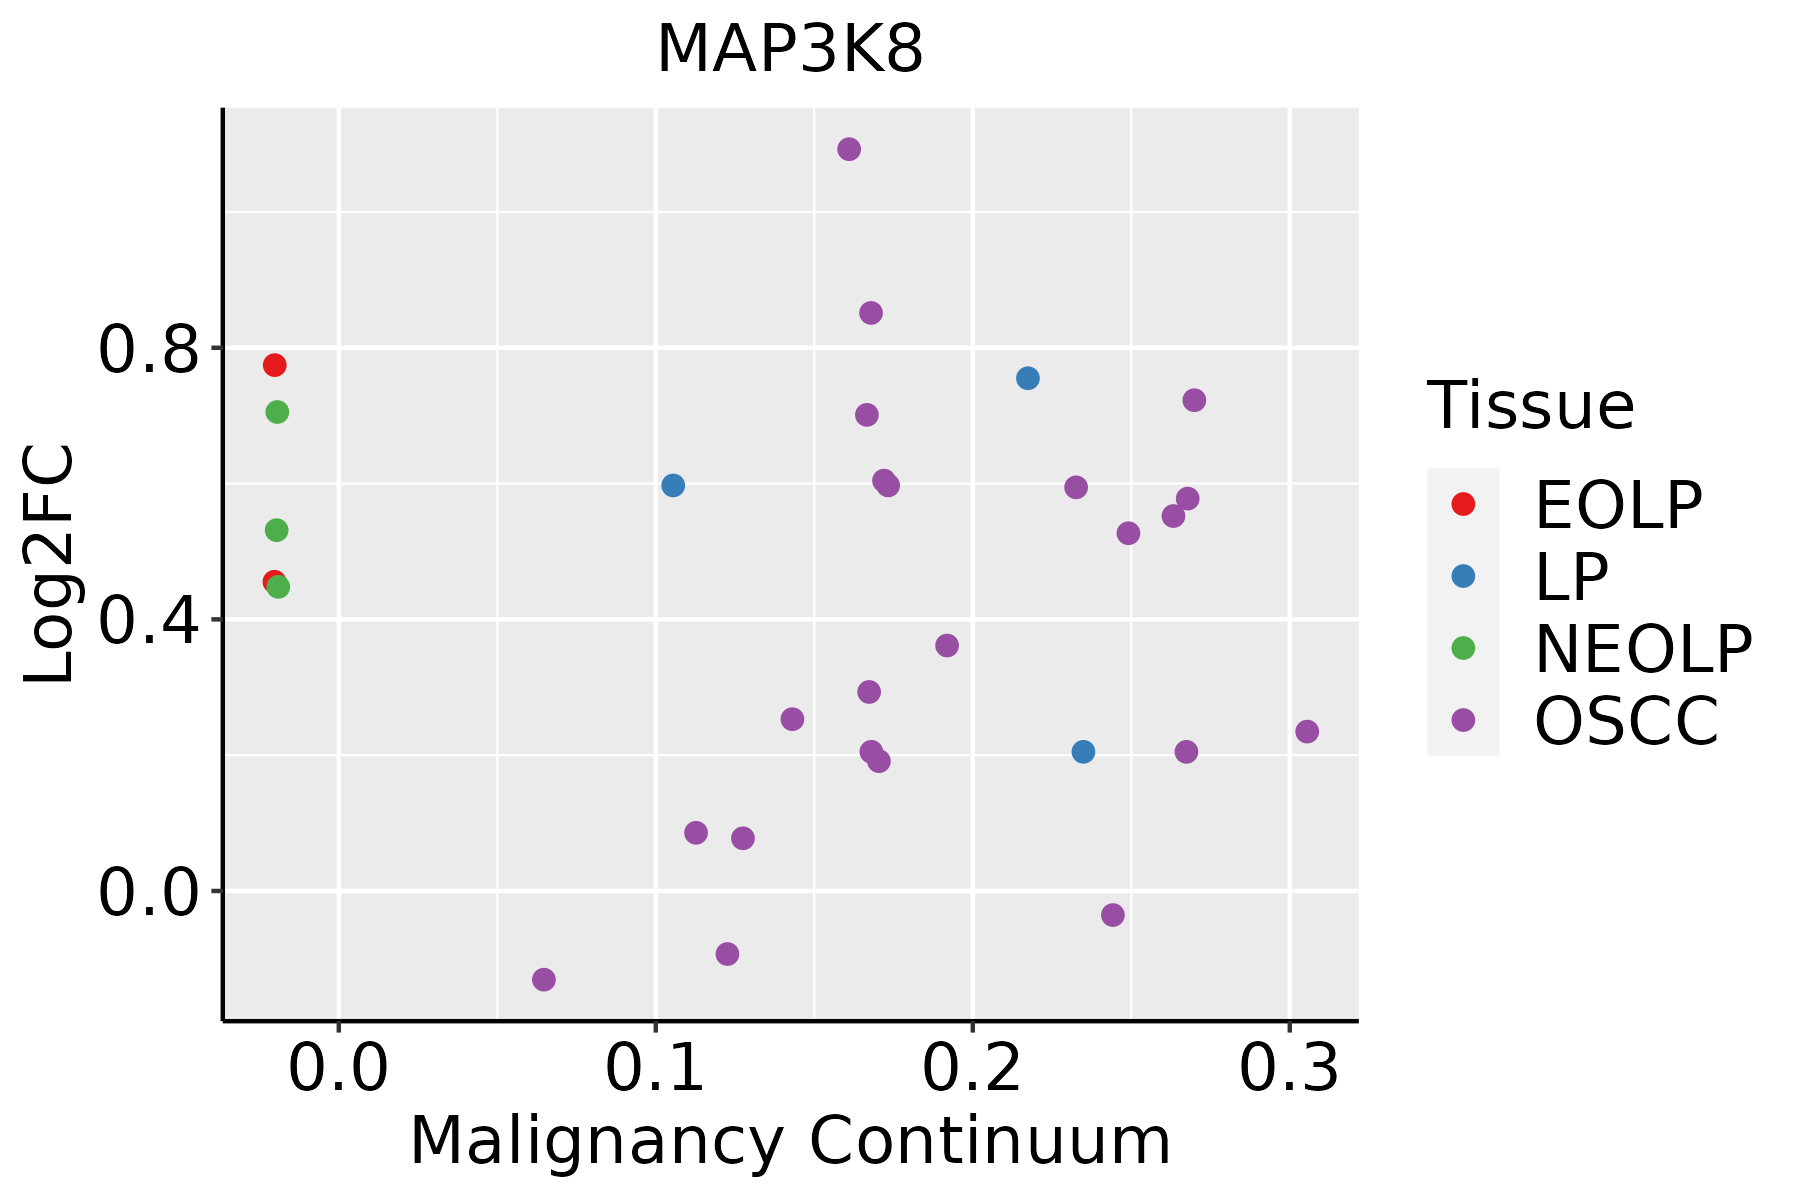 | EOLP: Erosive Oral lichen planus |
| LP: leukoplakia | ||
| NEOLP: Non-erosive oral lichen planus | ||
| OSCC: Oral squamous cell carcinoma |
| ∗log2FC in expression of this searched gene in stem-like cells from each diseased tissue sample relative to stem-like cells in normal samples in each tissue plotted against the malignancy continuum. Samples are colored based on if they are from different disease stage. |
Top |
Malignant transformation related pathway analysis |
| Find out the enriched GO biological processes and KEGG pathways involved in transition from healthy to precancer to cancer |
| Tissue | Disease Stage | Enriched GO biological Processes |
| Colorectum | AD |  |
| Colorectum | SER |  |
| Colorectum | MSS |  |
| Colorectum | MSI-H |  |
| Colorectum | FAP |  |
| ∗Top 15 enriched GO BP terms are showed in the bar plot of each disease state in each tissue. Each row represents a significant GO biological process which is colored according to the -log10(p.adjust). |
| Page: 1 2 3 4 5 6 7 8 9 |
| GO ID | Tissue | Disease Stage | Description | Gene Ratio | Bg Ratio | pvalue | p.adjust | Count |
| GO:004578516 | Endometrium | AEH | positive regulation of cell adhesion | 96/2100 | 437/18723 | 5.50e-11 | 7.18e-09 | 96 |
| GO:002240714 | Endometrium | AEH | regulation of cell-cell adhesion | 79/2100 | 448/18723 | 2.90e-05 | 5.40e-04 | 79 |
| GO:002240910 | Endometrium | AEH | positive regulation of cell-cell adhesion | 54/2100 | 284/18723 | 6.94e-05 | 1.07e-03 | 54 |
| GO:19030398 | Endometrium | AEH | positive regulation of leukocyte cell-cell adhesion | 46/2100 | 239/18723 | 1.72e-04 | 2.24e-03 | 46 |
| GO:00421109 | Endometrium | AEH | T cell activation | 81/2100 | 487/18723 | 1.78e-04 | 2.30e-03 | 81 |
| GO:00508709 | Endometrium | AEH | positive regulation of T cell activation | 41/2100 | 216/18723 | 5.08e-04 | 5.18e-03 | 41 |
| GO:00071599 | Endometrium | AEH | leukocyte cell-cell adhesion | 63/2100 | 371/18723 | 5.11e-04 | 5.21e-03 | 63 |
| GO:00508639 | Endometrium | AEH | regulation of T cell activation | 57/2100 | 329/18723 | 5.58e-04 | 5.59e-03 | 57 |
| GO:19030379 | Endometrium | AEH | regulation of leukocyte cell-cell adhesion | 57/2100 | 336/18723 | 9.42e-04 | 8.57e-03 | 57 |
| GO:004578517 | Endometrium | EEC | positive regulation of cell adhesion | 98/2168 | 437/18723 | 6.15e-11 | 8.38e-09 | 98 |
| GO:002240715 | Endometrium | EEC | regulation of cell-cell adhesion | 84/2168 | 448/18723 | 4.98e-06 | 1.24e-04 | 84 |
| GO:002240914 | Endometrium | EEC | positive regulation of cell-cell adhesion | 56/2168 | 284/18723 | 4.36e-05 | 7.15e-04 | 56 |
| GO:004211014 | Endometrium | EEC | T cell activation | 85/2168 | 487/18723 | 6.81e-05 | 1.01e-03 | 85 |
| GO:000715914 | Endometrium | EEC | leukocyte cell-cell adhesion | 67/2168 | 371/18723 | 1.41e-04 | 1.82e-03 | 67 |
| GO:190303913 | Endometrium | EEC | positive regulation of leukocyte cell-cell adhesion | 47/2168 | 239/18723 | 1.84e-04 | 2.26e-03 | 47 |
| GO:005086313 | Endometrium | EEC | regulation of T cell activation | 60/2168 | 329/18723 | 2.33e-04 | 2.75e-03 | 60 |
| GO:190303713 | Endometrium | EEC | regulation of leukocyte cell-cell adhesion | 60/2168 | 336/18723 | 4.13e-04 | 4.36e-03 | 60 |
| GO:005087013 | Endometrium | EEC | positive regulation of T cell activation | 42/2168 | 216/18723 | 5.03e-04 | 5.07e-03 | 42 |
| GO:004578527 | Esophagus | ESCC | positive regulation of cell adhesion | 255/8552 | 437/18723 | 5.07e-08 | 9.11e-07 | 255 |
| GO:002240720 | Esophagus | ESCC | regulation of cell-cell adhesion | 239/8552 | 448/18723 | 5.88e-04 | 3.19e-03 | 239 |
| Page: 1 2 3 |
| Pathway ID | Tissue | Disease Stage | Description | Gene Ratio | Bg Ratio | pvalue | p.adjust | qvalue | Count |
| hsa046687 | Endometrium | EEC | TNF signaling pathway | 27/1237 | 114/8465 | 6.47e-03 | 3.22e-02 | 2.40e-02 | 27 |
| hsa0466814 | Endometrium | EEC | TNF signaling pathway | 27/1237 | 114/8465 | 6.47e-03 | 3.22e-02 | 2.40e-02 | 27 |
| hsa0466810 | Esophagus | ESCC | TNF signaling pathway | 89/4205 | 114/8465 | 3.36e-10 | 4.01e-09 | 2.06e-09 | 89 |
| hsa046607 | Esophagus | ESCC | T cell receptor signaling pathway | 63/4205 | 104/8465 | 1.60e-02 | 3.60e-02 | 1.84e-02 | 63 |
| hsa0466817 | Esophagus | ESCC | TNF signaling pathway | 89/4205 | 114/8465 | 3.36e-10 | 4.01e-09 | 2.06e-09 | 89 |
| hsa0466013 | Esophagus | ESCC | T cell receptor signaling pathway | 63/4205 | 104/8465 | 1.60e-02 | 3.60e-02 | 1.84e-02 | 63 |
| hsa046684 | Liver | HCC | TNF signaling pathway | 73/4020 | 114/8465 | 2.53e-04 | 1.19e-03 | 6.63e-04 | 73 |
| hsa0466811 | Liver | HCC | TNF signaling pathway | 73/4020 | 114/8465 | 2.53e-04 | 1.19e-03 | 6.63e-04 | 73 |
| hsa046689 | Oral cavity | OSCC | TNF signaling pathway | 82/3704 | 114/8465 | 8.30e-10 | 9.59e-09 | 4.88e-09 | 82 |
| hsa046606 | Oral cavity | OSCC | T cell receptor signaling pathway | 67/3704 | 104/8465 | 1.57e-05 | 6.75e-05 | 3.44e-05 | 67 |
| hsa0401014 | Oral cavity | OSCC | MAPK signaling pathway | 165/3704 | 302/8465 | 7.11e-05 | 2.74e-04 | 1.40e-04 | 165 |
| hsa04620 | Oral cavity | OSCC | Toll-like receptor signaling pathway | 58/3704 | 104/8465 | 8.77e-03 | 1.98e-02 | 1.01e-02 | 58 |
| hsa0466816 | Oral cavity | OSCC | TNF signaling pathway | 82/3704 | 114/8465 | 8.30e-10 | 9.59e-09 | 4.88e-09 | 82 |
| hsa0466012 | Oral cavity | OSCC | T cell receptor signaling pathway | 67/3704 | 104/8465 | 1.57e-05 | 6.75e-05 | 3.44e-05 | 67 |
| hsa0401015 | Oral cavity | OSCC | MAPK signaling pathway | 165/3704 | 302/8465 | 7.11e-05 | 2.74e-04 | 1.40e-04 | 165 |
| hsa046201 | Oral cavity | OSCC | Toll-like receptor signaling pathway | 58/3704 | 104/8465 | 8.77e-03 | 1.98e-02 | 1.01e-02 | 58 |
| hsa0466021 | Oral cavity | EOLP | T cell receptor signaling pathway | 34/1218 | 104/8465 | 1.63e-06 | 1.39e-05 | 8.18e-06 | 34 |
| hsa0466841 | Oral cavity | EOLP | TNF signaling pathway | 35/1218 | 114/8465 | 5.79e-06 | 3.67e-05 | 2.16e-05 | 35 |
| hsa0401023 | Oral cavity | EOLP | MAPK signaling pathway | 68/1218 | 302/8465 | 7.48e-05 | 3.40e-04 | 2.01e-04 | 68 |
| hsa0466031 | Oral cavity | EOLP | T cell receptor signaling pathway | 34/1218 | 104/8465 | 1.63e-06 | 1.39e-05 | 8.18e-06 | 34 |
| Page: 1 2 |
Top |
Cell-cell communication analysis |
| Identification of potential cell-cell interactions between two cell types and their ligand-receptor pairs for different disease states |
| Ligand | Receptor | LRpair | Pathway | Tissue | Disease Stage |
| Page: 1 |
Top |
Single-cell gene regulatory network inference analysis |
| Find out the significant the regulons (TFs) and the target genes of each regulon across cell types for different disease states |
| TF | Cell Type | Tissue | Disease Stage | Target Gene | RSS | Regulon Activity |
| ∗The dot plots of a searched regulon are shown for all cell subpopulations in each disease state of each tissue based on the regulon specific score inferred using pySCENIC and by calculating the average expression. |
| Page: 1 |
Top |
Somatic mutation of malignant transformation related genes |
| Annotation of somatic variants for genes involved in malignant transformation |
| Hugo Symbol | Variant Class | Variant Classification | dbSNP RS | HGVSc | HGVSp | HGVSp Short | SWISSPROT | BIOTYPE | SIFT | PolyPhen | Tumor Sample Barcode | Tissue | Histology | Sex | Age | Stage | Therapy Types | Drugs | Outcome |
| MAP3K8 | SNV | Missense_Mutation | novel | c.497N>T | p.Cys166Phe | p.C166F | P41279 | protein_coding | deleterious(0) | probably_damaging(0.996) | TCGA-AC-A3QP-01 | Breast | breast invasive carcinoma | Female | >=65 | I/II | Hormone Therapy | femara | SD |
| MAP3K8 | SNV | Missense_Mutation | c.275N>G | p.Ser92Cys | p.S92C | P41279 | protein_coding | deleterious_low_confidence(0) | possibly_damaging(0.819) | TCGA-AN-A0AR-01 | Breast | breast invasive carcinoma | Female | <65 | I/II | Unknown | Unknown | SD | |
| MAP3K8 | SNV | Missense_Mutation | c.905N>T | p.Arg302Met | p.R302M | P41279 | protein_coding | deleterious(0.01) | probably_damaging(0.998) | TCGA-BH-A0HA-01 | Breast | breast invasive carcinoma | Female | <65 | I/II | Unknown | Unknown | SD | |
| MAP3K8 | insertion | Frame_Shift_Ins | novel | c.429_430insGTATGTTTAGTAGAGATGGGTTTTC | p.Ile144ValfsTer32 | p.I144Vfs*32 | P41279 | protein_coding | TCGA-AO-A0JB-01 | Breast | breast invasive carcinoma | Female | <65 | III/IV | Chemotherapy | cyclophosphamide | SD | ||
| MAP3K8 | insertion | Nonsense_Mutation | novel | c.574_575insCAATTAATTACTCATGAGTAGGTGGAAATATGACCAGGTCTGACC | p.Glu192delinsAlaIleAsnTyrSerTerValGlyGlyAsnMetThrArgSerAspGln | p.E192delinsAINYS*VGGNMTRSDQ | P41279 | protein_coding | TCGA-BH-A0AY-01 | Breast | breast invasive carcinoma | Female | <65 | I/II | Chemotherapy | SD | |||
| MAP3K8 | insertion | In_Frame_Ins | novel | c.216_217insCGCAAGCGAGCGGGGCTTCTCCTCCCCAACCCCGGCCCAGGC | p.Trp72_Leu73insArgLysArgAlaGlyLeuLeuLeuProAsnProGlyProGly | p.W72_L73insRKRAGLLLPNPGPG | P41279 | protein_coding | TCGA-BH-A0BD-01 | Breast | breast invasive carcinoma | Female | <65 | I/II | Chemotherapy | doxorubicin | SD | ||
| MAP3K8 | SNV | Missense_Mutation | c.1063G>C | p.Asp355His | p.D355H | P41279 | protein_coding | deleterious(0) | benign(0.21) | TCGA-DR-A0ZM-01 | Cervix | cervical & endocervical cancer | Female | <65 | III/IV | Unspecific | Cisplatin | SD | |
| MAP3K8 | SNV | Missense_Mutation | novel | c.172N>A | p.Glu58Lys | p.E58K | P41279 | protein_coding | deleterious_low_confidence(0.01) | benign(0.14) | TCGA-HM-A4S6-01 | Cervix | cervical & endocervical cancer | Female | <65 | III/IV | Chemotherapy | cisplatin | CR |
| MAP3K8 | SNV | Missense_Mutation | novel | c.71N>G | p.Ser24Cys | p.S24C | P41279 | protein_coding | deleterious_low_confidence(0.02) | possibly_damaging(0.903) | TCGA-VS-A9UC-01 | Cervix | cervical & endocervical cancer | Female | <65 | I/II | Chemotherapy | cisplatin | SD |
| MAP3K8 | SNV | Missense_Mutation | c.751N>A | p.His251Asn | p.H251N | P41279 | protein_coding | deleterious(0) | probably_damaging(0.992) | TCGA-A6-5661-01 | Colorectum | colon adenocarcinoma | Female | >=65 | I/II | Unknown | Unknown | SD |
| Page: 1 2 3 4 5 6 |
Top |
Related drugs of malignant transformation related genes |
| Identification of chemicals and drugs interact with genes involved in malignant transfromation |
| (DGIdb 4.0) |
| Entrez ID | Symbol | Category | Interaction Types | Drug Claim Name | Drug Name | PMIDs |
| 1326 | MAP3K8 | SERINE THREONINE KINASE, KINASE, ENZYME, DRUGGABLE GENOME | inhibitor | 178102629 | ||
| 1326 | MAP3K8 | SERINE THREONINE KINASE, KINASE, ENZYME, DRUGGABLE GENOME | inhibitor | 178102673 |
| Page: 1 |

Copyright 2023-Present -The University of Texas Health Science Center at Houston |