
|
|||||
|
 | |
| |
| |
| |
| |
| |
|
Gene: MAP3K7 |
Gene summary for MAP3K7 |
| Gene information | Species | Human | Gene symbol | MAP3K7 | Gene ID | 6885 |
| Gene name | mitogen-activated protein kinase kinase kinase 7 | |
| Gene Alias | CSCF | |
| Cytomap | 6q15 | |
| Gene Type | protein-coding | GO ID | GO:0000165 | UniProtAcc | O43318 |
Top |
Malignant transformation analysis |
| Identification of the aberrant gene expression in precancerous and cancerous lesions by comparing the gene expression of stem-like cells in diseased tissues with normal stem cells |
| Entrez ID | Symbol | Replicates | Species | Organ | Tissue | Adj P-value | Log2FC | Malignancy |
| 6885 | MAP3K7 | LZE4T | Human | Esophagus | ESCC | 1.54e-07 | 2.39e-01 | 0.0811 |
| 6885 | MAP3K7 | LZE7T | Human | Esophagus | ESCC | 5.56e-09 | 3.83e-01 | 0.0667 |
| 6885 | MAP3K7 | LZE8T | Human | Esophagus | ESCC | 1.02e-04 | 1.33e-01 | 0.067 |
| 6885 | MAP3K7 | LZE20T | Human | Esophagus | ESCC | 3.39e-04 | 1.62e-01 | 0.0662 |
| 6885 | MAP3K7 | LZE24T | Human | Esophagus | ESCC | 1.15e-13 | 3.60e-01 | 0.0596 |
| 6885 | MAP3K7 | LZE21T | Human | Esophagus | ESCC | 3.07e-02 | 2.44e-01 | 0.0655 |
| 6885 | MAP3K7 | P2T-E | Human | Esophagus | ESCC | 2.65e-18 | 3.59e-01 | 0.1177 |
| 6885 | MAP3K7 | P4T-E | Human | Esophagus | ESCC | 2.15e-13 | 2.74e-01 | 0.1323 |
| 6885 | MAP3K7 | P5T-E | Human | Esophagus | ESCC | 5.59e-12 | 1.35e-01 | 0.1327 |
| 6885 | MAP3K7 | P8T-E | Human | Esophagus | ESCC | 1.07e-13 | 2.81e-01 | 0.0889 |
| 6885 | MAP3K7 | P9T-E | Human | Esophagus | ESCC | 6.14e-04 | 1.43e-01 | 0.1131 |
| 6885 | MAP3K7 | P10T-E | Human | Esophagus | ESCC | 6.82e-20 | 3.22e-01 | 0.116 |
| 6885 | MAP3K7 | P11T-E | Human | Esophagus | ESCC | 2.60e-15 | 5.18e-01 | 0.1426 |
| 6885 | MAP3K7 | P12T-E | Human | Esophagus | ESCC | 8.10e-15 | 3.96e-01 | 0.1122 |
| 6885 | MAP3K7 | P15T-E | Human | Esophagus | ESCC | 1.07e-16 | 3.27e-01 | 0.1149 |
| 6885 | MAP3K7 | P16T-E | Human | Esophagus | ESCC | 9.28e-25 | 5.40e-01 | 0.1153 |
| 6885 | MAP3K7 | P17T-E | Human | Esophagus | ESCC | 2.88e-06 | 3.51e-01 | 0.1278 |
| 6885 | MAP3K7 | P19T-E | Human | Esophagus | ESCC | 4.06e-09 | 4.13e-01 | 0.1662 |
| 6885 | MAP3K7 | P20T-E | Human | Esophagus | ESCC | 3.32e-06 | 1.06e-01 | 0.1124 |
| 6885 | MAP3K7 | P21T-E | Human | Esophagus | ESCC | 4.24e-19 | 4.80e-01 | 0.1617 |
| Page: 1 2 3 4 5 6 |
| Tissue | Expression Dynamics | Abbreviation |
| Esophagus | 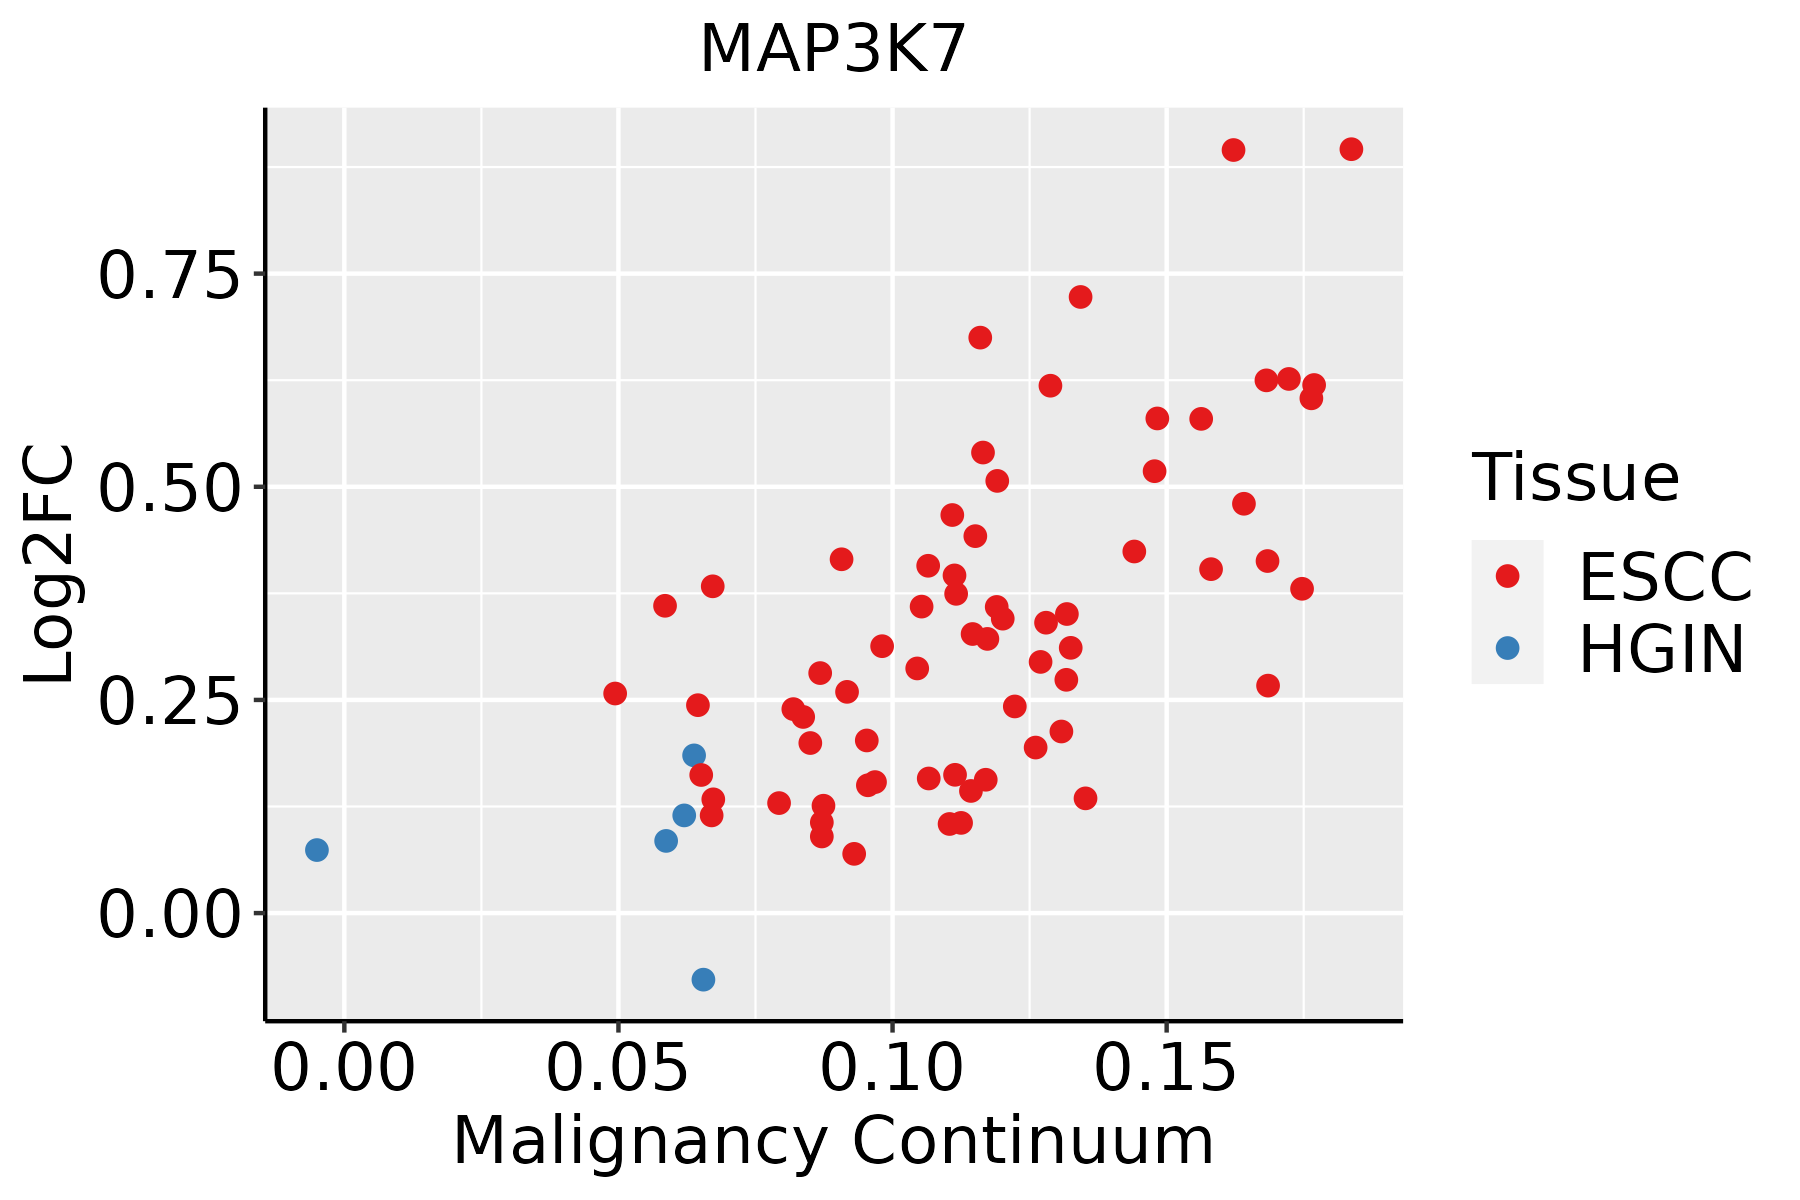 | ESCC: Esophageal squamous cell carcinoma |
| HGIN: High-grade intraepithelial neoplasias | ||
| LGIN: Low-grade intraepithelial neoplasias | ||
| Liver |  | HCC: Hepatocellular carcinoma |
| NAFLD: Non-alcoholic fatty liver disease | ||
| Oral Cavity | 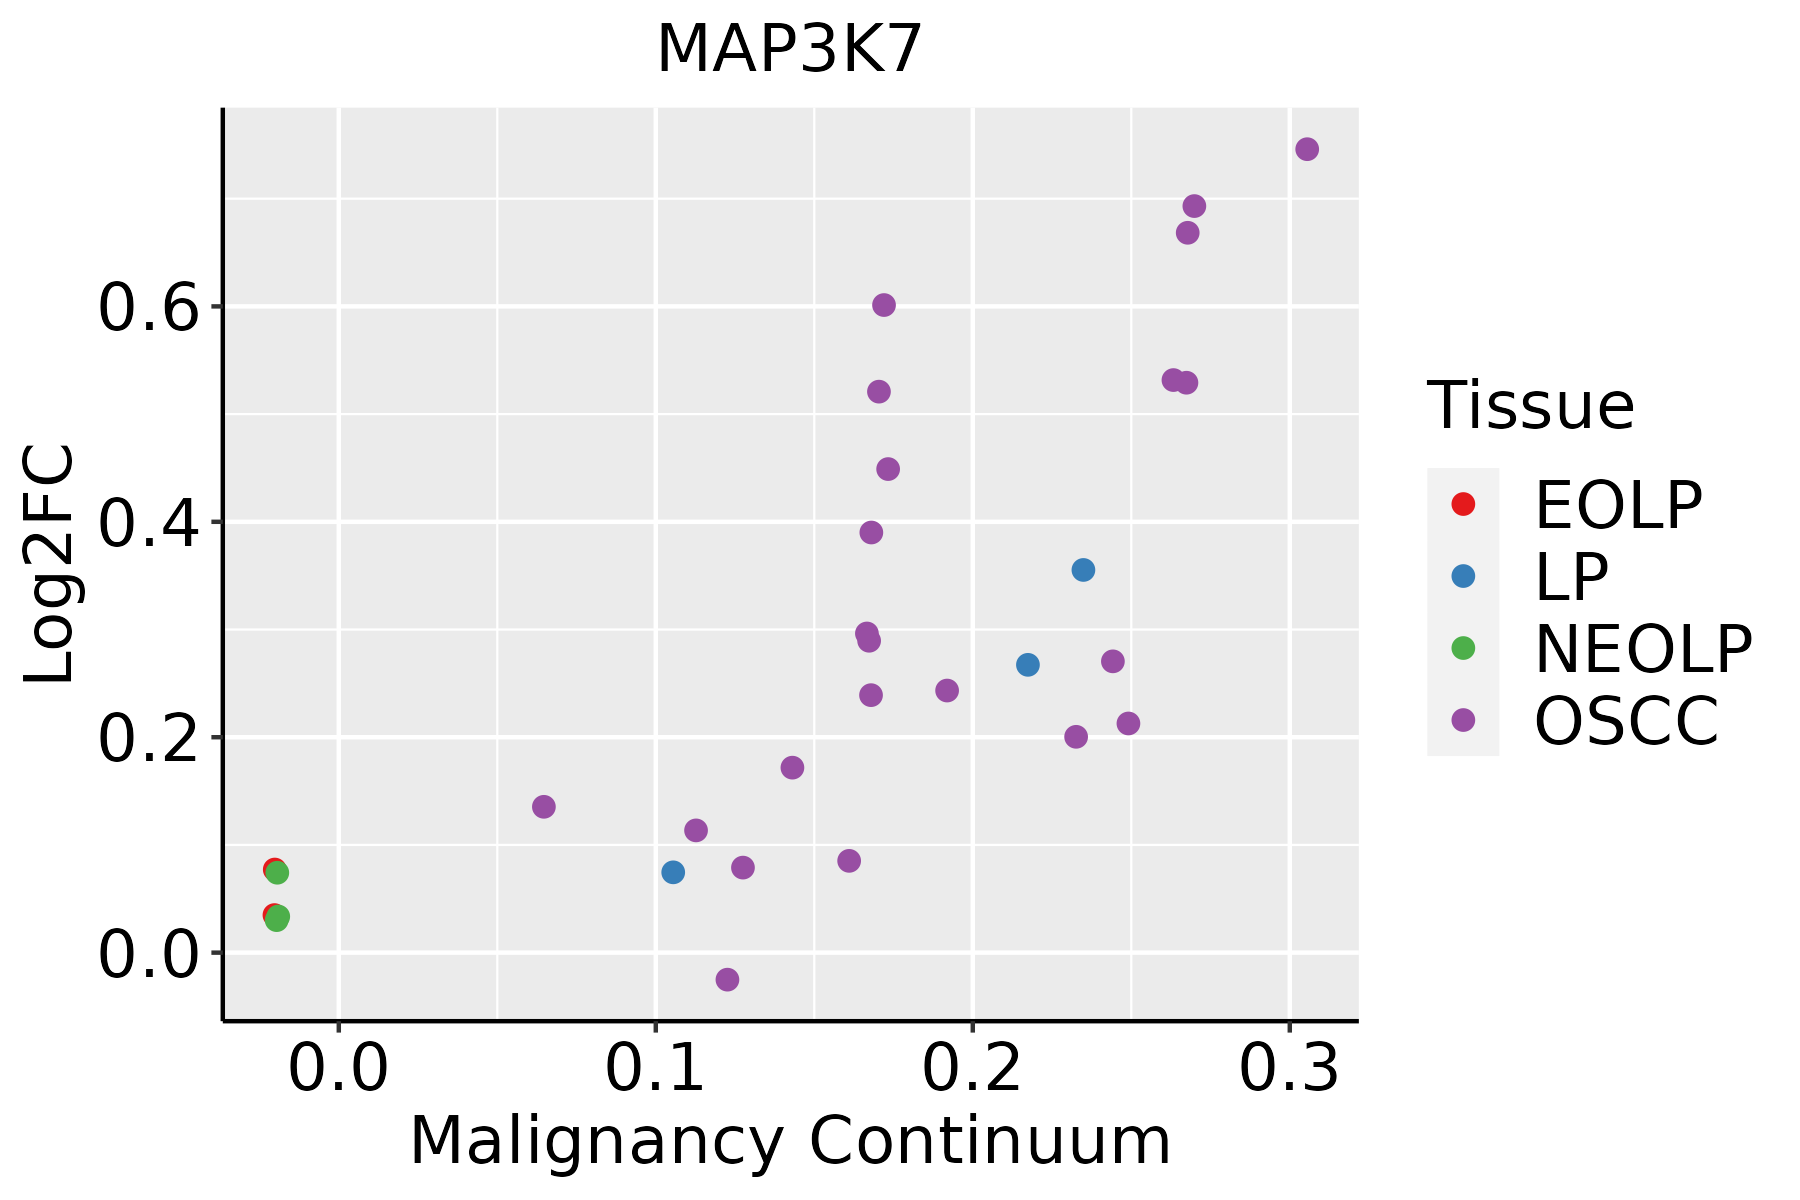 | EOLP: Erosive Oral lichen planus |
| LP: leukoplakia | ||
| NEOLP: Non-erosive oral lichen planus | ||
| OSCC: Oral squamous cell carcinoma | ||
| Skin |  | AK: Actinic keratosis |
| cSCC: Cutaneous squamous cell carcinoma | ||
| SCCIS:squamous cell carcinoma in situ | ||
| Thyroid |  | ATC: Anaplastic thyroid cancer |
| HT: Hashimoto's thyroiditis | ||
| PTC: Papillary thyroid cancer |
| ∗log2FC in expression of this searched gene in stem-like cells from each diseased tissue sample relative to stem-like cells in normal samples in each tissue plotted against the malignancy continuum. Samples are colored based on if they are from different disease stage. |
Top |
Malignant transformation related pathway analysis |
| Find out the enriched GO biological processes and KEGG pathways involved in transition from healthy to precancer to cancer |
| Tissue | Disease Stage | Enriched GO biological Processes |
| Colorectum | AD |  |
| Colorectum | SER |  |
| Colorectum | MSS |  |
| Colorectum | MSI-H |  |
| Colorectum | FAP |  |
| ∗Top 15 enriched GO BP terms are showed in the bar plot of each disease state in each tissue. Each row represents a significant GO biological process which is colored according to the -log10(p.adjust). |
| Page: 1 2 3 4 5 6 7 8 9 |
| GO ID | Tissue | Disease Stage | Description | Gene Ratio | Bg Ratio | pvalue | p.adjust | Count |
| GO:001657015 | Esophagus | ESCC | histone modification | 323/8552 | 463/18723 | 2.61e-26 | 7.88e-24 | 323 |
| GO:001623617 | Esophagus | ESCC | macroautophagy | 216/8552 | 291/18723 | 1.94e-23 | 4.57e-21 | 216 |
| GO:0009896111 | Esophagus | ESCC | positive regulation of catabolic process | 332/8552 | 492/18723 | 4.36e-23 | 9.22e-21 | 332 |
| GO:0031331111 | Esophagus | ESCC | positive regulation of cellular catabolic process | 292/8552 | 427/18723 | 8.67e-22 | 1.53e-19 | 292 |
| GO:001820514 | Esophagus | ESCC | peptidyl-lysine modification | 259/8552 | 376/18723 | 3.90e-20 | 5.26e-18 | 259 |
| GO:001050617 | Esophagus | ESCC | regulation of autophagy | 220/8552 | 317/18723 | 6.72e-18 | 6.36e-16 | 220 |
| GO:001839413 | Esophagus | ESCC | peptidyl-lysine acetylation | 123/8552 | 169/18723 | 6.58e-13 | 2.94e-11 | 123 |
| GO:004354313 | Esophagus | ESCC | protein acylation | 165/8552 | 243/18723 | 1.69e-12 | 7.14e-11 | 165 |
| GO:004312318 | Esophagus | ESCC | positive regulation of I-kappaB kinase/NF-kappaB signaling | 132/8552 | 186/18723 | 2.07e-12 | 8.58e-11 | 132 |
| GO:000647313 | Esophagus | ESCC | protein acetylation | 140/8552 | 201/18723 | 4.37e-12 | 1.69e-10 | 140 |
| GO:0043122110 | Esophagus | ESCC | regulation of I-kappaB kinase/NF-kappaB signaling | 167/8552 | 249/18723 | 6.11e-12 | 2.32e-10 | 167 |
| GO:007190016 | Esophagus | ESCC | regulation of protein serine/threonine kinase activity | 227/8552 | 359/18723 | 1.12e-11 | 4.10e-10 | 227 |
| GO:001839313 | Esophagus | ESCC | internal peptidyl-lysine acetylation | 114/8552 | 158/18723 | 1.16e-11 | 4.24e-10 | 114 |
| GO:000647513 | Esophagus | ESCC | internal protein amino acid acetylation | 115/8552 | 160/18723 | 1.43e-11 | 5.08e-10 | 115 |
| GO:00165735 | Esophagus | ESCC | histone acetylation | 110/8552 | 152/18723 | 1.95e-11 | 6.81e-10 | 110 |
| GO:000724919 | Esophagus | ESCC | I-kappaB kinase/NF-kappaB signaling | 183/8552 | 281/18723 | 3.02e-11 | 1.01e-09 | 183 |
| GO:001624114 | Esophagus | ESCC | regulation of macroautophagy | 102/8552 | 141/18723 | 1.09e-10 | 3.27e-09 | 102 |
| GO:0030522110 | Esophagus | ESCC | intracellular receptor signaling pathway | 170/8552 | 265/18723 | 8.58e-10 | 2.09e-08 | 170 |
| GO:003109818 | Esophagus | ESCC | stress-activated protein kinase signaling cascade | 154/8552 | 247/18723 | 8.53e-08 | 1.44e-06 | 154 |
| GO:00715599 | Esophagus | ESCC | response to transforming growth factor beta | 157/8552 | 256/18723 | 2.95e-07 | 4.23e-06 | 157 |
| Page: 1 2 3 4 5 6 7 8 9 10 11 12 13 14 15 16 |
| Pathway ID | Tissue | Disease Stage | Description | Gene Ratio | Bg Ratio | pvalue | p.adjust | qvalue | Count |
| hsa05132211 | Esophagus | ESCC | Salmonella infection | 191/4205 | 249/8465 | 6.51e-19 | 5.45e-17 | 2.79e-17 | 191 |
| hsa05169210 | Esophagus | ESCC | Epstein-Barr virus infection | 151/4205 | 202/8465 | 1.55e-13 | 3.45e-12 | 1.77e-12 | 151 |
| hsa05418211 | Esophagus | ESCC | Fluid shear stress and atherosclerosis | 109/4205 | 139/8465 | 2.00e-12 | 3.72e-11 | 1.90e-11 | 109 |
| hsa05131211 | Esophagus | ESCC | Shigellosis | 176/4205 | 247/8465 | 2.27e-12 | 4.01e-11 | 2.05e-11 | 176 |
| hsa05130211 | Esophagus | ESCC | Pathogenic Escherichia coli infection | 142/4205 | 197/8465 | 8.21e-11 | 1.06e-09 | 5.42e-10 | 142 |
| hsa0466810 | Esophagus | ESCC | TNF signaling pathway | 89/4205 | 114/8465 | 3.36e-10 | 4.01e-09 | 2.06e-09 | 89 |
| hsa05170210 | Esophagus | ESCC | Human immunodeficiency virus 1 infection | 147/4205 | 212/8465 | 3.37e-09 | 3.53e-08 | 1.81e-08 | 147 |
| hsa0513526 | Esophagus | ESCC | Yersinia infection | 100/4205 | 137/8465 | 1.80e-08 | 1.59e-07 | 8.12e-08 | 100 |
| hsa05171211 | Esophagus | ESCC | Coronavirus disease - COVID-19 | 156/4205 | 232/8465 | 3.18e-08 | 2.68e-07 | 1.37e-07 | 156 |
| hsa0414010 | Esophagus | ESCC | Autophagy - animal | 101/4205 | 141/8465 | 7.60e-08 | 6.21e-07 | 3.18e-07 | 101 |
| hsa05417211 | Esophagus | ESCC | Lipid and atherosclerosis | 143/4205 | 215/8465 | 3.30e-07 | 2.45e-06 | 1.26e-06 | 143 |
| hsa0452030 | Esophagus | ESCC | Adherens junction | 69/4205 | 93/8465 | 1.08e-06 | 6.83e-06 | 3.50e-06 | 69 |
| hsa051619 | Esophagus | ESCC | Hepatitis B | 108/4205 | 162/8465 | 7.68e-06 | 4.15e-05 | 2.12e-05 | 108 |
| hsa0465727 | Esophagus | ESCC | IL-17 signaling pathway | 66/4205 | 94/8465 | 3.93e-05 | 1.75e-04 | 8.99e-05 | 66 |
| hsa0514525 | Esophagus | ESCC | Toxoplasmosis | 76/4205 | 112/8465 | 6.83e-05 | 2.90e-04 | 1.48e-04 | 76 |
| hsa0415210 | Esophagus | ESCC | AMPK signaling pathway | 80/4205 | 121/8465 | 1.73e-04 | 6.67e-04 | 3.42e-04 | 80 |
| hsa051629 | Esophagus | ESCC | Measles | 90/4205 | 139/8465 | 2.16e-04 | 7.87e-04 | 4.03e-04 | 90 |
| hsa0462122 | Esophagus | ESCC | NOD-like receptor signaling pathway | 116/4205 | 186/8465 | 2.90e-04 | 1.03e-03 | 5.30e-04 | 116 |
| hsa040645 | Esophagus | ESCC | NF-kappa B signaling pathway | 67/4205 | 104/8465 | 1.62e-03 | 4.89e-03 | 2.50e-03 | 67 |
| hsa046607 | Esophagus | ESCC | T cell receptor signaling pathway | 63/4205 | 104/8465 | 1.60e-02 | 3.60e-02 | 1.84e-02 | 63 |
| Page: 1 2 3 4 5 6 7 |
Top |
Cell-cell communication analysis |
| Identification of potential cell-cell interactions between two cell types and their ligand-receptor pairs for different disease states |
| Ligand | Receptor | LRpair | Pathway | Tissue | Disease Stage |
| Page: 1 |
Top |
Single-cell gene regulatory network inference analysis |
| Find out the significant the regulons (TFs) and the target genes of each regulon across cell types for different disease states |
| TF | Cell Type | Tissue | Disease Stage | Target Gene | RSS | Regulon Activity |
| ∗The dot plots of a searched regulon are shown for all cell subpopulations in each disease state of each tissue based on the regulon specific score inferred using pySCENIC and by calculating the average expression. |
| Page: 1 |
Top |
Somatic mutation of malignant transformation related genes |
| Annotation of somatic variants for genes involved in malignant transformation |
| Hugo Symbol | Variant Class | Variant Classification | dbSNP RS | HGVSc | HGVSp | HGVSp Short | SWISSPROT | BIOTYPE | SIFT | PolyPhen | Tumor Sample Barcode | Tissue | Histology | Sex | Age | Stage | Therapy Types | Drugs | Outcome |
| MAP3K7 | SNV | Missense_Mutation | rs758224984 | c.821G>A | p.Arg274His | p.R274H | O43318 | protein_coding | deleterious(0) | probably_damaging(1) | TCGA-AN-A046-01 | Breast | breast invasive carcinoma | Female | >=65 | I/II | Unknown | Unknown | SD |
| MAP3K7 | SNV | Missense_Mutation | c.919G>A | p.Glu307Lys | p.E307K | O43318 | protein_coding | tolerated(0.22) | benign(0.013) | TCGA-BH-A0DZ-01 | Breast | breast invasive carcinoma | Female | <65 | I/II | Chemotherapy | docetaxel | SD | |
| MAP3K7 | SNV | Missense_Mutation | novel | c.1745N>G | p.Ser582Cys | p.S582C | O43318 | protein_coding | tolerated(0.08) | possibly_damaging(0.908) | TCGA-LD-A74U-01 | Breast | breast invasive carcinoma | Female | >=65 | III/IV | Chemotherapy | taxotere | SD |
| MAP3K7 | insertion | Frame_Shift_Ins | novel | c.1670_1671insAAATAAACAA | p.Asp557GlufsTer5 | p.D557Efs*5 | O43318 | protein_coding | TCGA-AR-A0U0-01 | Breast | breast invasive carcinoma | Female | >=65 | I/II | Unknown | Unknown | SD | ||
| MAP3K7 | SNV | Missense_Mutation | c.217N>T | p.Ala73Ser | p.A73S | O43318 | protein_coding | deleterious(0) | benign(0.176) | TCGA-AA-3710-01 | Colorectum | colon adenocarcinoma | Female | >=65 | I/II | Unknown | Unknown | SD | |
| MAP3K7 | SNV | Missense_Mutation | c.49N>A | p.Glu17Lys | p.E17K | O43318 | protein_coding | tolerated_low_confidence(0.15) | benign(0.017) | TCGA-AZ-6599-01 | Colorectum | colon adenocarcinoma | Male | >=65 | I/II | Unknown | Unknown | SD | |
| MAP3K7 | SNV | Missense_Mutation | c.1754A>G | p.Tyr585Cys | p.Y585C | O43318 | protein_coding | tolerated(0.27) | benign(0) | TCGA-CK-5913-01 | Colorectum | colon adenocarcinoma | Female | <65 | I/II | Unknown | Unknown | SD | |
| MAP3K7 | SNV | Missense_Mutation | rs762121500 | c.1237N>T | p.Arg413Cys | p.R413C | O43318 | protein_coding | deleterious(0.05) | probably_damaging(0.973) | TCGA-F4-6807-01 | Colorectum | colon adenocarcinoma | Female | <65 | III/IV | Chemotherapy | xeloda | CR |
| MAP3K7 | SNV | Missense_Mutation | novel | c.197N>G | p.Glu66Gly | p.E66G | O43318 | protein_coding | deleterious(0) | benign(0.25) | TCGA-AG-A002-01 | Colorectum | rectum adenocarcinoma | Male | <65 | I/II | Unknown | Unknown | SD |
| MAP3K7 | SNV | Missense_Mutation | c.673C>T | p.Arg225Cys | p.R225C | O43318 | protein_coding | deleterious(0.02) | probably_damaging(0.963) | TCGA-A5-A0VP-01 | Endometrium | uterine corpus endometrioid carcinoma | Female | >=65 | I/II | Unknown | Unknown | SD |
| Page: 1 2 3 4 5 6 7 |
Top |
Related drugs of malignant transformation related genes |
| Identification of chemicals and drugs interact with genes involved in malignant transfromation |
| (DGIdb 4.0) |
| Entrez ID | Symbol | Category | Interaction Types | Drug Claim Name | Drug Name | PMIDs |
| 6885 | MAP3K7 | ENZYME, SERINE THREONINE KINASE, KINASE, DRUGGABLE GENOME, CLINICALLY ACTIONABLE, TRANSCRIPTION FACTOR | inhibitor | 329968393 | ||
| 6885 | MAP3K7 | ENZYME, SERINE THREONINE KINASE, KINASE, DRUGGABLE GENOME, CLINICALLY ACTIONABLE, TRANSCRIPTION FACTOR | inhibitor | 223366077 | RGB-286638 | |
| 6885 | MAP3K7 | ENZYME, SERINE THREONINE KINASE, KINASE, DRUGGABLE GENOME, CLINICALLY ACTIONABLE, TRANSCRIPTION FACTOR | inhibitor | 348353658 | ||
| 6885 | MAP3K7 | ENZYME, SERINE THREONINE KINASE, KINASE, DRUGGABLE GENOME, CLINICALLY ACTIONABLE, TRANSCRIPTION FACTOR | inhibitor | 249565754 | ||
| 6885 | MAP3K7 | ENZYME, SERINE THREONINE KINASE, KINASE, DRUGGABLE GENOME, CLINICALLY ACTIONABLE, TRANSCRIPTION FACTOR | inhibitor | 348353615 | ||
| 6885 | MAP3K7 | ENZYME, SERINE THREONINE KINASE, KINASE, DRUGGABLE GENOME, CLINICALLY ACTIONABLE, TRANSCRIPTION FACTOR | inhibitor | 249565876 | ||
| 6885 | MAP3K7 | ENZYME, SERINE THREONINE KINASE, KINASE, DRUGGABLE GENOME, CLINICALLY ACTIONABLE, TRANSCRIPTION FACTOR | inhibitor | 249565757 | CHEMBL1077979 | |
| 6885 | MAP3K7 | ENZYME, SERINE THREONINE KINASE, KINASE, DRUGGABLE GENOME, CLINICALLY ACTIONABLE, TRANSCRIPTION FACTOR | inhibitor | 348353659 | ||
| 6885 | MAP3K7 | ENZYME, SERINE THREONINE KINASE, KINASE, DRUGGABLE GENOME, CLINICALLY ACTIONABLE, TRANSCRIPTION FACTOR | inhibitor | 249565869 | CEP-11981 |
| Page: 1 |

Copyright 2023-Present -The University of Texas Health Science Center at Houston |