
|
|||||
|
 | |
| |
| |
| |
| |
| |
|
Gene: MAP3K21 |
Gene summary for MAP3K21 |
| Gene information | Species | Human | Gene symbol | MAP3K21 | Gene ID | 84451 |
| Gene name | mitogen-activated protein kinase kinase kinase 21 | |
| Gene Alias | MLK4 | |
| Cytomap | 1q42.2 | |
| Gene Type | protein-coding | GO ID | GO:0000165 | UniProtAcc | A0A1W2PKR9 |
Top |
Malignant transformation analysis |
| Identification of the aberrant gene expression in precancerous and cancerous lesions by comparing the gene expression of stem-like cells in diseased tissues with normal stem cells |
| Entrez ID | Symbol | Replicates | Species | Organ | Tissue | Adj P-value | Log2FC | Malignancy |
| 84451 | MAP3K21 | HTA11_3410_2000001011 | Human | Colorectum | AD | 1.25e-10 | -4.98e-01 | 0.0155 |
| 84451 | MAP3K21 | HTA11_2487_2000001011 | Human | Colorectum | SER | 7.71e-05 | -4.54e-01 | -0.1808 |
| 84451 | MAP3K21 | HTA11_3361_2000001011 | Human | Colorectum | AD | 4.11e-03 | -4.70e-01 | -0.1207 |
| 84451 | MAP3K21 | HTA11_696_2000001011 | Human | Colorectum | AD | 1.24e-06 | -3.32e-01 | -0.1464 |
| 84451 | MAP3K21 | HTA11_866_2000001011 | Human | Colorectum | AD | 5.08e-08 | -3.53e-01 | -0.1001 |
| 84451 | MAP3K21 | HTA11_866_3004761011 | Human | Colorectum | AD | 9.16e-09 | -4.97e-01 | 0.096 |
| 84451 | MAP3K21 | HTA11_7696_3000711011 | Human | Colorectum | AD | 1.49e-03 | -3.04e-01 | 0.0674 |
| 84451 | MAP3K21 | HTA11_99999970781_79442 | Human | Colorectum | MSS | 1.09e-36 | -6.16e-01 | 0.294 |
| 84451 | MAP3K21 | HTA11_99999965104_69814 | Human | Colorectum | MSS | 3.47e-12 | -6.16e-01 | 0.281 |
| 84451 | MAP3K21 | HTA11_99999971662_82457 | Human | Colorectum | MSS | 2.14e-33 | -6.16e-01 | 0.3859 |
| 84451 | MAP3K21 | HTA11_99999973899_84307 | Human | Colorectum | MSS | 3.25e-09 | -6.16e-01 | 0.2585 |
| 84451 | MAP3K21 | HTA11_99999974143_84620 | Human | Colorectum | MSS | 4.96e-35 | -6.16e-01 | 0.3005 |
| 84451 | MAP3K21 | A001-C-207 | Human | Colorectum | FAP | 1.26e-06 | -4.10e-01 | 0.1278 |
| 84451 | MAP3K21 | A015-C-203 | Human | Colorectum | FAP | 1.33e-25 | -4.77e-01 | -0.1294 |
| 84451 | MAP3K21 | A015-C-204 | Human | Colorectum | FAP | 1.94e-06 | -3.78e-01 | -0.0228 |
| 84451 | MAP3K21 | A014-C-040 | Human | Colorectum | FAP | 7.52e-03 | -3.77e-01 | -0.1184 |
| 84451 | MAP3K21 | A002-C-201 | Human | Colorectum | FAP | 1.70e-15 | -4.61e-01 | 0.0324 |
| 84451 | MAP3K21 | A002-C-203 | Human | Colorectum | FAP | 1.85e-04 | -2.53e-01 | 0.2786 |
| 84451 | MAP3K21 | A001-C-119 | Human | Colorectum | FAP | 7.63e-08 | -4.22e-01 | -0.1557 |
| 84451 | MAP3K21 | A001-C-108 | Human | Colorectum | FAP | 7.48e-17 | -3.58e-01 | -0.0272 |
| Page: 1 2 3 |
| Tissue | Expression Dynamics | Abbreviation |
| Colorectum (GSE201348) |  | FAP: Familial adenomatous polyposis |
| CRC: Colorectal cancer | ||
| Colorectum (HTA11) |  | AD: Adenomas |
| SER: Sessile serrated lesions | ||
| MSI-H: Microsatellite-high colorectal cancer | ||
| MSS: Microsatellite stable colorectal cancer | ||
| Liver | 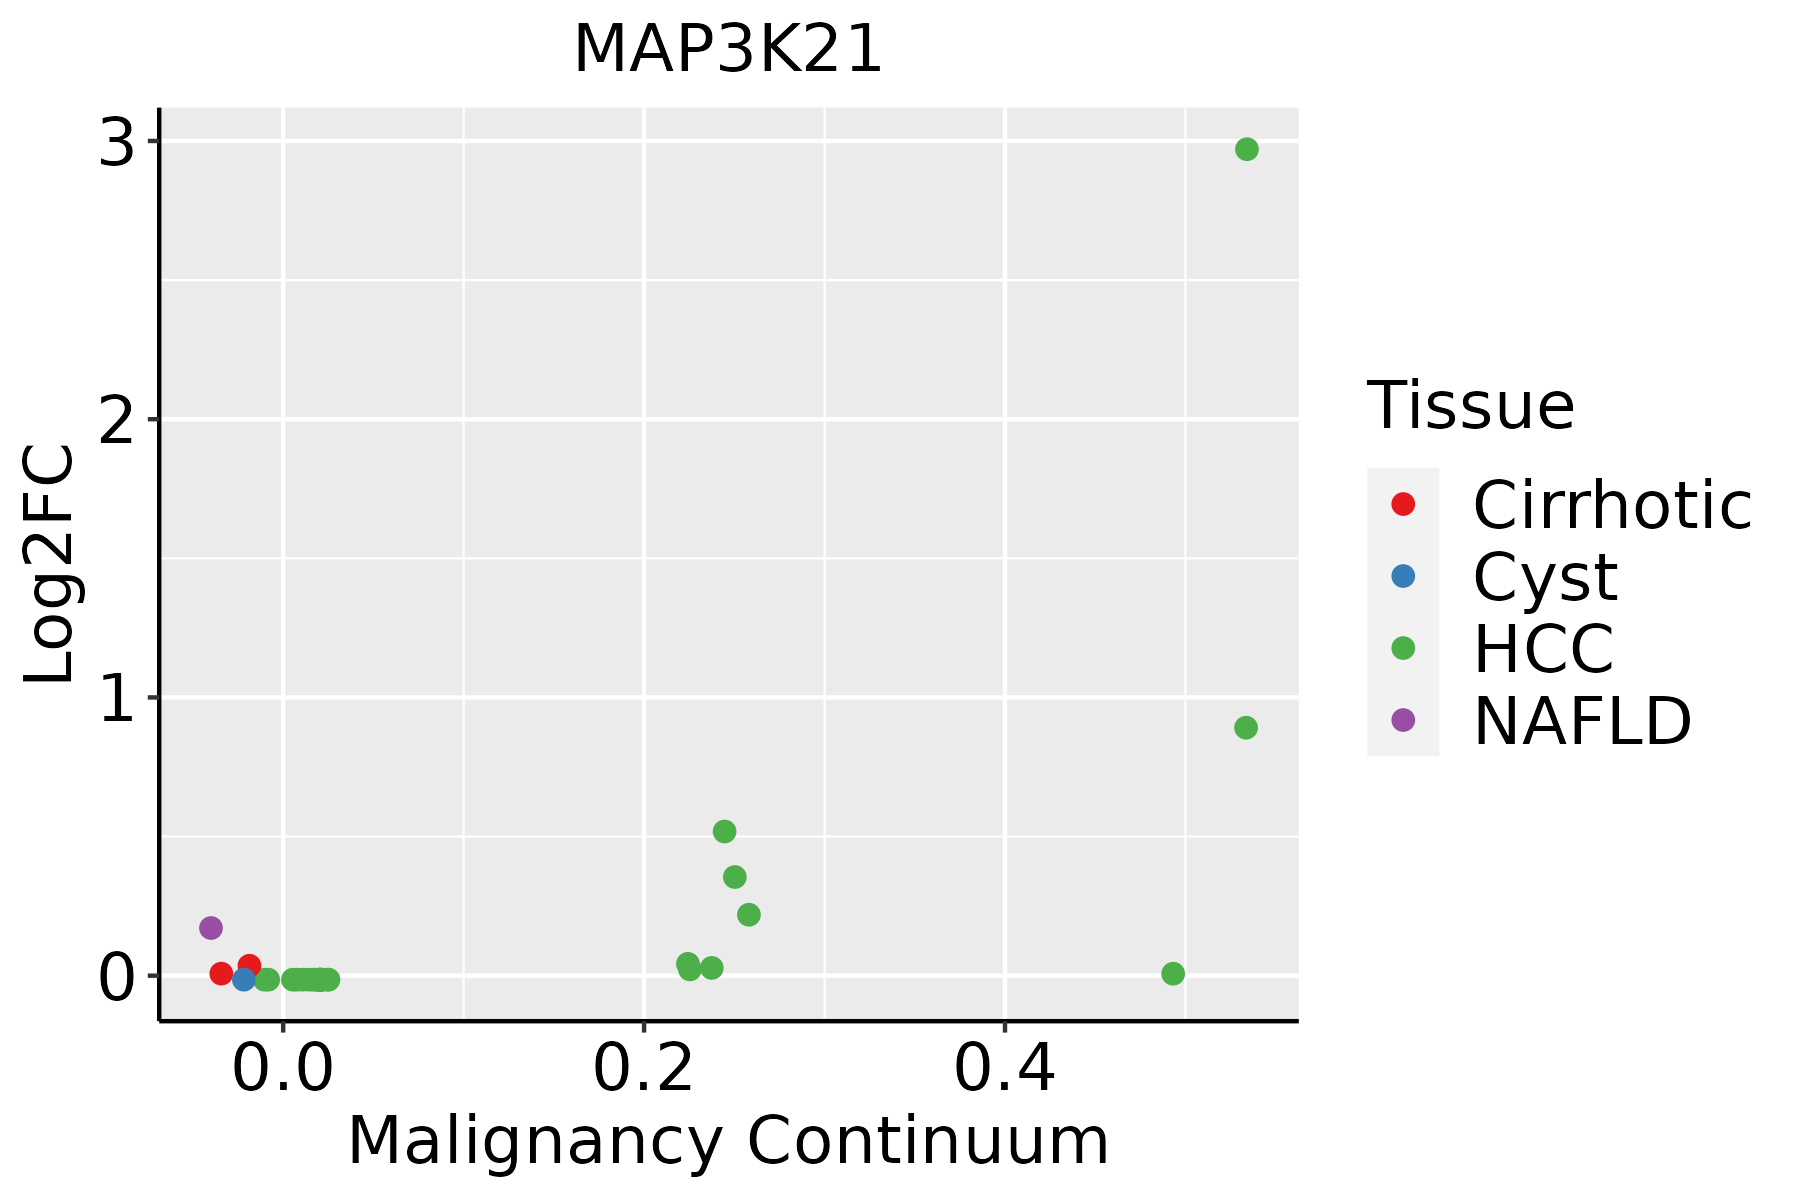 | HCC: Hepatocellular carcinoma |
| NAFLD: Non-alcoholic fatty liver disease |
| ∗log2FC in expression of this searched gene in stem-like cells from each diseased tissue sample relative to stem-like cells in normal samples in each tissue plotted against the malignancy continuum. Samples are colored based on if they are from different disease stage. |
Top |
Malignant transformation related pathway analysis |
| Find out the enriched GO biological processes and KEGG pathways involved in transition from healthy to precancer to cancer |
| Tissue | Disease Stage | Enriched GO biological Processes |
| Colorectum | AD |  |
| Colorectum | SER |  |
| Colorectum | MSS |  |
| Colorectum | MSI-H |  |
| Colorectum | FAP |  |
| ∗Top 15 enriched GO BP terms are showed in the bar plot of each disease state in each tissue. Each row represents a significant GO biological process which is colored according to the -log10(p.adjust). |
| Page: 1 2 3 4 5 6 7 8 9 |
| GO ID | Tissue | Disease Stage | Description | Gene Ratio | Bg Ratio | pvalue | p.adjust | Count |
| GO:0046777 | Colorectum | AD | protein autophosphorylation | 74/3918 | 227/18723 | 2.48e-05 | 4.76e-04 | 74 |
| GO:00467771 | Colorectum | SER | protein autophosphorylation | 60/2897 | 227/18723 | 1.36e-05 | 4.25e-04 | 60 |
| GO:00467772 | Colorectum | MSS | protein autophosphorylation | 63/3467 | 227/18723 | 3.96e-04 | 4.91e-03 | 63 |
| GO:00467773 | Colorectum | FAP | protein autophosphorylation | 52/2622 | 227/18723 | 1.88e-04 | 2.76e-03 | 52 |
| GO:00467774 | Colorectum | CRC | protein autophosphorylation | 42/2078 | 227/18723 | 6.08e-04 | 8.10e-03 | 42 |
| GO:00467775 | Liver | HCC | protein autophosphorylation | 123/7958 | 227/18723 | 2.40e-04 | 1.80e-03 | 123 |
| Page: 1 |
| Pathway ID | Tissue | Disease Stage | Description | Gene Ratio | Bg Ratio | pvalue | p.adjust | qvalue | Count |
| hsa04010 | Colorectum | FAP | MAPK signaling pathway | 68/1404 | 302/8465 | 4.00e-03 | 1.67e-02 | 1.02e-02 | 68 |
| hsa040101 | Colorectum | FAP | MAPK signaling pathway | 68/1404 | 302/8465 | 4.00e-03 | 1.67e-02 | 1.02e-02 | 68 |
| hsa040102 | Colorectum | CRC | MAPK signaling pathway | 56/1091 | 302/8465 | 2.76e-03 | 1.77e-02 | 1.20e-02 | 56 |
| hsa040103 | Colorectum | CRC | MAPK signaling pathway | 56/1091 | 302/8465 | 2.76e-03 | 1.77e-02 | 1.20e-02 | 56 |
| Page: 1 |
Top |
Cell-cell communication analysis |
| Identification of potential cell-cell interactions between two cell types and their ligand-receptor pairs for different disease states |
| Ligand | Receptor | LRpair | Pathway | Tissue | Disease Stage |
| Page: 1 |
Top |
Single-cell gene regulatory network inference analysis |
| Find out the significant the regulons (TFs) and the target genes of each regulon across cell types for different disease states |
| TF | Cell Type | Tissue | Disease Stage | Target Gene | RSS | Regulon Activity |
| ∗The dot plots of a searched regulon are shown for all cell subpopulations in each disease state of each tissue based on the regulon specific score inferred using pySCENIC and by calculating the average expression. |
| Page: 1 |
Top |
Somatic mutation of malignant transformation related genes |
| Annotation of somatic variants for genes involved in malignant transformation |
| Hugo Symbol | Variant Class | Variant Classification | dbSNP RS | HGVSc | HGVSp | HGVSp Short | SWISSPROT | BIOTYPE | SIFT | PolyPhen | Tumor Sample Barcode | Tissue | Histology | Sex | Age | Stage | Therapy Types | Drugs | Outcome |
| MAP3K21 | SNV | Missense_Mutation | novel | c.2657G>C | p.Arg886Thr | p.R886T | Q5TCX8 | protein_coding | tolerated(0.11) | benign(0) | TCGA-A2-A0CL-01 | Breast | breast invasive carcinoma | Female | <65 | III/IV | Chemotherapy | cytoxan | SD |
| MAP3K21 | SNV | Missense_Mutation | c.3055N>G | p.Arg1019Gly | p.R1019G | Q5TCX8 | protein_coding | tolerated(0.08) | benign(0.037) | TCGA-A8-A08Z-01 | Breast | breast invasive carcinoma | Female | >=65 | III/IV | Unknown | Unknown | SD | |
| MAP3K21 | SNV | Missense_Mutation | c.1312G>C | p.Glu438Gln | p.E438Q | Q5TCX8 | protein_coding | deleterious(0) | probably_damaging(0.95) | TCGA-A8-A09G-01 | Breast | breast invasive carcinoma | Female | >=65 | III/IV | Unknown | Unknown | SD | |
| MAP3K21 | SNV | Missense_Mutation | rs374695182 | c.1724G>A | p.Arg575Gln | p.R575Q | Q5TCX8 | protein_coding | tolerated(0.33) | benign(0.049) | TCGA-AN-A046-01 | Breast | breast invasive carcinoma | Female | >=65 | I/II | Unknown | Unknown | SD |
| MAP3K21 | SNV | Missense_Mutation | c.1658G>T | p.Arg553Leu | p.R553L | Q5TCX8 | protein_coding | deleterious(0.01) | probably_damaging(0.995) | TCGA-AR-A24H-01 | Breast | breast invasive carcinoma | Female | >=65 | I/II | Hormone Therapy | tamoxiphen | SD | |
| MAP3K21 | SNV | Missense_Mutation | novel | c.1661T>C | p.Leu554Pro | p.L554P | Q5TCX8 | protein_coding | deleterious(0) | probably_damaging(0.998) | TCGA-B6-A1KC-01 | Breast | breast invasive carcinoma | Female | >=65 | I/II | Unknown | Unknown | SD |
| MAP3K21 | SNV | Missense_Mutation | novel | c.1663C>G | p.Arg555Gly | p.R555G | Q5TCX8 | protein_coding | deleterious(0) | probably_damaging(0.992) | TCGA-B6-A1KC-01 | Breast | breast invasive carcinoma | Female | >=65 | I/II | Unknown | Unknown | SD |
| MAP3K21 | SNV | Missense_Mutation | novel | c.1288N>A | p.Asp430Asn | p.D430N | Q5TCX8 | protein_coding | tolerated(0.12) | benign(0.012) | TCGA-BH-A2L8-01 | Breast | breast invasive carcinoma | Female | <65 | I/II | Chemotherapy | cytoxan | CR |
| MAP3K21 | SNV | Missense_Mutation | rs138700859 | c.2858G>A | p.Arg953His | p.R953H | Q5TCX8 | protein_coding | deleterious(0.03) | benign(0) | TCGA-E2-A56Z-01 | Breast | breast invasive carcinoma | Female | >=65 | I/II | Hormone Therapy | arimidex | SD |
| MAP3K21 | SNV | Missense_Mutation | c.2746C>T | p.Pro916Ser | p.P916S | Q5TCX8 | protein_coding | tolerated(0.1) | possibly_damaging(0.755) | TCGA-EW-A1P4-01 | Breast | breast invasive carcinoma | Female | <65 | I/II | Chemotherapy | docetaxel | SD |
| Page: 1 2 3 4 5 6 7 8 9 10 11 12 |
Top |
Related drugs of malignant transformation related genes |
| Identification of chemicals and drugs interact with genes involved in malignant transfromation |
| (DGIdb 4.0) |
| Entrez ID | Symbol | Category | Interaction Types | Drug Claim Name | Drug Name | PMIDs |
| Page: 1 |

Copyright 2023-Present -The University of Texas Health Science Center at Houston |