
|
|||||
|
 | |
| |
| |
| |
| |
| |
|
Gene: MAP3K20 |
Gene summary for MAP3K20 |
| Gene information | Species | Human | Gene symbol | MAP3K20 | Gene ID | 51776 |
| Gene name | mitogen-activated protein kinase kinase kinase 20 | |
| Gene Alias | AZK | |
| Cytomap | 2q31.1 | |
| Gene Type | protein-coding | GO ID | GO:0000075 | UniProtAcc | Q9NYL2 |
Top |
Malignant transformation analysis |
| Identification of the aberrant gene expression in precancerous and cancerous lesions by comparing the gene expression of stem-like cells in diseased tissues with normal stem cells |
| Entrez ID | Symbol | Replicates | Species | Organ | Tissue | Adj P-value | Log2FC | Malignancy |
| 51776 | MAP3K20 | HTA11_3410_2000001011 | Human | Colorectum | AD | 5.97e-04 | 1.48e-01 | 0.0155 |
| 51776 | MAP3K20 | HTA11_1391_2000001011 | Human | Colorectum | AD | 3.98e-03 | 5.21e-01 | -0.059 |
| 51776 | MAP3K20 | HTA11_866_3004761011 | Human | Colorectum | AD | 7.02e-13 | 5.33e-01 | 0.096 |
| 51776 | MAP3K20 | HTA11_99999970781_79442 | Human | Colorectum | MSS | 1.96e-10 | -2.54e-01 | 0.294 |
| 51776 | MAP3K20 | HTA11_99999971662_82457 | Human | Colorectum | MSS | 8.94e-11 | -2.54e-01 | 0.3859 |
| 51776 | MAP3K20 | HTA11_99999974143_84620 | Human | Colorectum | MSS | 9.32e-10 | -2.54e-01 | 0.3005 |
| 51776 | MAP3K20 | A015-C-203 | Human | Colorectum | FAP | 4.41e-02 | -5.99e-02 | -0.1294 |
| 51776 | MAP3K20 | A015-C-006 | Human | Colorectum | FAP | 4.84e-02 | 3.47e-01 | -0.0994 |
| 51776 | MAP3K20 | A015-C-104 | Human | Colorectum | FAP | 1.77e-02 | -1.39e-01 | -0.1899 |
| 51776 | MAP3K20 | A002-C-016 | Human | Colorectum | FAP | 4.84e-02 | -1.30e-01 | 0.0521 |
| 51776 | MAP3K20 | A001-C-007 | Human | Colorectum | CRC | 5.20e-03 | 5.82e-01 | 0.1899 |
| 51776 | MAP3K20 | A002-C-116 | Human | Colorectum | FAP | 6.75e-04 | -1.71e-01 | -0.0452 |
| 51776 | MAP3K20 | CRC-1-8810 | Human | Colorectum | CRC | 5.33e-27 | 9.89e-01 | 0.6257 |
| 51776 | MAP3K20 | CRC-3-11773 | Human | Colorectum | CRC | 3.31e-09 | 6.24e-01 | 0.2564 |
| 51776 | MAP3K20 | AEH-subject1 | Human | Endometrium | AEH | 1.85e-09 | 2.24e-01 | -0.3059 |
| 51776 | MAP3K20 | AEH-subject2 | Human | Endometrium | AEH | 4.29e-06 | 1.85e-01 | -0.2525 |
| 51776 | MAP3K20 | AEH-subject3 | Human | Endometrium | AEH | 3.87e-05 | 1.92e-01 | -0.2576 |
| 51776 | MAP3K20 | AEH-subject4 | Human | Endometrium | AEH | 9.74e-11 | 3.15e-01 | -0.2657 |
| 51776 | MAP3K20 | AEH-subject5 | Human | Endometrium | AEH | 1.30e-14 | 3.15e-01 | -0.2953 |
| 51776 | MAP3K20 | EEC-subject1 | Human | Endometrium | EEC | 3.89e-10 | 3.18e-01 | -0.2682 |
| Page: 1 2 3 4 5 |
| Tissue | Expression Dynamics | Abbreviation |
| Colorectum (GSE201348) |  | FAP: Familial adenomatous polyposis |
| CRC: Colorectal cancer | ||
| Colorectum (HTA11) |  | AD: Adenomas |
| SER: Sessile serrated lesions | ||
| MSI-H: Microsatellite-high colorectal cancer | ||
| MSS: Microsatellite stable colorectal cancer | ||
| Endometrium | 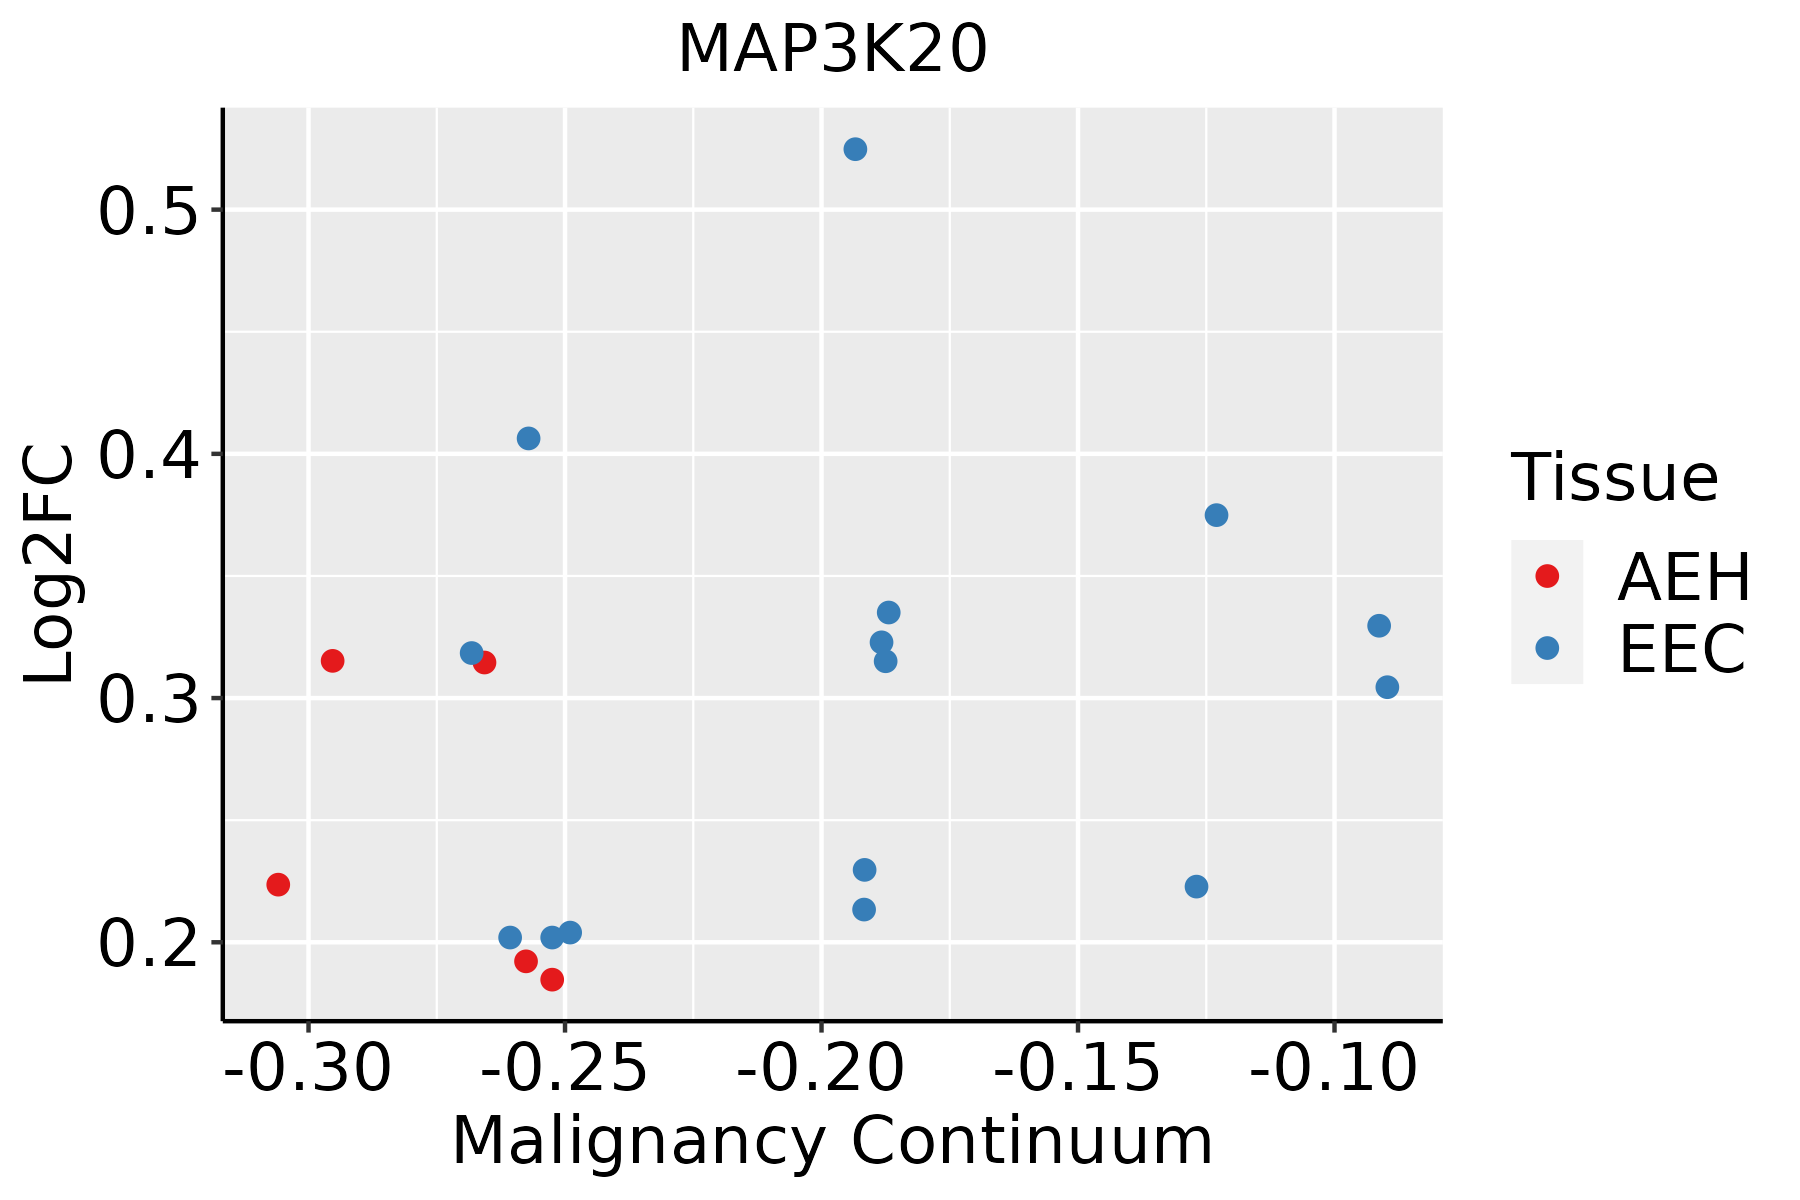 | AEH: Atypical endometrial hyperplasia |
| EEC: Endometrioid Cancer | ||
| Liver | 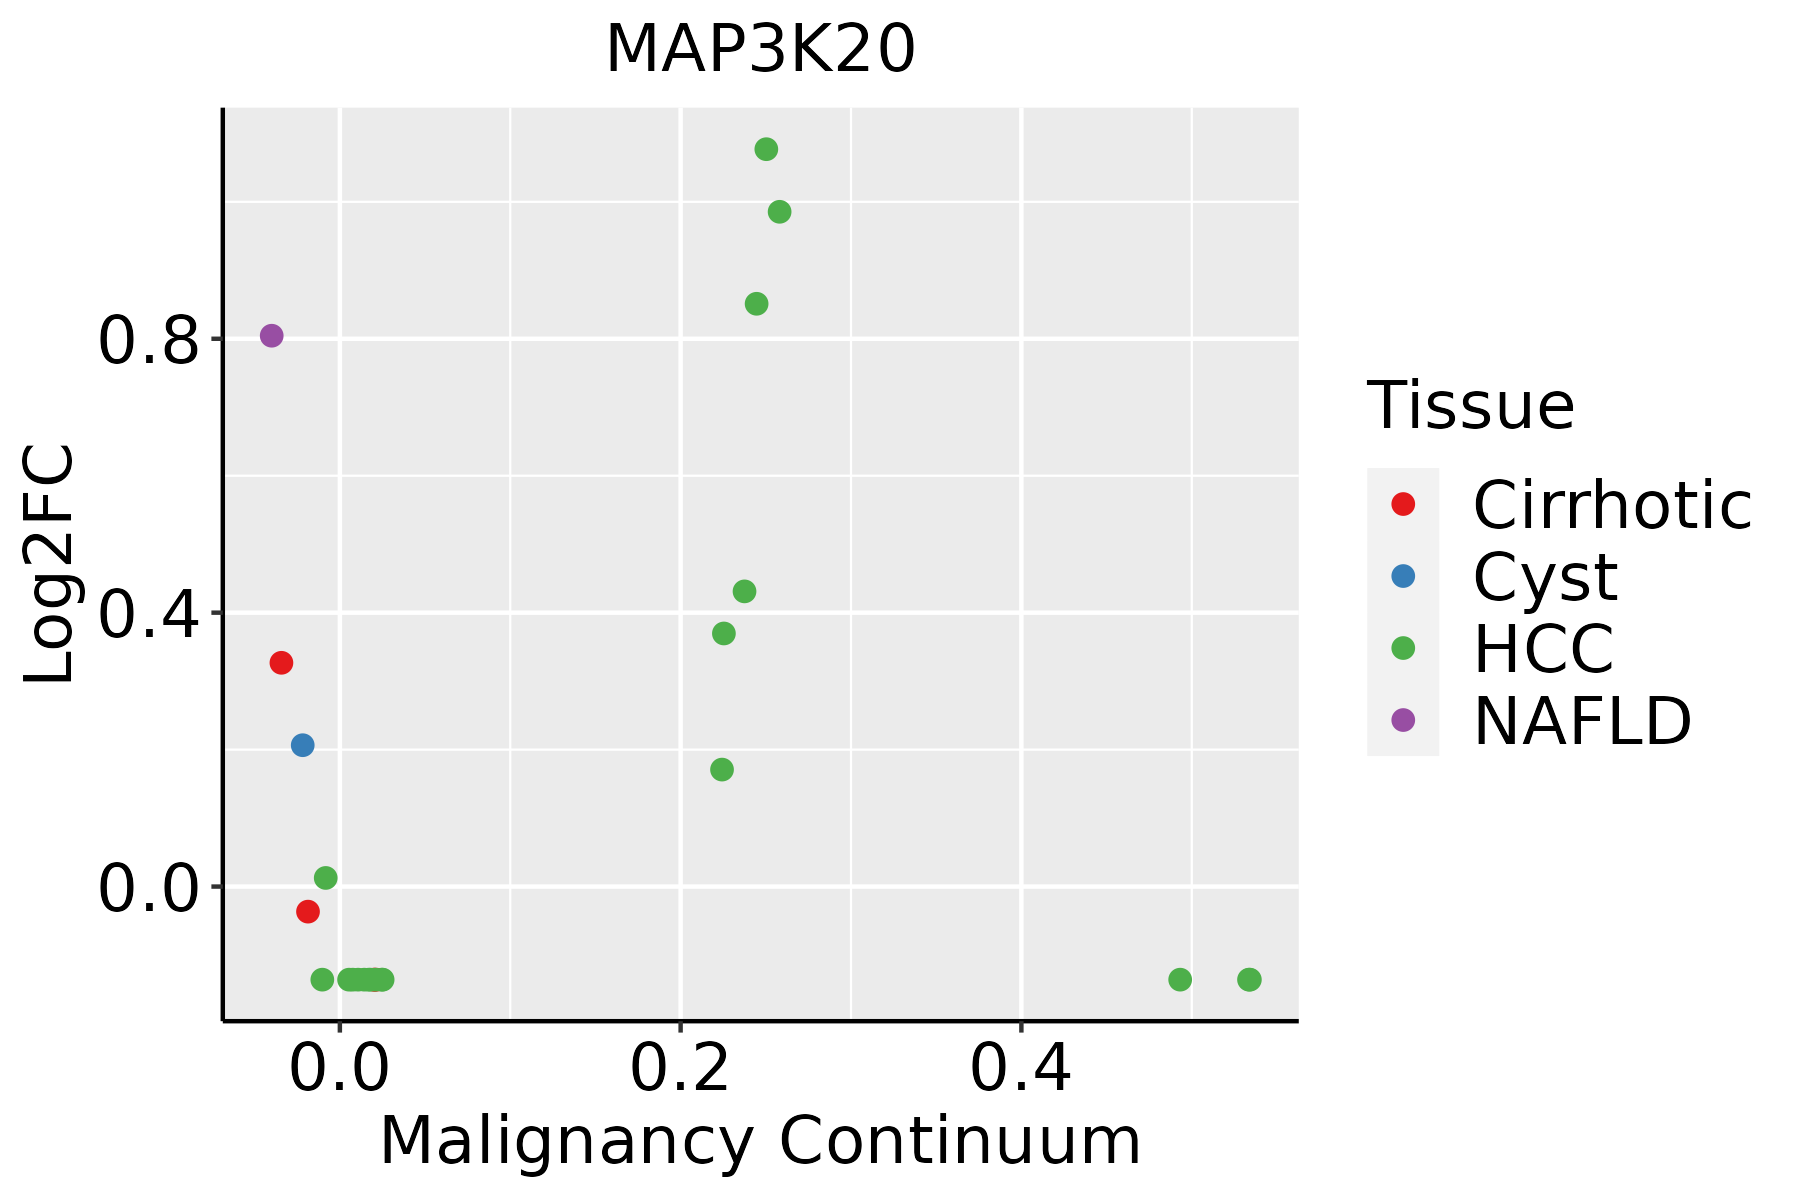 | HCC: Hepatocellular carcinoma |
| NAFLD: Non-alcoholic fatty liver disease | ||
| Lung | 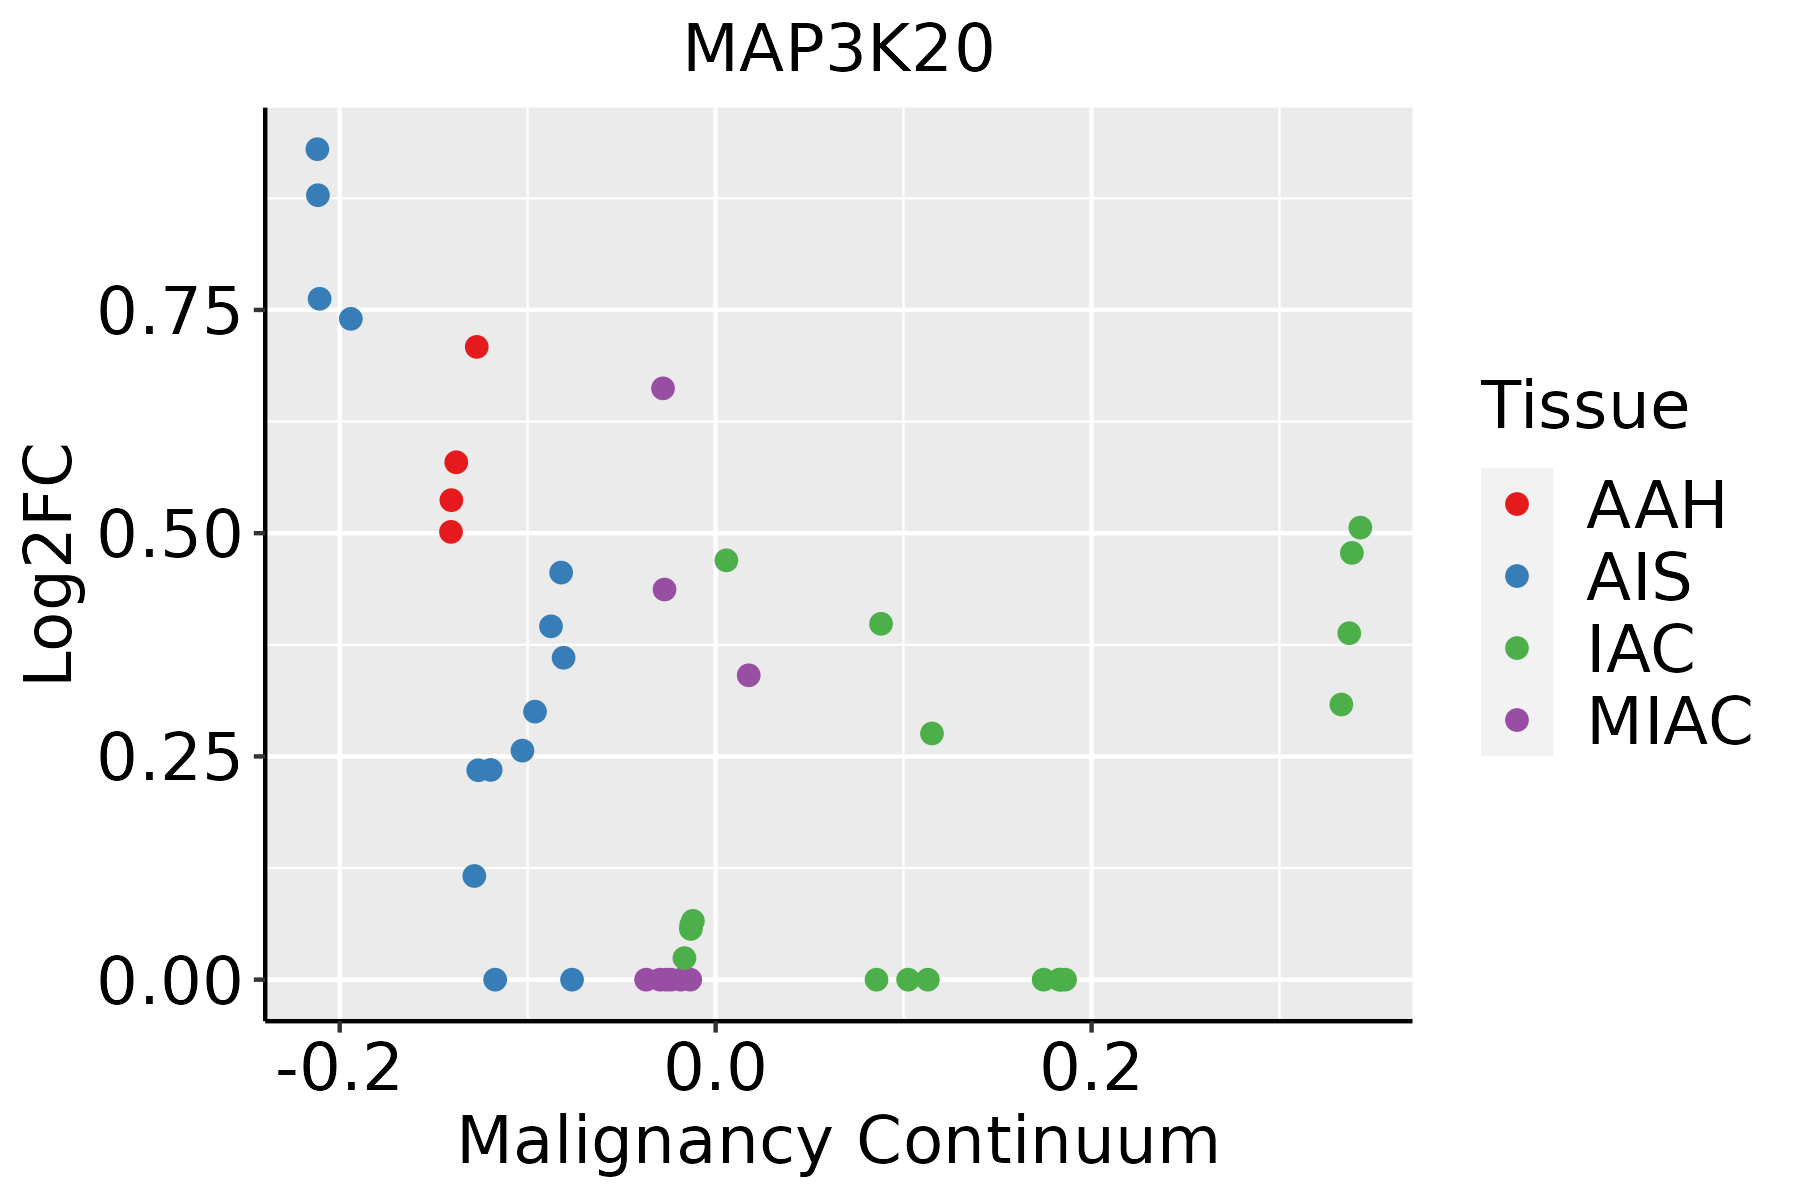 | AAH: Atypical adenomatous hyperplasia |
| AIS: Adenocarcinoma in situ | ||
| IAC: Invasive lung adenocarcinoma | ||
| MIA: Minimally invasive adenocarcinoma | ||
| Thyroid | 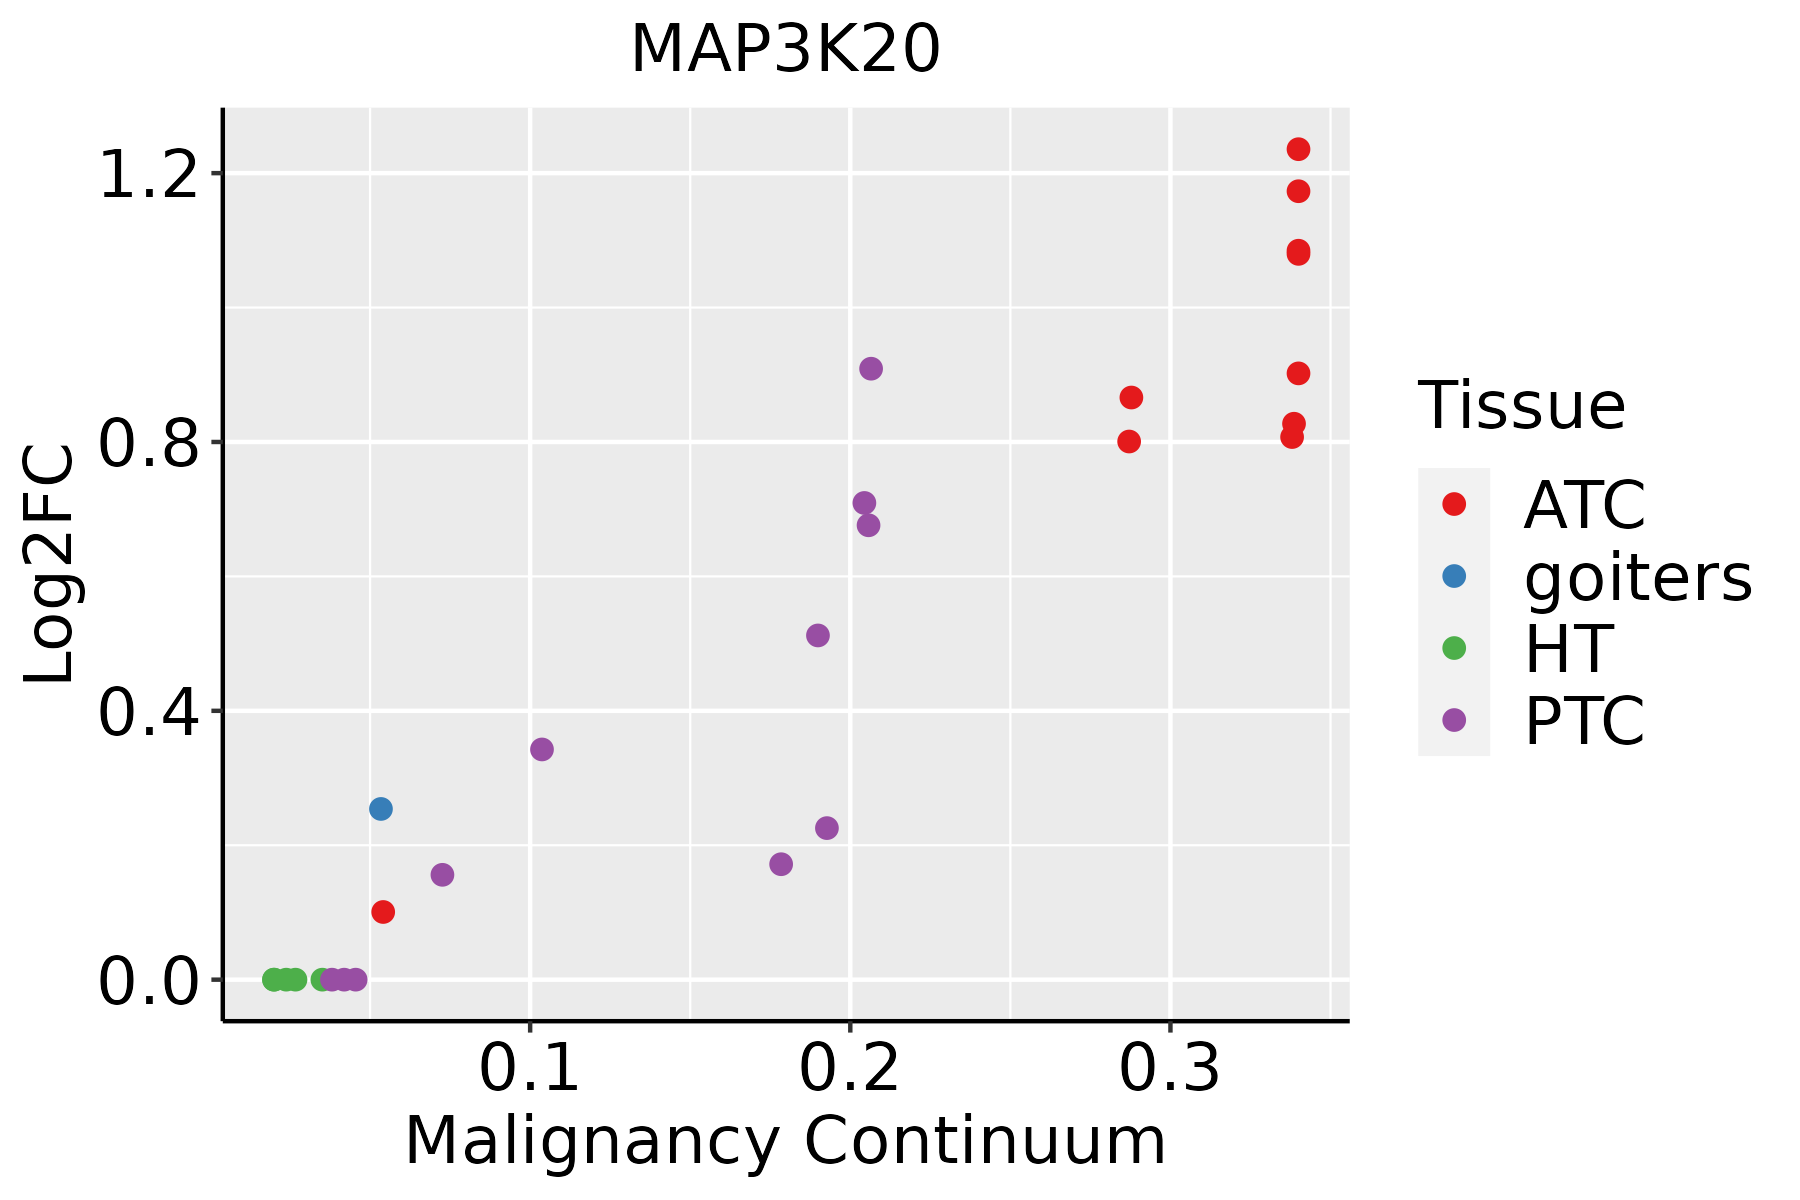 | ATC: Anaplastic thyroid cancer |
| HT: Hashimoto's thyroiditis | ||
| PTC: Papillary thyroid cancer |
| ∗log2FC in expression of this searched gene in stem-like cells from each diseased tissue sample relative to stem-like cells in normal samples in each tissue plotted against the malignancy continuum. Samples are colored based on if they are from different disease stage. |
Top |
Malignant transformation related pathway analysis |
| Find out the enriched GO biological processes and KEGG pathways involved in transition from healthy to precancer to cancer |
| Tissue | Disease Stage | Enriched GO biological Processes |
| Colorectum | AD |  |
| Colorectum | SER |  |
| Colorectum | MSS |  |
| Colorectum | MSI-H |  |
| Colorectum | FAP |  |
| ∗Top 15 enriched GO BP terms are showed in the bar plot of each disease state in each tissue. Each row represents a significant GO biological process which is colored according to the -log10(p.adjust). |
| Page: 1 2 3 4 5 6 7 8 9 |
| GO ID | Tissue | Disease Stage | Description | Gene Ratio | Bg Ratio | pvalue | p.adjust | Count |
| GO:2001020 | Colorectum | AD | regulation of response to DNA damage stimulus | 71/3918 | 219/18723 | 4.38e-05 | 7.65e-04 | 71 |
| GO:0051403 | Colorectum | AD | stress-activated MAPK cascade | 72/3918 | 239/18723 | 4.77e-04 | 5.25e-03 | 72 |
| GO:0031098 | Colorectum | AD | stress-activated protein kinase signaling cascade | 74/3918 | 247/18723 | 4.80e-04 | 5.27e-03 | 74 |
| GO:2001022 | Colorectum | AD | positive regulation of response to DNA damage stimulus | 36/3918 | 105/18723 | 1.02e-03 | 9.47e-03 | 36 |
| GO:0048736 | Colorectum | AD | appendage development | 51/3918 | 172/18723 | 4.20e-03 | 2.89e-02 | 51 |
| GO:0060173 | Colorectum | AD | limb development | 51/3918 | 172/18723 | 4.20e-03 | 2.89e-02 | 51 |
| GO:0007346 | Colorectum | AD | regulation of mitotic cell cycle | 119/3918 | 457/18723 | 4.60e-03 | 3.14e-02 | 119 |
| GO:0045787 | Colorectum | AD | positive regulation of cell cycle | 85/3918 | 313/18723 | 4.76e-03 | 3.22e-02 | 85 |
| GO:20010202 | Colorectum | MSS | regulation of response to DNA damage stimulus | 64/3467 | 219/18723 | 7.20e-05 | 1.21e-03 | 64 |
| GO:00310982 | Colorectum | MSS | stress-activated protein kinase signaling cascade | 67/3467 | 247/18723 | 5.28e-04 | 5.99e-03 | 67 |
| GO:00514032 | Colorectum | MSS | stress-activated MAPK cascade | 65/3467 | 239/18723 | 5.87e-04 | 6.49e-03 | 65 |
| GO:20010221 | Colorectum | MSS | positive regulation of response to DNA damage stimulus | 33/3467 | 105/18723 | 9.83e-04 | 9.86e-03 | 33 |
| GO:00457871 | Colorectum | MSS | positive regulation of cell cycle | 80/3467 | 313/18723 | 1.15e-03 | 1.12e-02 | 80 |
| GO:00487362 | Colorectum | MSS | appendage development | 48/3467 | 172/18723 | 1.61e-03 | 1.46e-02 | 48 |
| GO:00601732 | Colorectum | MSS | limb development | 48/3467 | 172/18723 | 1.61e-03 | 1.46e-02 | 48 |
| GO:00073461 | Colorectum | MSS | regulation of mitotic cell cycle | 108/3467 | 457/18723 | 3.30e-03 | 2.50e-02 | 108 |
| GO:0090068 | Colorectum | MSS | positive regulation of cell cycle process | 60/3467 | 236/18723 | 5.01e-03 | 3.46e-02 | 60 |
| GO:0071480 | Colorectum | MSS | cellular response to gamma radiation | 12/3467 | 31/18723 | 6.80e-03 | 4.39e-02 | 12 |
| GO:00310983 | Colorectum | FAP | stress-activated protein kinase signaling cascade | 61/2622 | 247/18723 | 4.79e-06 | 1.57e-04 | 61 |
| GO:00514033 | Colorectum | FAP | stress-activated MAPK cascade | 59/2622 | 239/18723 | 6.90e-06 | 2.11e-04 | 59 |
| Page: 1 2 3 4 5 6 7 8 9 10 11 12 13 14 |
| Pathway ID | Tissue | Disease Stage | Description | Gene Ratio | Bg Ratio | pvalue | p.adjust | qvalue | Count |
| hsa04010 | Colorectum | FAP | MAPK signaling pathway | 68/1404 | 302/8465 | 4.00e-03 | 1.67e-02 | 1.02e-02 | 68 |
| hsa040101 | Colorectum | FAP | MAPK signaling pathway | 68/1404 | 302/8465 | 4.00e-03 | 1.67e-02 | 1.02e-02 | 68 |
| hsa040102 | Colorectum | CRC | MAPK signaling pathway | 56/1091 | 302/8465 | 2.76e-03 | 1.77e-02 | 1.20e-02 | 56 |
| hsa040103 | Colorectum | CRC | MAPK signaling pathway | 56/1091 | 302/8465 | 2.76e-03 | 1.77e-02 | 1.20e-02 | 56 |
| hsa040108 | Lung | IAC | MAPK signaling pathway | 62/1053 | 302/8465 | 3.54e-05 | 6.38e-04 | 4.24e-04 | 62 |
| hsa0401011 | Lung | IAC | MAPK signaling pathway | 62/1053 | 302/8465 | 3.54e-05 | 6.38e-04 | 4.24e-04 | 62 |
| hsa0401021 | Lung | AIS | MAPK signaling pathway | 57/961 | 302/8465 | 6.41e-05 | 9.43e-04 | 6.03e-04 | 57 |
| hsa0401031 | Lung | AIS | MAPK signaling pathway | 57/961 | 302/8465 | 6.41e-05 | 9.43e-04 | 6.03e-04 | 57 |
| hsa040104 | Lung | AAH | MAPK signaling pathway | 27/348 | 302/8465 | 1.13e-04 | 6.32e-03 | 5.08e-03 | 27 |
| hsa040105 | Lung | AAH | MAPK signaling pathway | 27/348 | 302/8465 | 1.13e-04 | 6.32e-03 | 5.08e-03 | 27 |
| hsa040106 | Lung | MIAC | MAPK signaling pathway | 32/507 | 302/8465 | 1.12e-03 | 1.36e-02 | 9.81e-03 | 32 |
| hsa040107 | Lung | MIAC | MAPK signaling pathway | 32/507 | 302/8465 | 1.12e-03 | 1.36e-02 | 9.81e-03 | 32 |
| Page: 1 |
Top |
Cell-cell communication analysis |
| Identification of potential cell-cell interactions between two cell types and their ligand-receptor pairs for different disease states |
| Ligand | Receptor | LRpair | Pathway | Tissue | Disease Stage |
| Page: 1 |
Top |
Single-cell gene regulatory network inference analysis |
| Find out the significant the regulons (TFs) and the target genes of each regulon across cell types for different disease states |
| TF | Cell Type | Tissue | Disease Stage | Target Gene | RSS | Regulon Activity |
| ∗The dot plots of a searched regulon are shown for all cell subpopulations in each disease state of each tissue based on the regulon specific score inferred using pySCENIC and by calculating the average expression. |
| Page: 1 |
Top |
Somatic mutation of malignant transformation related genes |
| Annotation of somatic variants for genes involved in malignant transformation |
| Hugo Symbol | Variant Class | Variant Classification | dbSNP RS | HGVSc | HGVSp | HGVSp Short | SWISSPROT | BIOTYPE | SIFT | PolyPhen | Tumor Sample Barcode | Tissue | Histology | Sex | Age | Stage | Therapy Types | Drugs | Outcome |
| MAP3K20 | SNV | Missense_Mutation | rs565333842 | c.5N>T | p.Ser2Leu | p.S2L | Q9NYL2 | protein_coding | tolerated_low_confidence(0.45) | benign(0.003) | TCGA-C8-A275-01 | Breast | breast invasive carcinoma | Female | <65 | I/II | Unknown | Unknown | SD |
| MAP3K20 | SNV | Missense_Mutation | c.1061A>G | p.Lys354Arg | p.K354R | Q9NYL2 | protein_coding | tolerated(0.23) | possibly_damaging(0.596) | TCGA-D8-A27I-01 | Breast | breast invasive carcinoma | Female | <65 | III/IV | Chemotherapy | adrimycin+cyclophosphamide | SD | |
| MAP3K20 | SNV | Missense_Mutation | c.2218N>T | p.Pro740Ser | p.P740S | Q9NYL2 | protein_coding | deleterious_low_confidence(0.02) | benign(0.015) | TCGA-E2-A15A-06 | Breast | breast invasive carcinoma | Female | <65 | III/IV | Chemotherapy | cyclophosphamide | SD | |
| MAP3K20 | insertion | Frame_Shift_Ins | novel | c.2347_2348insAGCCTCAGGATCTCTCCTGTGGACACGTGAA | p.Ala783GlufsTer15 | p.A783Efs*15 | Q9NYL2 | protein_coding | TCGA-B6-A0RE-01 | Breast | breast invasive carcinoma | Female | <65 | I/II | Unknown | Unknown | SD | ||
| MAP3K20 | SNV | Missense_Mutation | c.1456N>A | p.Glu486Lys | p.E486K | Q9NYL2 | protein_coding | deleterious(0.01) | possibly_damaging(0.836) | TCGA-C5-A1BK-01 | Cervix | cervical & endocervical cancer | Female | <65 | I/II | Unknown | Unknown | SD | |
| MAP3K20 | SNV | Missense_Mutation | novel | c.1024N>A | p.Asp342Asn | p.D342N | Q9NYL2 | protein_coding | deleterious(0.02) | benign(0.21) | TCGA-VS-A8EK-01 | Cervix | cervical & endocervical cancer | Female | >=65 | I/II | Chemotherapy | cisplatin | PD |
| MAP3K20 | SNV | Missense_Mutation | novel | c.1288N>A | p.Glu430Lys | p.E430K | Q9NYL2 | protein_coding | tolerated(0.57) | benign(0.007) | TCGA-VS-A958-01 | Cervix | cervical & endocervical cancer | Female | <65 | I/II | Chemotherapy | cisplatin | CR |
| MAP3K20 | SNV | Missense_Mutation | novel | c.407C>T | p.Ser136Leu | p.S136L | Q9NYL2 | protein_coding | deleterious(0) | probably_damaging(0.999) | TCGA-ZJ-AAXJ-01 | Cervix | cervical & endocervical cancer | Female | <65 | I/II | Unknown | Unknown | SD |
| MAP3K20 | deletion | Frame_Shift_Del | c.659delN | p.Asn222ThrfsTer4 | p.N222Tfs*4 | Q9NYL2 | protein_coding | TCGA-VS-A94Z-01 | Cervix | cervical & endocervical cancer | Female | <65 | I/II | Chemotherapy | cisplatin | CR | |||
| MAP3K20 | SNV | Missense_Mutation | c.1129C>T | p.Arg377Trp | p.R377W | Q9NYL2 | protein_coding | deleterious(0) | probably_damaging(0.966) | TCGA-AA-3977-01 | Colorectum | colon adenocarcinoma | Male | >=65 | I/II | Unknown | Unknown | SD |
| Page: 1 2 3 4 5 6 7 |
Top |
Related drugs of malignant transformation related genes |
| Identification of chemicals and drugs interact with genes involved in malignant transfromation |
| (DGIdb 4.0) |
| Entrez ID | Symbol | Category | Interaction Types | Drug Claim Name | Drug Name | PMIDs |
| 51776 | MAP3K20 | KINASE, DRUGGABLE GENOME, SERINE THREONINE KINASE, ENZYME | CYC-116 | CYC-116 | ||
| 51776 | MAP3K20 | KINASE, DRUGGABLE GENOME, SERINE THREONINE KINASE, ENZYME | GNF-PF-3023 | CHEMBL535331 | ||
| 51776 | MAP3K20 | KINASE, DRUGGABLE GENOME, SERINE THREONINE KINASE, ENZYME | LAS38096 | CHEMBL375293 | ||
| 51776 | MAP3K20 | KINASE, DRUGGABLE GENOME, SERINE THREONINE KINASE, ENZYME | CENISERTIB | CENISERTIB | ||
| 51776 | MAP3K20 | KINASE, DRUGGABLE GENOME, SERINE THREONINE KINASE, ENZYME | SP-600125 | SP-600125 | ||
| 51776 | MAP3K20 | KINASE, DRUGGABLE GENOME, SERINE THREONINE KINASE, ENZYME | ILORASERTIB | ILORASERTIB | ||
| 51776 | MAP3K20 | KINASE, DRUGGABLE GENOME, SERINE THREONINE KINASE, ENZYME | inhibitor | 384403681 | ||
| 51776 | MAP3K20 | KINASE, DRUGGABLE GENOME, SERINE THREONINE KINASE, ENZYME | DOVITINIB | DOVITINIB | ||
| 51776 | MAP3K20 | KINASE, DRUGGABLE GENOME, SERINE THREONINE KINASE, ENZYME | GW441756X | GW441756X | ||
| 51776 | MAP3K20 | KINASE, DRUGGABLE GENOME, SERINE THREONINE KINASE, ENZYME | SNS-314 | SNS-314 |
| Page: 1 2 |

Copyright 2023-Present -The University of Texas Health Science Center at Houston |