
|
|||||
|
 | |
| |
| |
| |
| |
| |
|
Gene: MAP3K2 |
Gene summary for MAP3K2 |
| Gene information | Species | Human | Gene symbol | MAP3K2 | Gene ID | 10746 |
| Gene name | mitogen-activated protein kinase kinase kinase 2 | |
| Gene Alias | MEKK2 | |
| Cytomap | 2q14.3 | |
| Gene Type | protein-coding | GO ID | GO:0000165 | UniProtAcc | A0A024RAH0 |
Top |
Malignant transformation analysis |
| Identification of the aberrant gene expression in precancerous and cancerous lesions by comparing the gene expression of stem-like cells in diseased tissues with normal stem cells |
| Entrez ID | Symbol | Replicates | Species | Organ | Tissue | Adj P-value | Log2FC | Malignancy |
| 10746 | MAP3K2 | CA_HPV_1 | Human | Cervix | CC | 2.89e-03 | 7.99e-02 | 0.0264 |
| 10746 | MAP3K2 | CCI_2 | Human | Cervix | CC | 1.91e-04 | 5.86e-01 | 0.5249 |
| 10746 | MAP3K2 | CCI_3 | Human | Cervix | CC | 3.69e-03 | 4.89e-01 | 0.516 |
| 10746 | MAP3K2 | CCII_1 | Human | Cervix | CC | 2.50e-03 | -3.37e-01 | 0.3249 |
| 10746 | MAP3K2 | L1 | Human | Cervix | CC | 7.87e-06 | -2.84e-01 | 0.0802 |
| 10746 | MAP3K2 | HTA11_3410_2000001011 | Human | Colorectum | AD | 7.38e-03 | -4.09e-01 | 0.0155 |
| 10746 | MAP3K2 | HTA11_347_2000001011 | Human | Colorectum | AD | 8.21e-04 | 3.02e-01 | -0.1954 |
| 10746 | MAP3K2 | HTA11_7696_3000711011 | Human | Colorectum | AD | 4.56e-04 | -3.53e-01 | 0.0674 |
| 10746 | MAP3K2 | HTA11_99999974143_84620 | Human | Colorectum | MSS | 6.85e-08 | -3.43e-01 | 0.3005 |
| 10746 | MAP3K2 | A015-C-203 | Human | Colorectum | FAP | 2.04e-23 | -3.20e-01 | -0.1294 |
| 10746 | MAP3K2 | A015-C-204 | Human | Colorectum | FAP | 1.99e-03 | -3.14e-01 | -0.0228 |
| 10746 | MAP3K2 | A014-C-040 | Human | Colorectum | FAP | 9.46e-05 | -5.74e-01 | -0.1184 |
| 10746 | MAP3K2 | A002-C-201 | Human | Colorectum | FAP | 3.06e-13 | -4.01e-01 | 0.0324 |
| 10746 | MAP3K2 | A002-C-203 | Human | Colorectum | FAP | 3.73e-04 | -2.04e-01 | 0.2786 |
| 10746 | MAP3K2 | A001-C-119 | Human | Colorectum | FAP | 4.48e-07 | -4.30e-01 | -0.1557 |
| 10746 | MAP3K2 | A001-C-108 | Human | Colorectum | FAP | 1.06e-14 | -3.01e-01 | -0.0272 |
| 10746 | MAP3K2 | A002-C-205 | Human | Colorectum | FAP | 2.69e-18 | -4.57e-01 | -0.1236 |
| 10746 | MAP3K2 | A001-C-104 | Human | Colorectum | FAP | 2.64e-05 | -2.81e-01 | 0.0184 |
| 10746 | MAP3K2 | A015-C-005 | Human | Colorectum | FAP | 9.53e-03 | -2.96e-01 | -0.0336 |
| 10746 | MAP3K2 | A015-C-006 | Human | Colorectum | FAP | 1.37e-11 | -4.59e-01 | -0.0994 |
| Page: 1 2 3 4 5 6 7 8 9 10 |
| Tissue | Expression Dynamics | Abbreviation |
| Cervix | 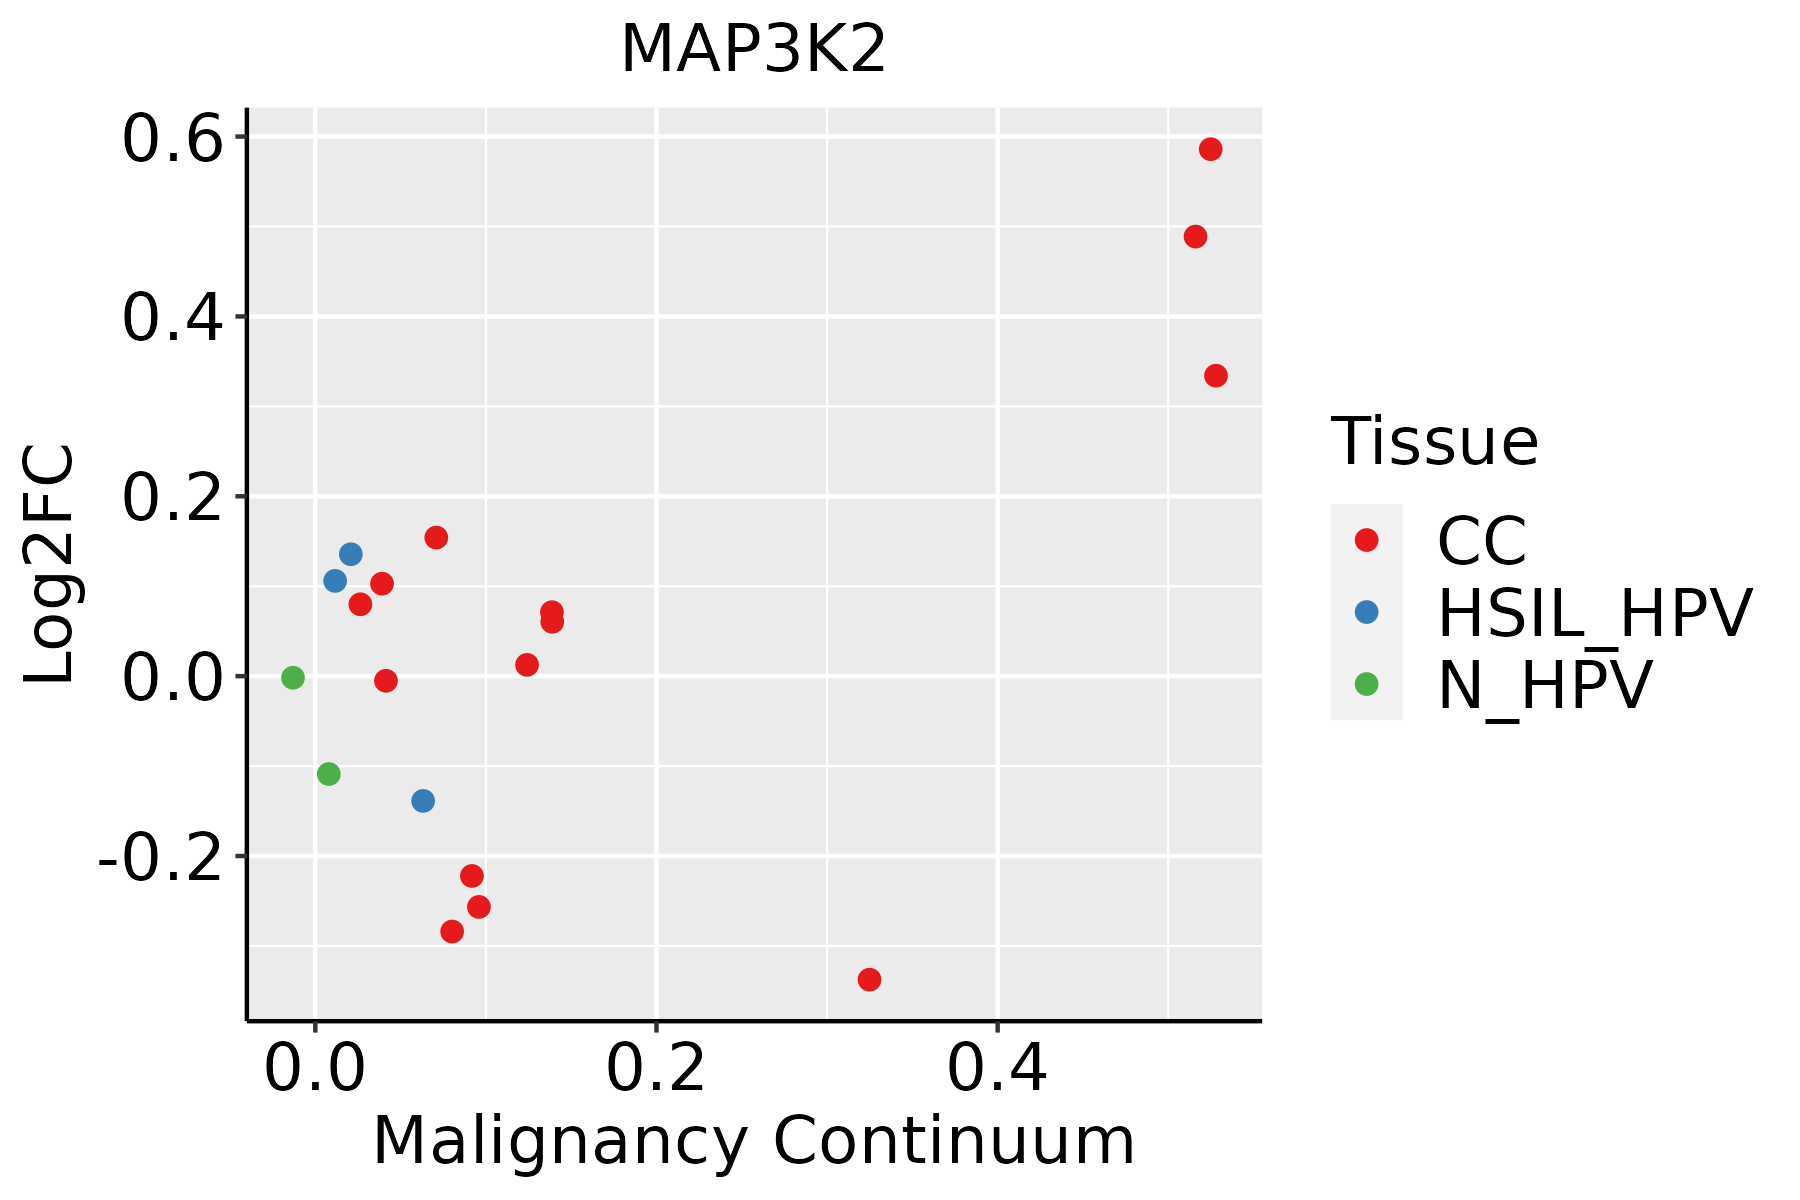 | CC: Cervix cancer |
| HSIL_HPV: HPV-infected high-grade squamous intraepithelial lesions | ||
| N_HPV: HPV-infected normal cervix | ||
| Colorectum (GSE201348) |  | FAP: Familial adenomatous polyposis |
| CRC: Colorectal cancer | ||
| Colorectum (HTA11) |  | AD: Adenomas |
| SER: Sessile serrated lesions | ||
| MSI-H: Microsatellite-high colorectal cancer | ||
| MSS: Microsatellite stable colorectal cancer | ||
| Esophagus |  | ESCC: Esophageal squamous cell carcinoma |
| HGIN: High-grade intraepithelial neoplasias | ||
| LGIN: Low-grade intraepithelial neoplasias | ||
| Liver | 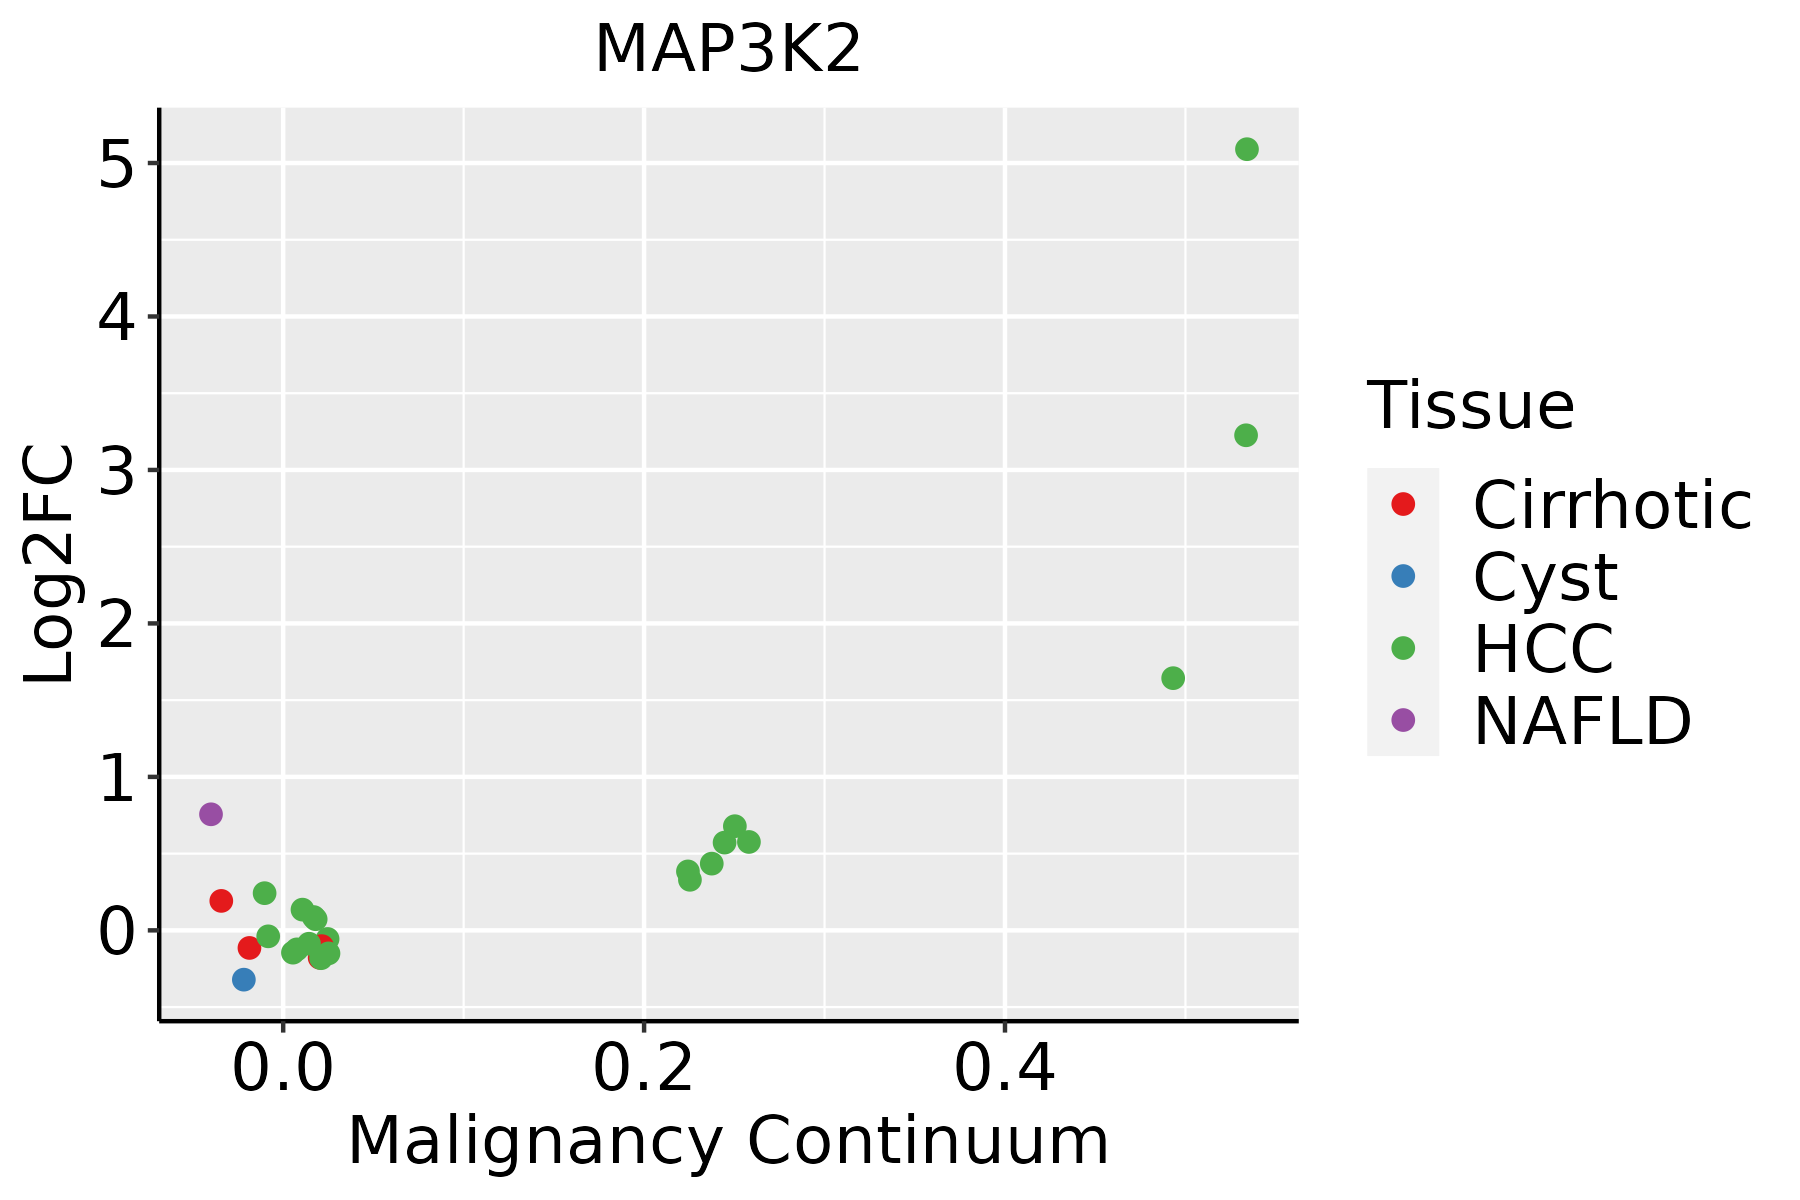 | HCC: Hepatocellular carcinoma |
| NAFLD: Non-alcoholic fatty liver disease | ||
| Lung | 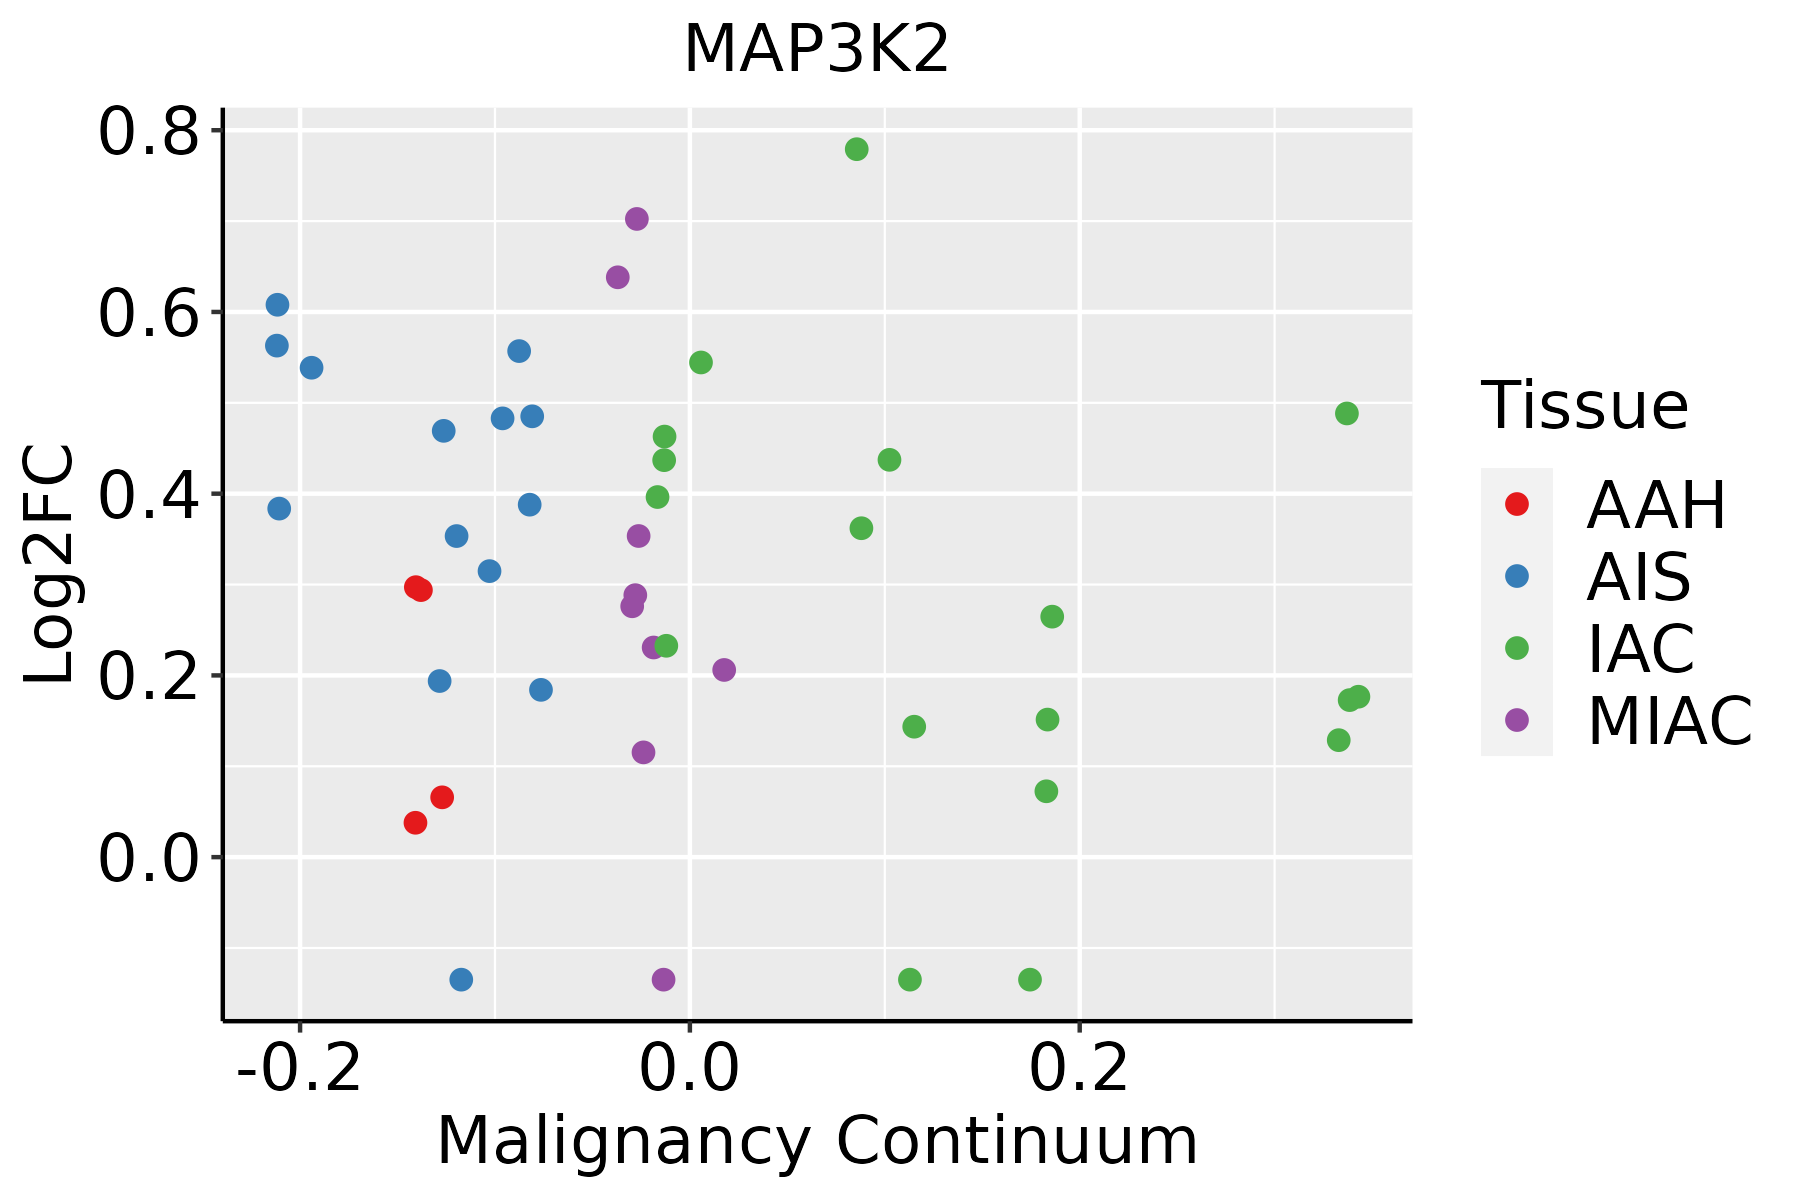 | AAH: Atypical adenomatous hyperplasia |
| AIS: Adenocarcinoma in situ | ||
| IAC: Invasive lung adenocarcinoma | ||
| MIA: Minimally invasive adenocarcinoma | ||
| Oral Cavity | 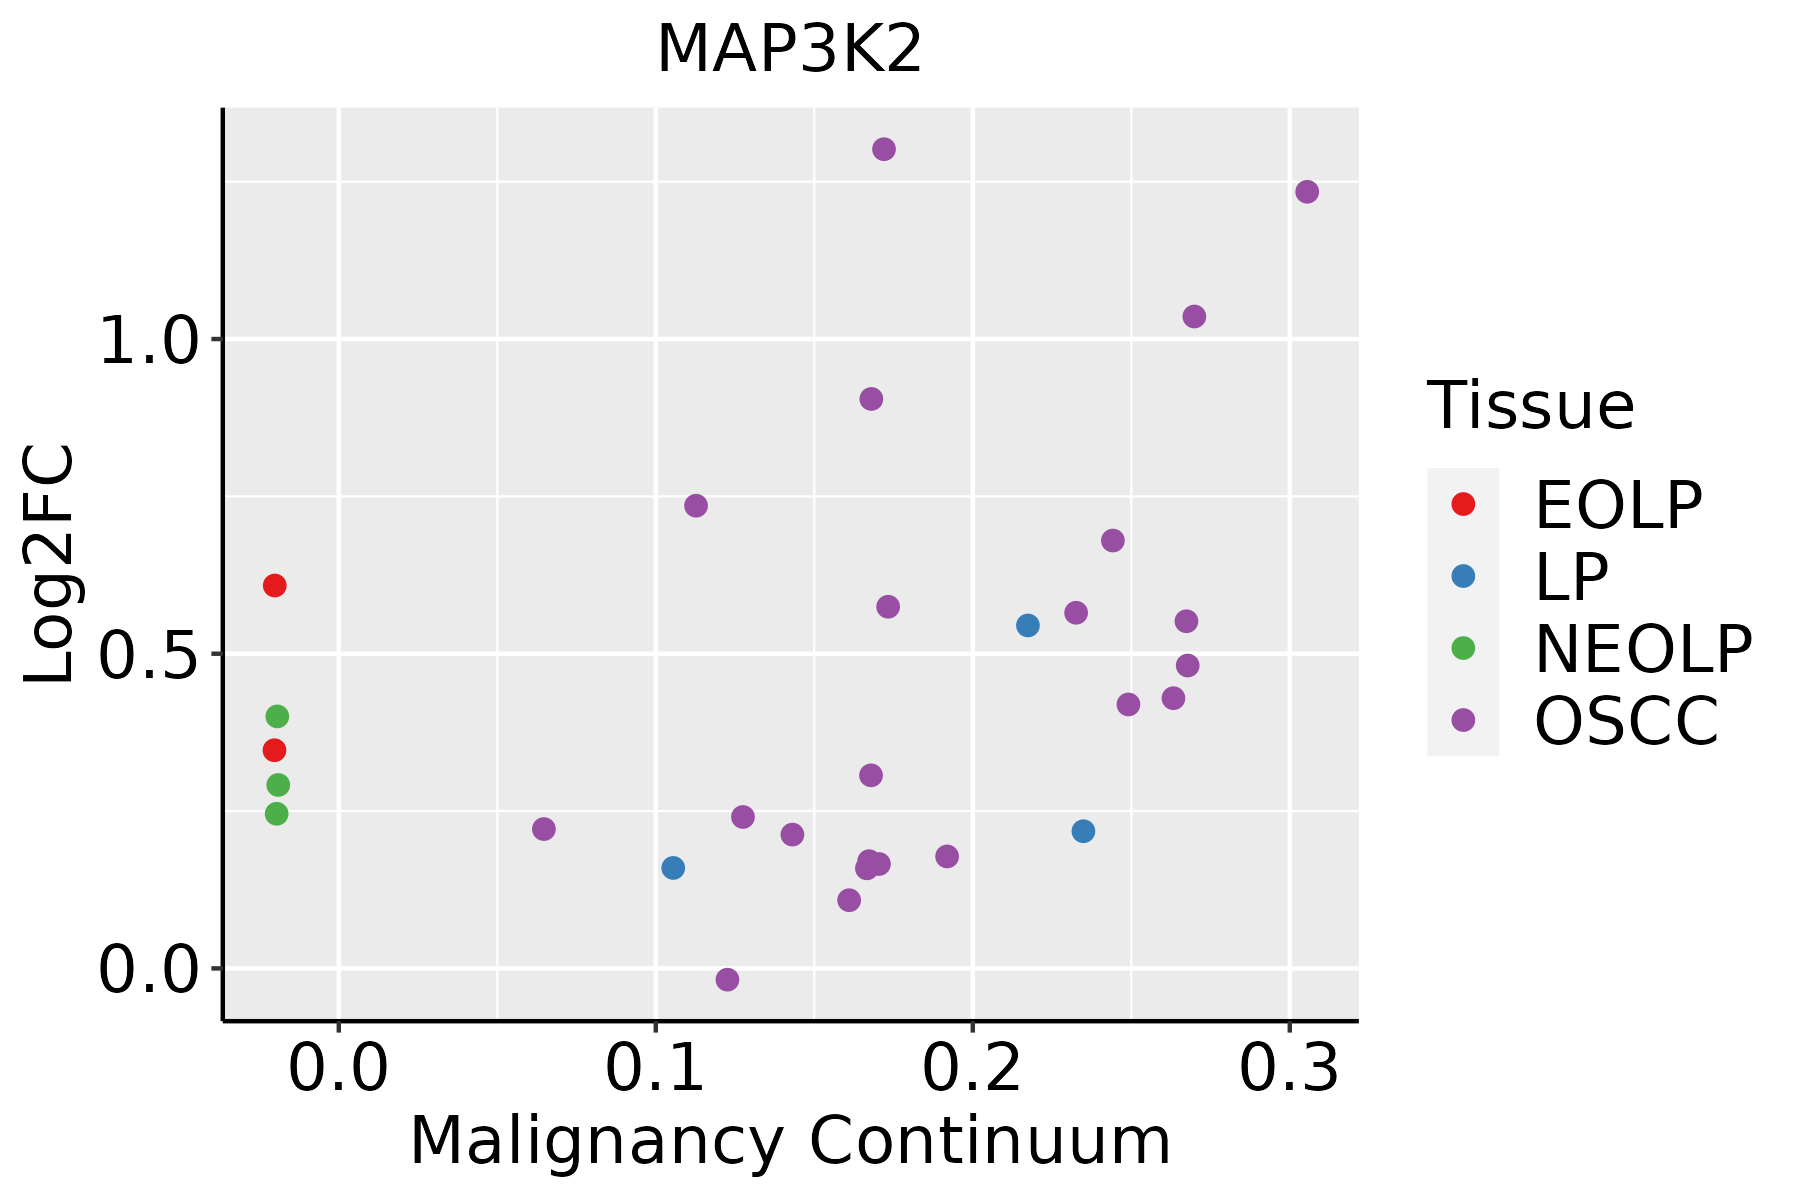 | EOLP: Erosive Oral lichen planus |
| LP: leukoplakia | ||
| NEOLP: Non-erosive oral lichen planus | ||
| OSCC: Oral squamous cell carcinoma | ||
| Prostate |  | BPH: Benign Prostatic Hyperplasia |
| Skin | 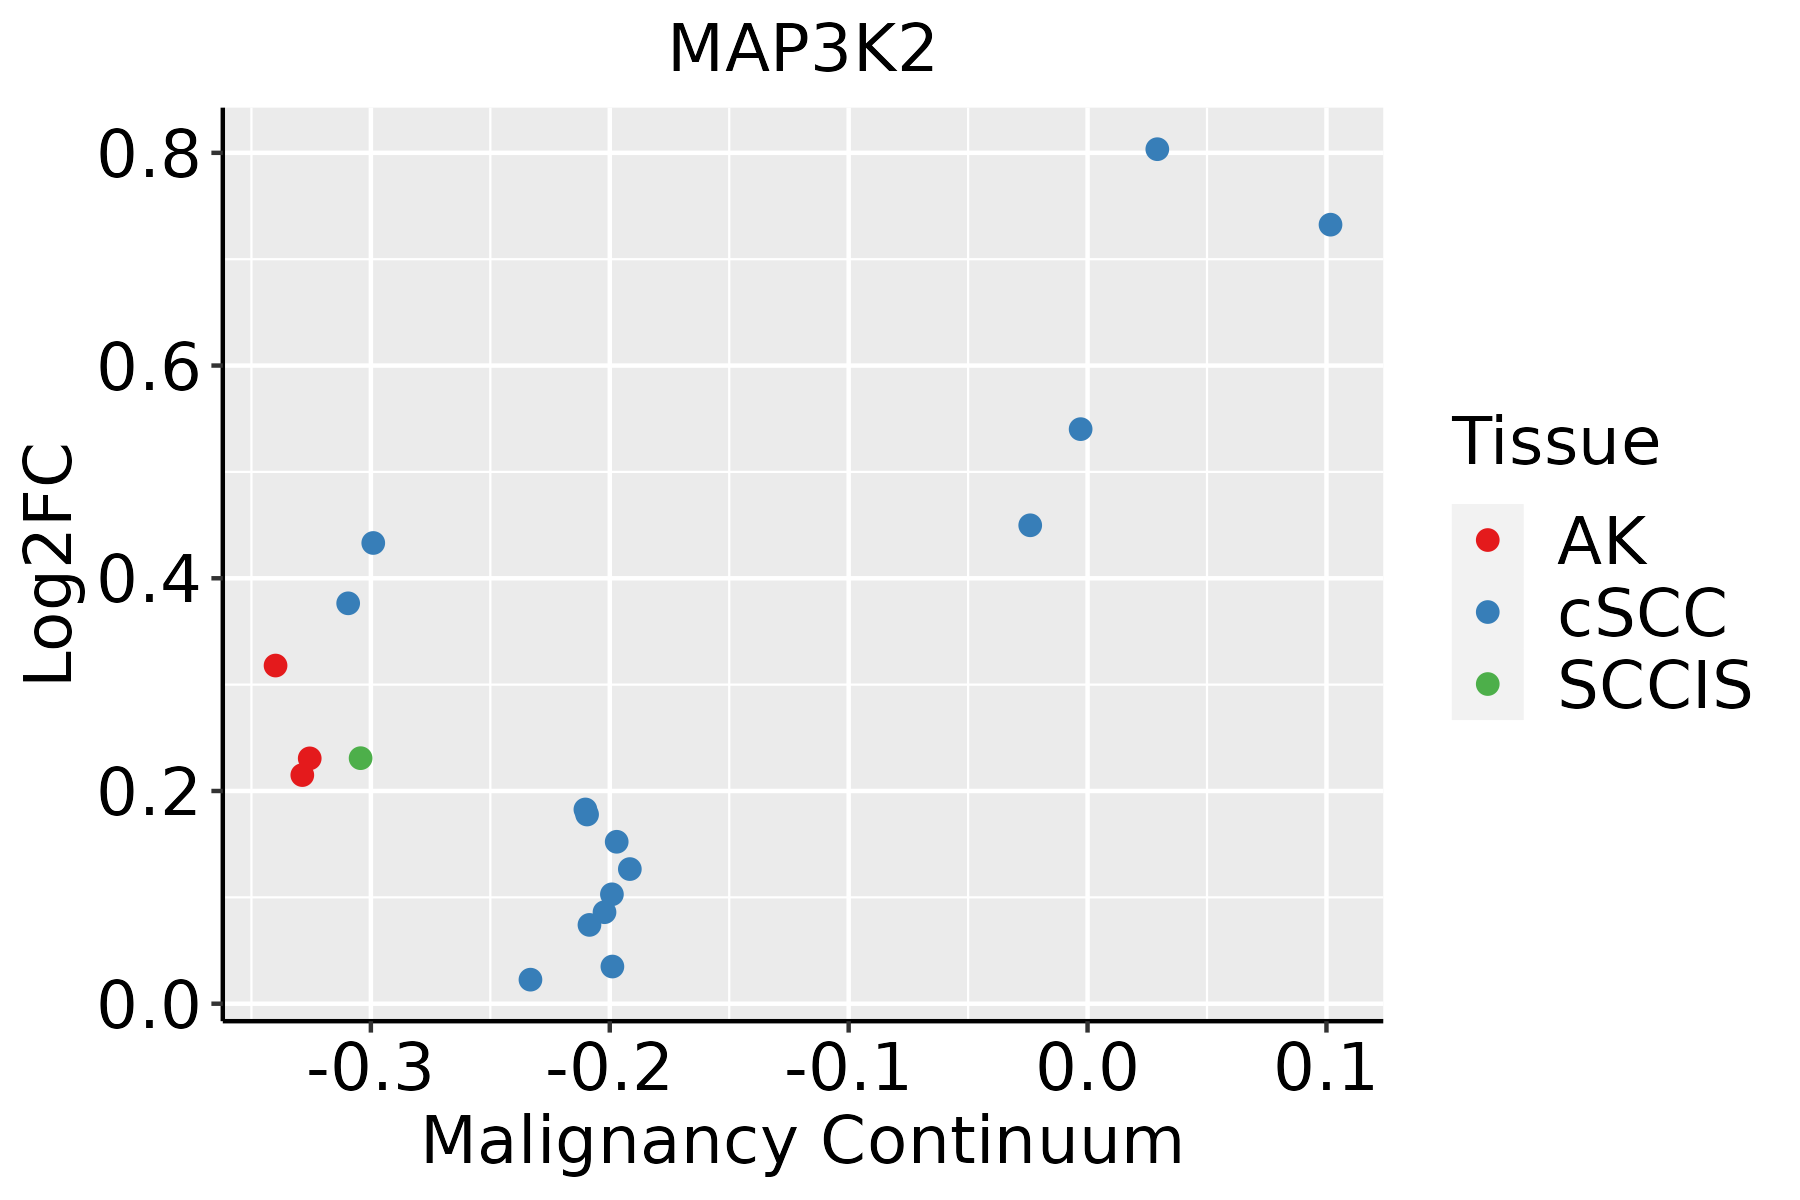 | AK: Actinic keratosis |
| cSCC: Cutaneous squamous cell carcinoma | ||
| SCCIS:squamous cell carcinoma in situ | ||
| Thyroid | 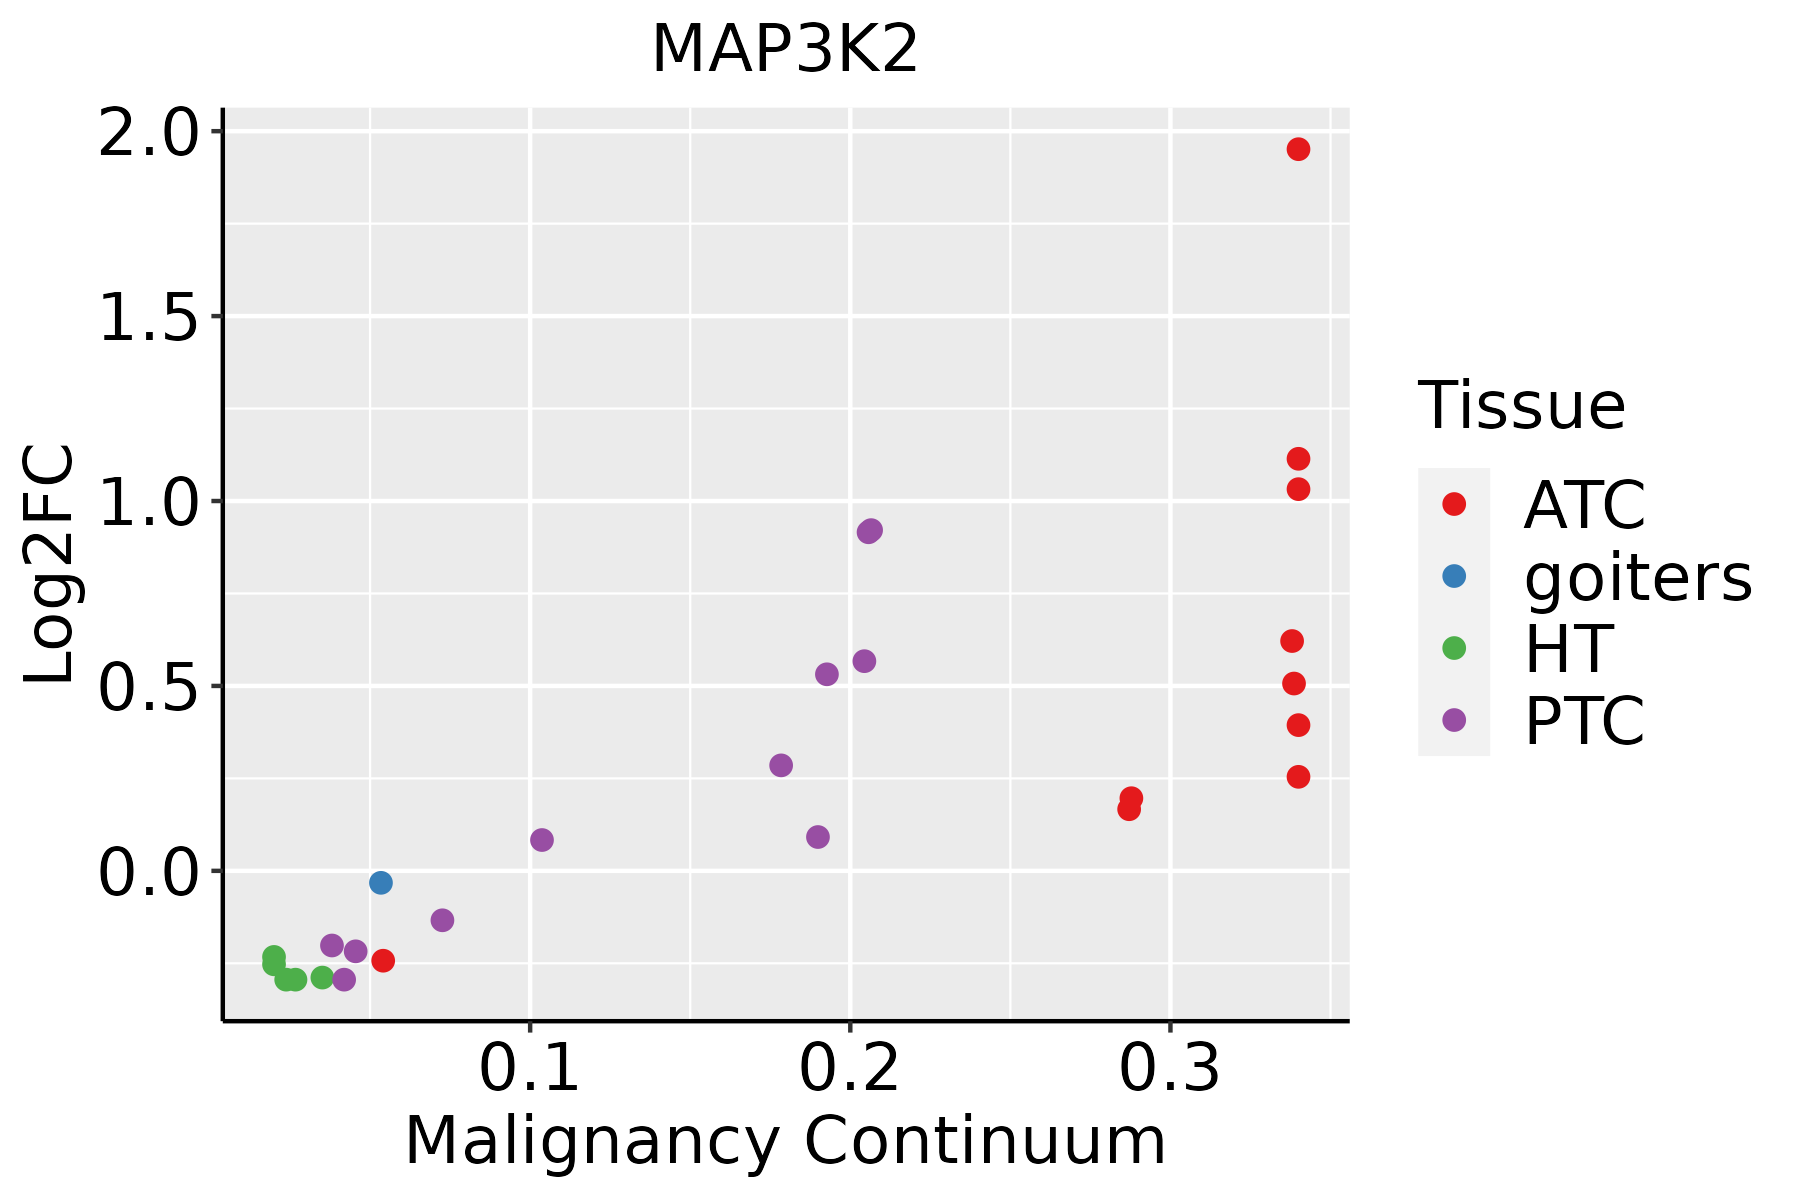 | ATC: Anaplastic thyroid cancer |
| HT: Hashimoto's thyroiditis | ||
| PTC: Papillary thyroid cancer |
| ∗log2FC in expression of this searched gene in stem-like cells from each diseased tissue sample relative to stem-like cells in normal samples in each tissue plotted against the malignancy continuum. Samples are colored based on if they are from different disease stage. |
Top |
Malignant transformation related pathway analysis |
| Find out the enriched GO biological processes and KEGG pathways involved in transition from healthy to precancer to cancer |
| Tissue | Disease Stage | Enriched GO biological Processes |
| Colorectum | AD |  |
| Colorectum | SER |  |
| Colorectum | MSS |  |
| Colorectum | MSI-H |  |
| Colorectum | FAP |  |
| ∗Top 15 enriched GO BP terms are showed in the bar plot of each disease state in each tissue. Each row represents a significant GO biological process which is colored according to the -log10(p.adjust). |
| Page: 1 2 3 4 5 6 7 8 9 |
| GO ID | Tissue | Disease Stage | Description | Gene Ratio | Bg Ratio | pvalue | p.adjust | Count |
| GO:007149610 | Cervix | CC | cellular response to external stimulus | 78/2311 | 320/18723 | 1.82e-09 | 1.98e-07 | 78 |
| GO:00712148 | Cervix | CC | cellular response to abiotic stimulus | 69/2311 | 331/18723 | 7.36e-06 | 1.73e-04 | 69 |
| GO:01040048 | Cervix | CC | cellular response to environmental stimulus | 69/2311 | 331/18723 | 7.36e-06 | 1.73e-04 | 69 |
| GO:00096127 | Cervix | CC | response to mechanical stimulus | 48/2311 | 216/18723 | 3.23e-05 | 5.29e-04 | 48 |
| GO:00712602 | Cervix | CC | cellular response to mechanical stimulus | 23/2311 | 81/18723 | 8.34e-05 | 1.12e-03 | 23 |
| GO:0046777 | Colorectum | AD | protein autophosphorylation | 74/3918 | 227/18723 | 2.48e-05 | 4.76e-04 | 74 |
| GO:2001020 | Colorectum | AD | regulation of response to DNA damage stimulus | 71/3918 | 219/18723 | 4.38e-05 | 7.65e-04 | 71 |
| GO:0071496 | Colorectum | AD | cellular response to external stimulus | 94/3918 | 320/18723 | 1.98e-04 | 2.64e-03 | 94 |
| GO:0051403 | Colorectum | AD | stress-activated MAPK cascade | 72/3918 | 239/18723 | 4.77e-04 | 5.25e-03 | 72 |
| GO:0031098 | Colorectum | AD | stress-activated protein kinase signaling cascade | 74/3918 | 247/18723 | 4.80e-04 | 5.27e-03 | 74 |
| GO:2001022 | Colorectum | AD | positive regulation of response to DNA damage stimulus | 36/3918 | 105/18723 | 1.02e-03 | 9.47e-03 | 36 |
| GO:0048736 | Colorectum | AD | appendage development | 51/3918 | 172/18723 | 4.20e-03 | 2.89e-02 | 51 |
| GO:0060173 | Colorectum | AD | limb development | 51/3918 | 172/18723 | 4.20e-03 | 2.89e-02 | 51 |
| GO:0007346 | Colorectum | AD | regulation of mitotic cell cycle | 119/3918 | 457/18723 | 4.60e-03 | 3.14e-02 | 119 |
| GO:0045787 | Colorectum | AD | positive regulation of cell cycle | 85/3918 | 313/18723 | 4.76e-03 | 3.22e-02 | 85 |
| GO:00467771 | Colorectum | SER | protein autophosphorylation | 60/2897 | 227/18723 | 1.36e-05 | 4.25e-04 | 60 |
| GO:20010202 | Colorectum | MSS | regulation of response to DNA damage stimulus | 64/3467 | 219/18723 | 7.20e-05 | 1.21e-03 | 64 |
| GO:00467772 | Colorectum | MSS | protein autophosphorylation | 63/3467 | 227/18723 | 3.96e-04 | 4.91e-03 | 63 |
| GO:00310982 | Colorectum | MSS | stress-activated protein kinase signaling cascade | 67/3467 | 247/18723 | 5.28e-04 | 5.99e-03 | 67 |
| GO:00514032 | Colorectum | MSS | stress-activated MAPK cascade | 65/3467 | 239/18723 | 5.87e-04 | 6.49e-03 | 65 |
| Page: 1 2 3 4 5 6 7 8 9 10 11 12 13 14 15 16 17 18 |
| Pathway ID | Tissue | Disease Stage | Description | Gene Ratio | Bg Ratio | pvalue | p.adjust | qvalue | Count |
| hsa0491212 | Cervix | CC | GnRH signaling pathway | 26/1267 | 93/8465 | 8.72e-04 | 3.87e-03 | 2.29e-03 | 26 |
| hsa040109 | Cervix | CC | MAPK signaling pathway | 62/1267 | 302/8465 | 4.89e-03 | 1.67e-02 | 9.86e-03 | 62 |
| hsa04540 | Cervix | CC | Gap junction | 22/1267 | 88/8465 | 9.07e-03 | 2.85e-02 | 1.69e-02 | 22 |
| hsa0491213 | Cervix | CC | GnRH signaling pathway | 26/1267 | 93/8465 | 8.72e-04 | 3.87e-03 | 2.29e-03 | 26 |
| hsa0401012 | Cervix | CC | MAPK signaling pathway | 62/1267 | 302/8465 | 4.89e-03 | 1.67e-02 | 9.86e-03 | 62 |
| hsa045401 | Cervix | CC | Gap junction | 22/1267 | 88/8465 | 9.07e-03 | 2.85e-02 | 1.69e-02 | 22 |
| hsa04912 | Colorectum | AD | GnRH signaling pathway | 35/2092 | 93/8465 | 3.69e-03 | 1.90e-02 | 1.21e-02 | 35 |
| hsa049121 | Colorectum | AD | GnRH signaling pathway | 35/2092 | 93/8465 | 3.69e-03 | 1.90e-02 | 1.21e-02 | 35 |
| hsa049126 | Colorectum | FAP | GnRH signaling pathway | 28/1404 | 93/8465 | 8.16e-04 | 5.14e-03 | 3.13e-03 | 28 |
| hsa04010 | Colorectum | FAP | MAPK signaling pathway | 68/1404 | 302/8465 | 4.00e-03 | 1.67e-02 | 1.02e-02 | 68 |
| hsa049127 | Colorectum | FAP | GnRH signaling pathway | 28/1404 | 93/8465 | 8.16e-04 | 5.14e-03 | 3.13e-03 | 28 |
| hsa040101 | Colorectum | FAP | MAPK signaling pathway | 68/1404 | 302/8465 | 4.00e-03 | 1.67e-02 | 1.02e-02 | 68 |
| hsa049128 | Colorectum | CRC | GnRH signaling pathway | 25/1091 | 93/8465 | 2.11e-04 | 2.71e-03 | 1.84e-03 | 25 |
| hsa040102 | Colorectum | CRC | MAPK signaling pathway | 56/1091 | 302/8465 | 2.76e-03 | 1.77e-02 | 1.20e-02 | 56 |
| hsa049129 | Colorectum | CRC | GnRH signaling pathway | 25/1091 | 93/8465 | 2.11e-04 | 2.71e-03 | 1.84e-03 | 25 |
| hsa040103 | Colorectum | CRC | MAPK signaling pathway | 56/1091 | 302/8465 | 2.76e-03 | 1.77e-02 | 1.20e-02 | 56 |
| hsa040108 | Lung | IAC | MAPK signaling pathway | 62/1053 | 302/8465 | 3.54e-05 | 6.38e-04 | 4.24e-04 | 62 |
| hsa0491210 | Lung | IAC | GnRH signaling pathway | 20/1053 | 93/8465 | 9.36e-03 | 3.62e-02 | 2.41e-02 | 20 |
| hsa0401011 | Lung | IAC | MAPK signaling pathway | 62/1053 | 302/8465 | 3.54e-05 | 6.38e-04 | 4.24e-04 | 62 |
| hsa0491211 | Lung | IAC | GnRH signaling pathway | 20/1053 | 93/8465 | 9.36e-03 | 3.62e-02 | 2.41e-02 | 20 |
| Page: 1 2 |
Top |
Cell-cell communication analysis |
| Identification of potential cell-cell interactions between two cell types and their ligand-receptor pairs for different disease states |
| Ligand | Receptor | LRpair | Pathway | Tissue | Disease Stage |
| Page: 1 |
Top |
Single-cell gene regulatory network inference analysis |
| Find out the significant the regulons (TFs) and the target genes of each regulon across cell types for different disease states |
| TF | Cell Type | Tissue | Disease Stage | Target Gene | RSS | Regulon Activity |
| ∗The dot plots of a searched regulon are shown for all cell subpopulations in each disease state of each tissue based on the regulon specific score inferred using pySCENIC and by calculating the average expression. |
| Page: 1 |
Top |
Somatic mutation of malignant transformation related genes |
| Annotation of somatic variants for genes involved in malignant transformation |
| Hugo Symbol | Variant Class | Variant Classification | dbSNP RS | HGVSc | HGVSp | HGVSp Short | SWISSPROT | BIOTYPE | SIFT | PolyPhen | Tumor Sample Barcode | Tissue | Histology | Sex | Age | Stage | Therapy Types | Drugs | Outcome |
| MAP3K2 | SNV | Missense_Mutation | c.1550N>T | p.Gly517Val | p.G517V | Q9Y2U5 | protein_coding | deleterious(0) | possibly_damaging(0.566) | TCGA-AC-A23H-01 | Breast | breast invasive carcinoma | Female | >=65 | I/II | Unknown | Unknown | PD | |
| MAP3K2 | SNV | Missense_Mutation | c.1210N>A | p.Glu404Lys | p.E404K | Q9Y2U5 | protein_coding | tolerated(0.1) | benign(0.348) | TCGA-D8-A1J8-01 | Breast | breast invasive carcinoma | Female | >=65 | I/II | Hormone Therapy | nolvadex | SD | |
| MAP3K2 | SNV | Missense_Mutation | novel | c.928N>G | p.Thr310Ala | p.T310A | Q9Y2U5 | protein_coding | tolerated(0.41) | benign(0.003) | TCGA-HN-A2NL-01 | Breast | breast invasive carcinoma | Female | <65 | I/II | Chemotherapy | cyclophosphamide | SD |
| MAP3K2 | SNV | Missense_Mutation | novel | c.832A>G | p.Asn278Asp | p.N278D | Q9Y2U5 | protein_coding | tolerated(0.17) | benign(0.044) | TCGA-2W-A8YY-01 | Cervix | cervical & endocervical cancer | Female | <65 | I/II | Chemotherapy | cisplatin | CR |
| MAP3K2 | SNV | Missense_Mutation | novel | c.883N>G | p.Leu295Val | p.L295V | Q9Y2U5 | protein_coding | deleterious(0.02) | benign(0) | TCGA-VS-A8EL-01 | Cervix | cervical & endocervical cancer | Female | <65 | I/II | Chemotherapy | cisplatin | CR |
| MAP3K2 | SNV | Missense_Mutation | c.987N>T | p.Arg329Ser | p.R329S | Q9Y2U5 | protein_coding | tolerated(0.18) | benign(0.071) | TCGA-AA-3494-01 | Colorectum | colon adenocarcinoma | Male | <65 | III/IV | Chemotherapy | folinic | PR | |
| MAP3K2 | SNV | Missense_Mutation | novel | c.740T>G | p.Phe247Cys | p.F247C | Q9Y2U5 | protein_coding | tolerated(0.26) | benign(0.005) | TCGA-AA-3984-01 | Colorectum | colon adenocarcinoma | Female | <65 | I/II | Unknown | Unknown | SD |
| MAP3K2 | SNV | Missense_Mutation | c.1601G>A | p.Ser534Asn | p.S534N | Q9Y2U5 | protein_coding | tolerated(0.56) | benign(0.066) | TCGA-AD-6964-01 | Colorectum | colon adenocarcinoma | Male | <65 | III/IV | Chemotherapy | folfox | PD | |
| MAP3K2 | SNV | Missense_Mutation | rs376189453 | c.1018G>A | p.Val340Ile | p.V340I | Q9Y2U5 | protein_coding | tolerated(0.05) | benign(0.158) | TCGA-AD-6964-01 | Colorectum | colon adenocarcinoma | Male | <65 | III/IV | Chemotherapy | folfox | PD |
| MAP3K2 | SNV | Missense_Mutation | novel | c.219N>C | p.Lys73Asn | p.K73N | Q9Y2U5 | protein_coding | deleterious(0.03) | possibly_damaging(0.735) | TCGA-CA-6717-01 | Colorectum | colon adenocarcinoma | Male | <65 | I/II | Chemotherapy | oxaliplatin | CR |
| Page: 1 2 3 4 5 6 |
Top |
Related drugs of malignant transformation related genes |
| Identification of chemicals and drugs interact with genes involved in malignant transfromation |
| (DGIdb 4.0) |
| Entrez ID | Symbol | Category | Interaction Types | Drug Claim Name | Drug Name | PMIDs |
| 10746 | MAP3K2 | SERINE THREONINE KINASE, KINASE, DRUGGABLE GENOME, ENZYME | CI-1040 | CI-1040 | ||
| 10746 | MAP3K2 | SERINE THREONINE KINASE, KINASE, DRUGGABLE GENOME, ENZYME | inhibitor | 249565786 |
| Page: 1 |

Copyright 2023-Present -The University of Texas Health Science Center at Houston |