
|
|||||
|
 | |
| |
| |
| |
| |
| |
|
Gene: MAP3K13 |
Gene summary for MAP3K13 |
| Gene information | Species | Human | Gene symbol | MAP3K13 | Gene ID | 9175 |
| Gene name | mitogen-activated protein kinase kinase kinase 13 | |
| Gene Alias | LZK | |
| Cytomap | 3q27.2 | |
| Gene Type | protein-coding | GO ID | GO:0000165 | UniProtAcc | O43283 |
Top |
Malignant transformation analysis |
| Identification of the aberrant gene expression in precancerous and cancerous lesions by comparing the gene expression of stem-like cells in diseased tissues with normal stem cells |
| Entrez ID | Symbol | Replicates | Species | Organ | Tissue | Adj P-value | Log2FC | Malignancy |
| 9175 | MAP3K13 | CCI_2 | Human | Cervix | CC | 1.69e-11 | 1.82e+00 | 0.5249 |
| 9175 | MAP3K13 | CCI_3 | Human | Cervix | CC | 7.06e-15 | 1.52e+00 | 0.516 |
| 9175 | MAP3K13 | Tumor | Human | Cervix | CC | 1.06e-13 | 4.51e-01 | 0.1241 |
| 9175 | MAP3K13 | sample1 | Human | Cervix | CC | 4.60e-07 | 5.44e-01 | 0.0959 |
| 9175 | MAP3K13 | sample3 | Human | Cervix | CC | 5.25e-33 | 6.07e-01 | 0.1387 |
| 9175 | MAP3K13 | H2 | Human | Cervix | HSIL_HPV | 2.27e-03 | 2.91e-01 | 0.0632 |
| 9175 | MAP3K13 | T1 | Human | Cervix | CC | 1.62e-10 | 4.94e-01 | 0.0918 |
| 9175 | MAP3K13 | T3 | Human | Cervix | CC | 4.22e-21 | 5.42e-01 | 0.1389 |
| 9175 | MAP3K13 | HTA11_78_2000001011 | Human | Colorectum | AD | 7.96e-03 | 4.99e-01 | -0.1088 |
| 9175 | MAP3K13 | HTA11_347_2000001011 | Human | Colorectum | AD | 7.53e-32 | 1.06e+00 | -0.1954 |
| 9175 | MAP3K13 | HTA11_83_2000001011 | Human | Colorectum | SER | 5.47e-06 | 5.87e-01 | -0.1526 |
| 9175 | MAP3K13 | HTA11_866_2000001011 | Human | Colorectum | AD | 3.37e-03 | 4.78e-01 | -0.1001 |
| 9175 | MAP3K13 | HTA11_1391_2000001011 | Human | Colorectum | AD | 6.95e-03 | 4.88e-01 | -0.059 |
| 9175 | MAP3K13 | HTA11_99999965104_69814 | Human | Colorectum | MSS | 1.59e-18 | 1.15e+00 | 0.281 |
| 9175 | MAP3K13 | HTA11_99999974143_84620 | Human | Colorectum | MSS | 1.50e-06 | -4.26e-01 | 0.3005 |
| 9175 | MAP3K13 | F007 | Human | Colorectum | FAP | 2.34e-03 | -4.35e-01 | 0.1176 |
| 9175 | MAP3K13 | A001-C-207 | Human | Colorectum | FAP | 1.62e-07 | -4.09e-01 | 0.1278 |
| 9175 | MAP3K13 | A015-C-203 | Human | Colorectum | FAP | 1.04e-38 | -5.31e-01 | -0.1294 |
| 9175 | MAP3K13 | A015-C-204 | Human | Colorectum | FAP | 1.70e-08 | -4.52e-01 | -0.0228 |
| 9175 | MAP3K13 | A014-C-040 | Human | Colorectum | FAP | 4.49e-05 | -3.77e-01 | -0.1184 |
| Page: 1 2 3 4 5 6 7 8 9 10 11 |
| Tissue | Expression Dynamics | Abbreviation |
| Cervix | 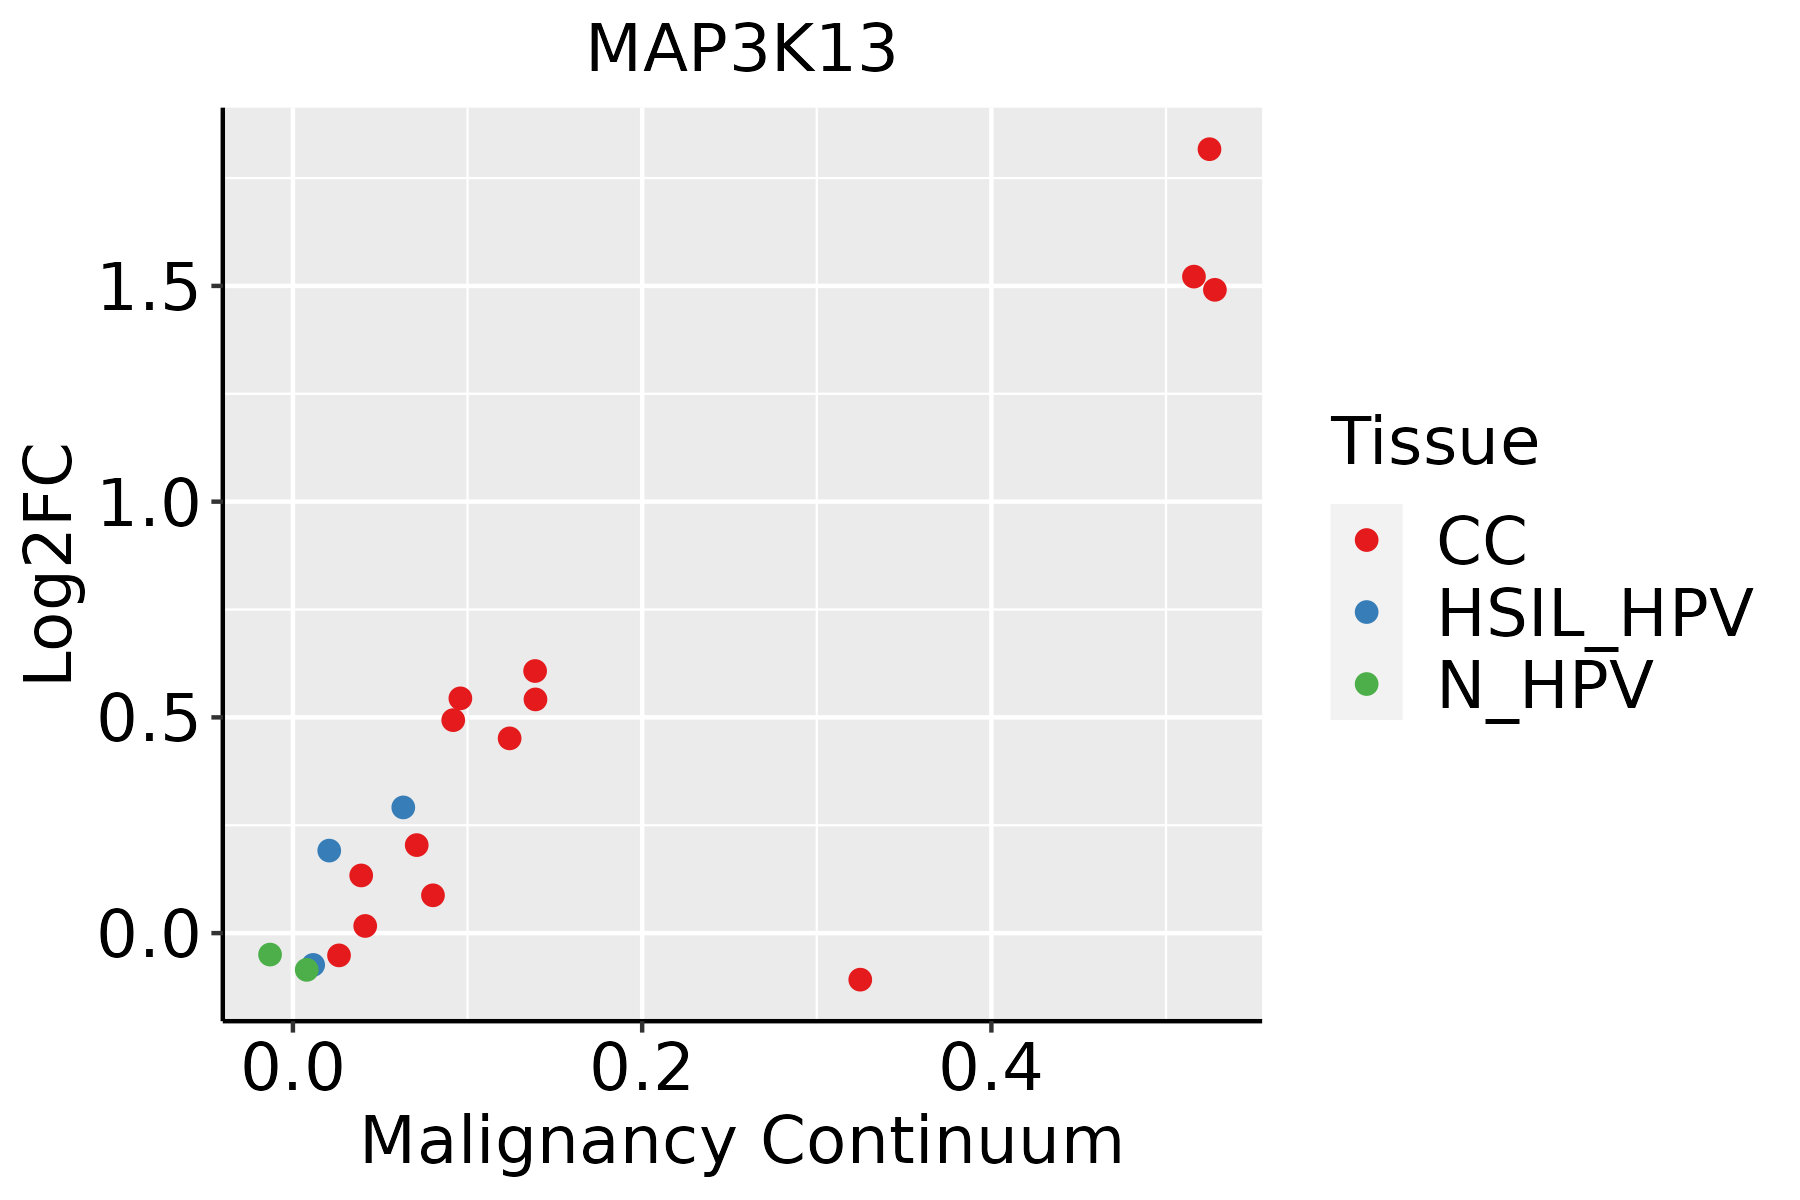 | CC: Cervix cancer |
| HSIL_HPV: HPV-infected high-grade squamous intraepithelial lesions | ||
| N_HPV: HPV-infected normal cervix | ||
| Colorectum (GSE201348) |  | FAP: Familial adenomatous polyposis |
| CRC: Colorectal cancer | ||
| Colorectum (HTA11) |  | AD: Adenomas |
| SER: Sessile serrated lesions | ||
| MSI-H: Microsatellite-high colorectal cancer | ||
| MSS: Microsatellite stable colorectal cancer | ||
| Esophagus | 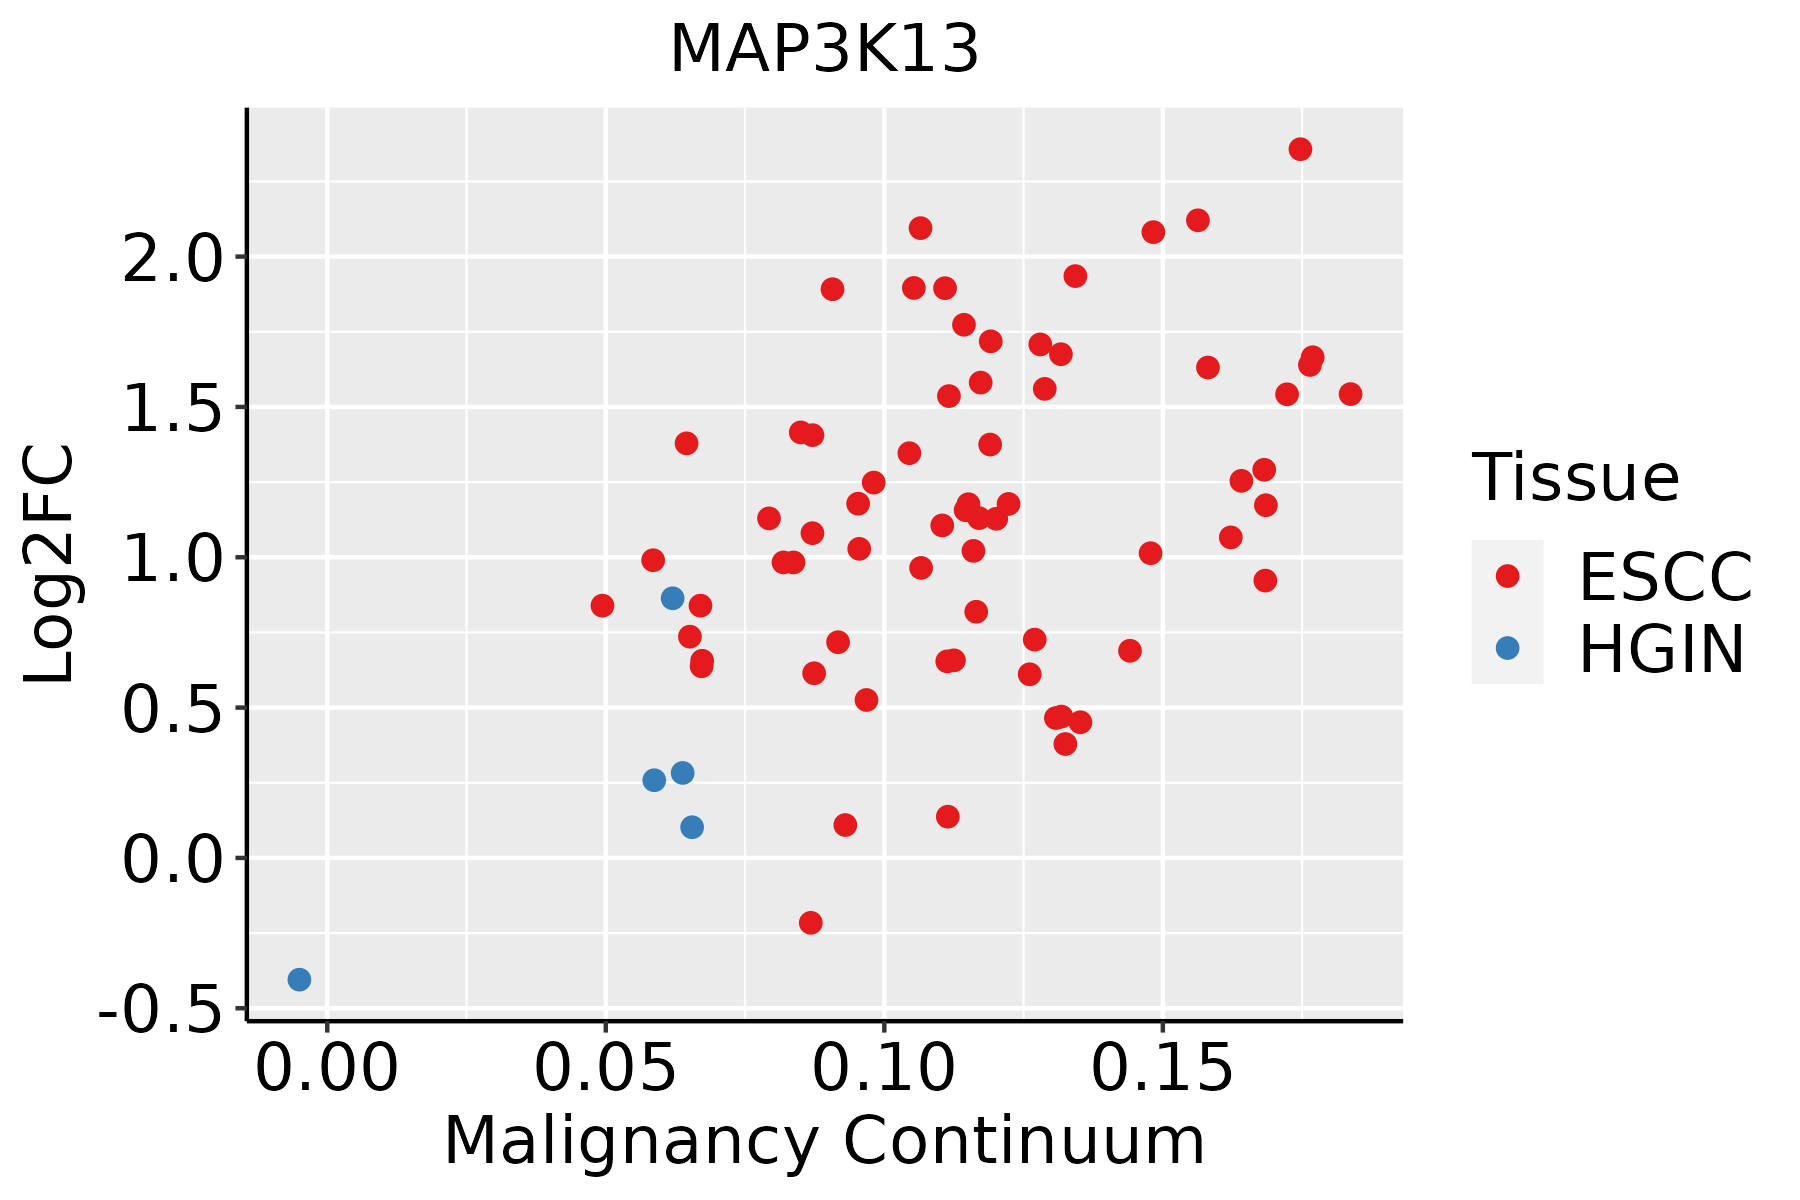 | ESCC: Esophageal squamous cell carcinoma |
| HGIN: High-grade intraepithelial neoplasias | ||
| LGIN: Low-grade intraepithelial neoplasias | ||
| Liver |  | HCC: Hepatocellular carcinoma |
| NAFLD: Non-alcoholic fatty liver disease | ||
| Lung | 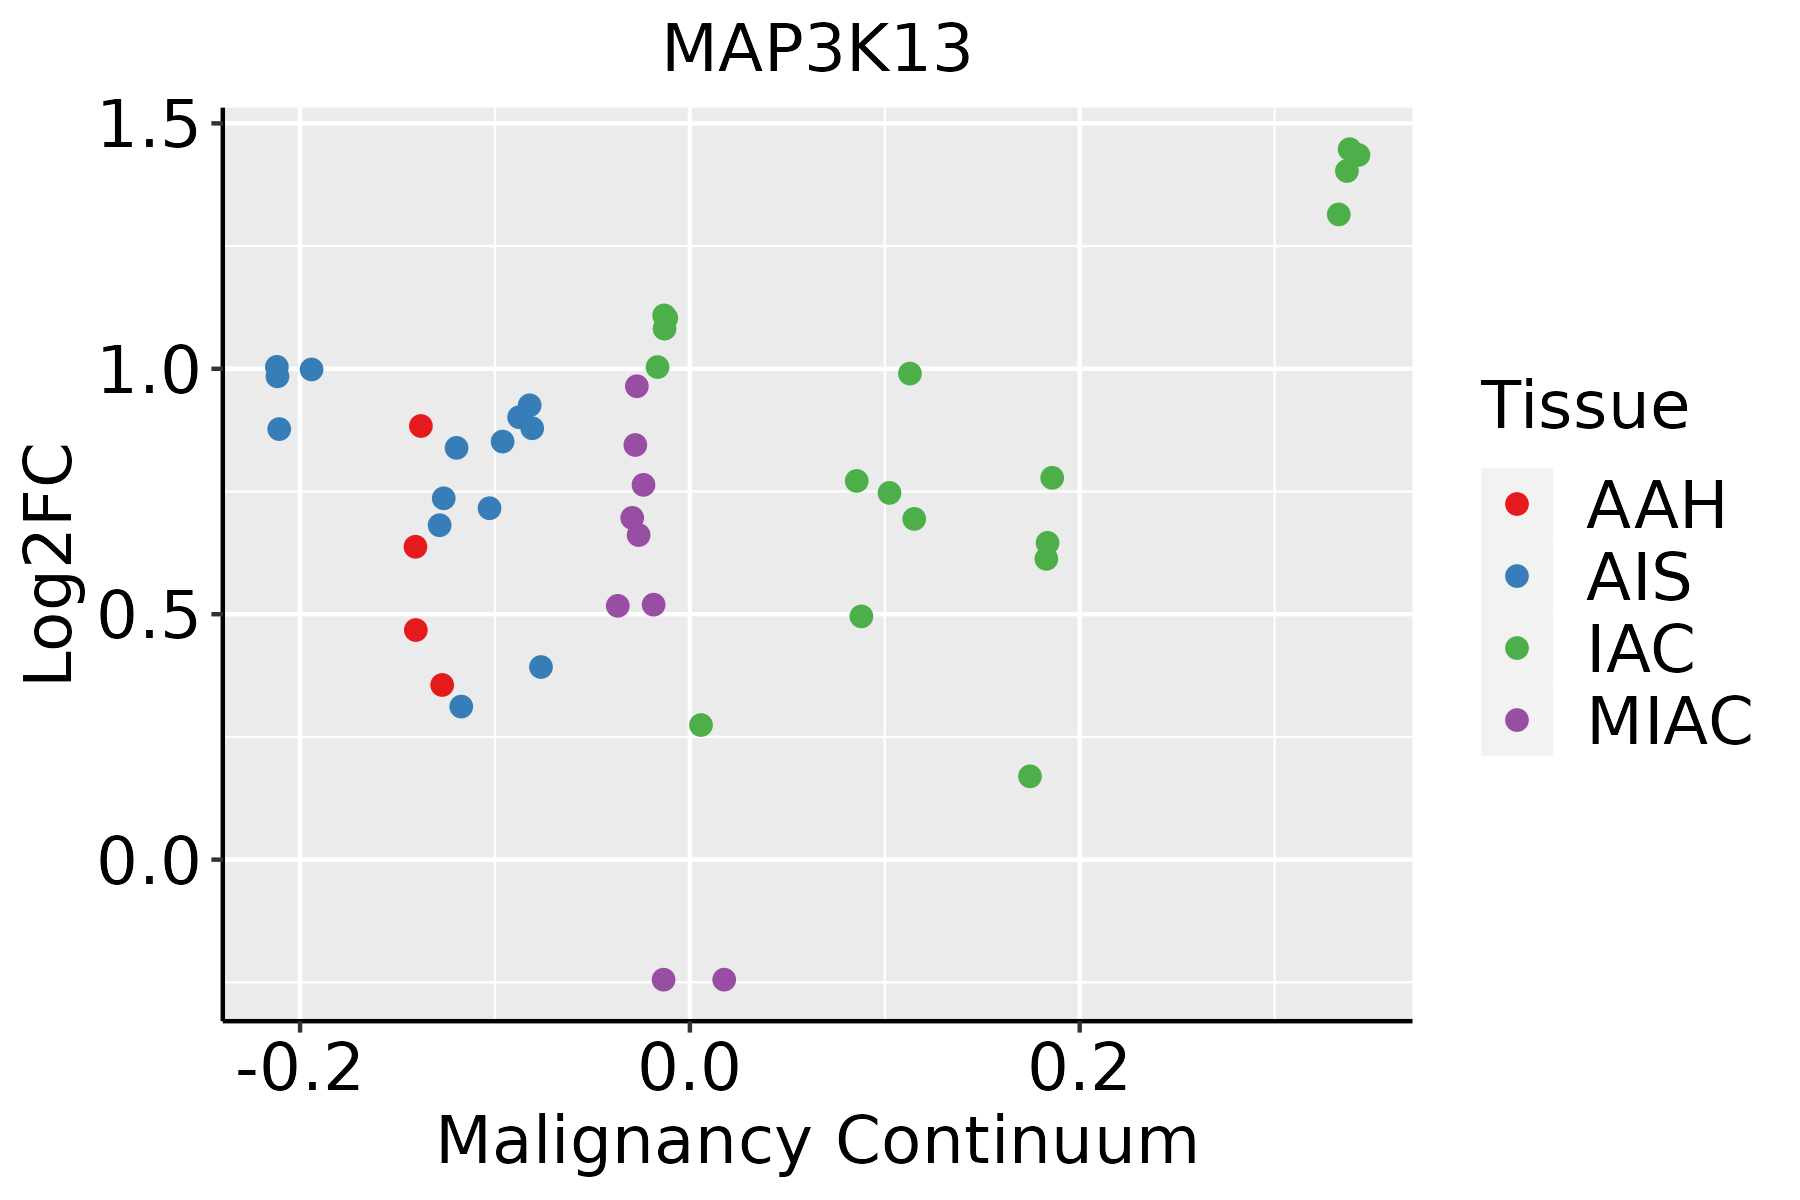 | AAH: Atypical adenomatous hyperplasia |
| AIS: Adenocarcinoma in situ | ||
| IAC: Invasive lung adenocarcinoma | ||
| MIA: Minimally invasive adenocarcinoma | ||
| Oral Cavity | 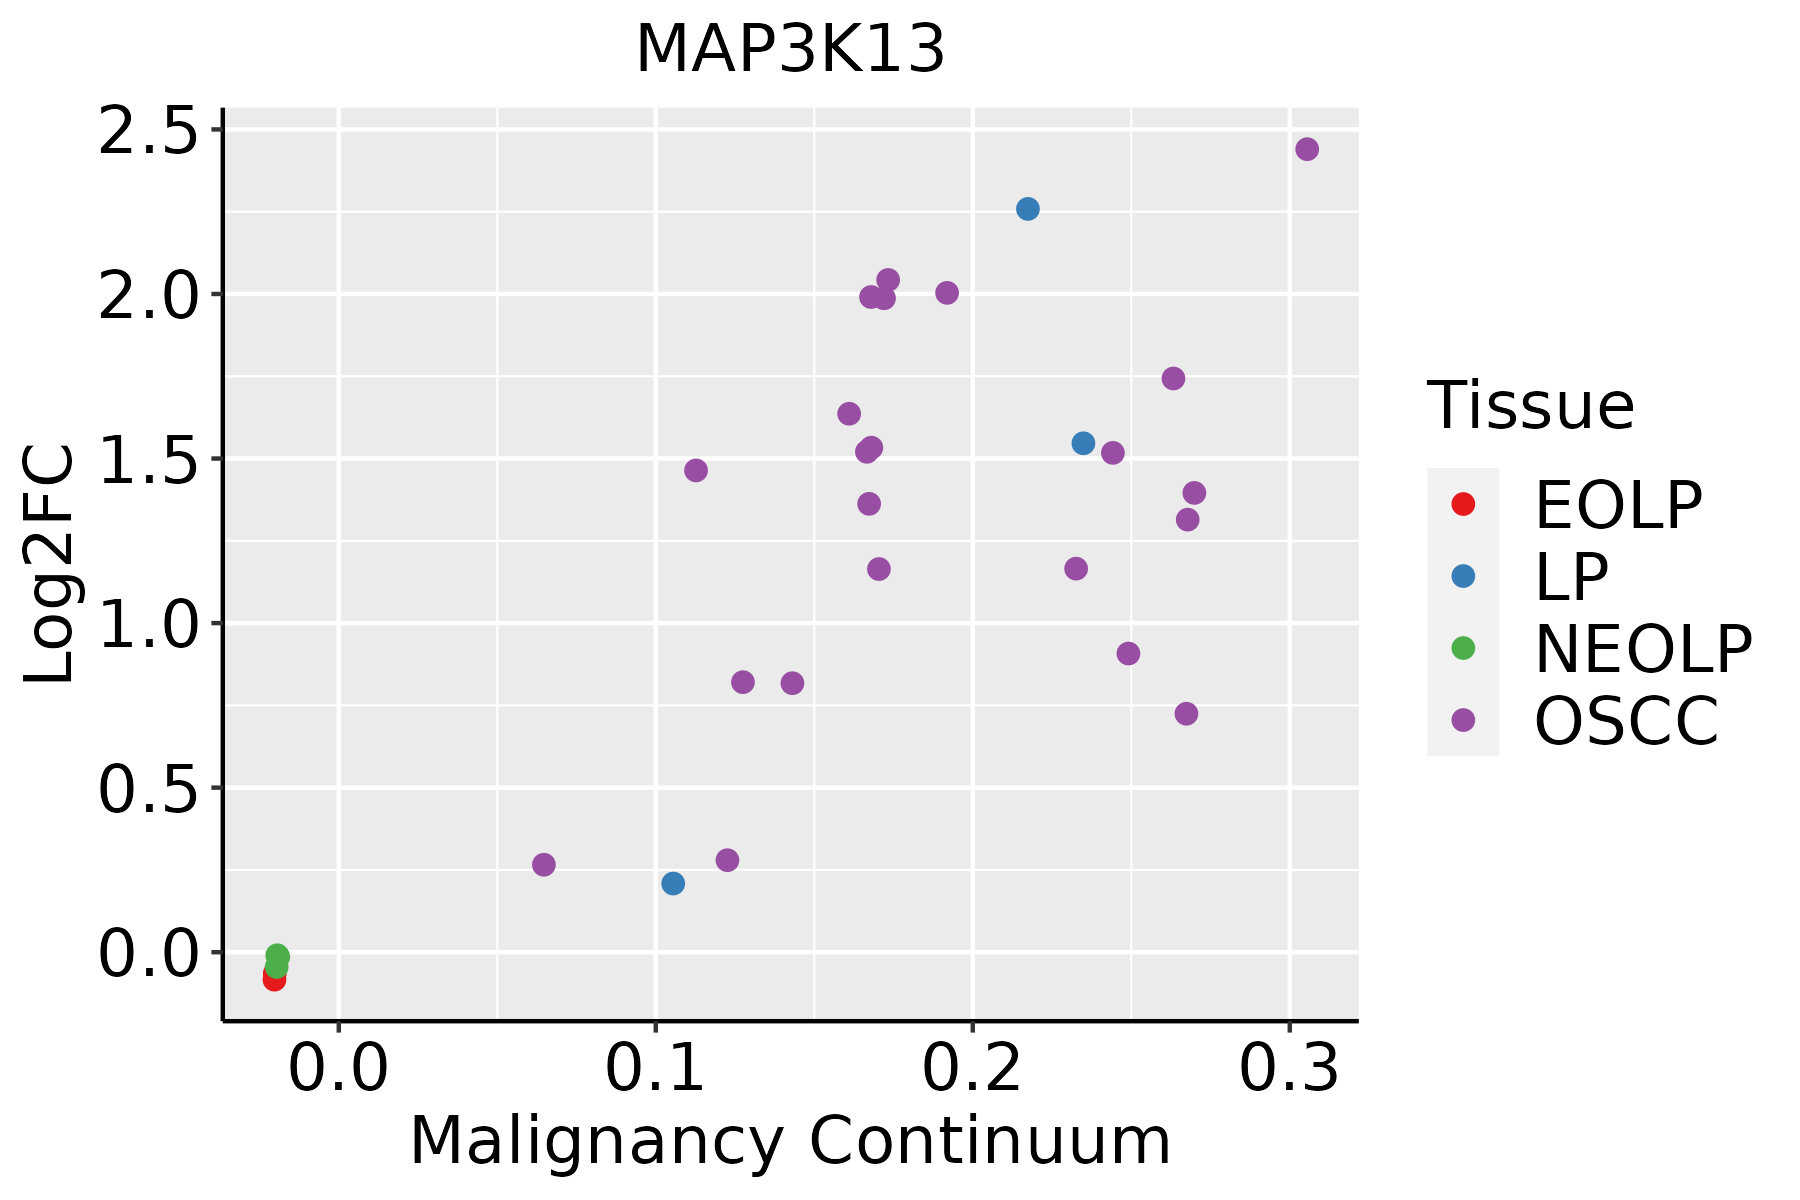 | EOLP: Erosive Oral lichen planus |
| LP: leukoplakia | ||
| NEOLP: Non-erosive oral lichen planus | ||
| OSCC: Oral squamous cell carcinoma | ||
| Prostate | 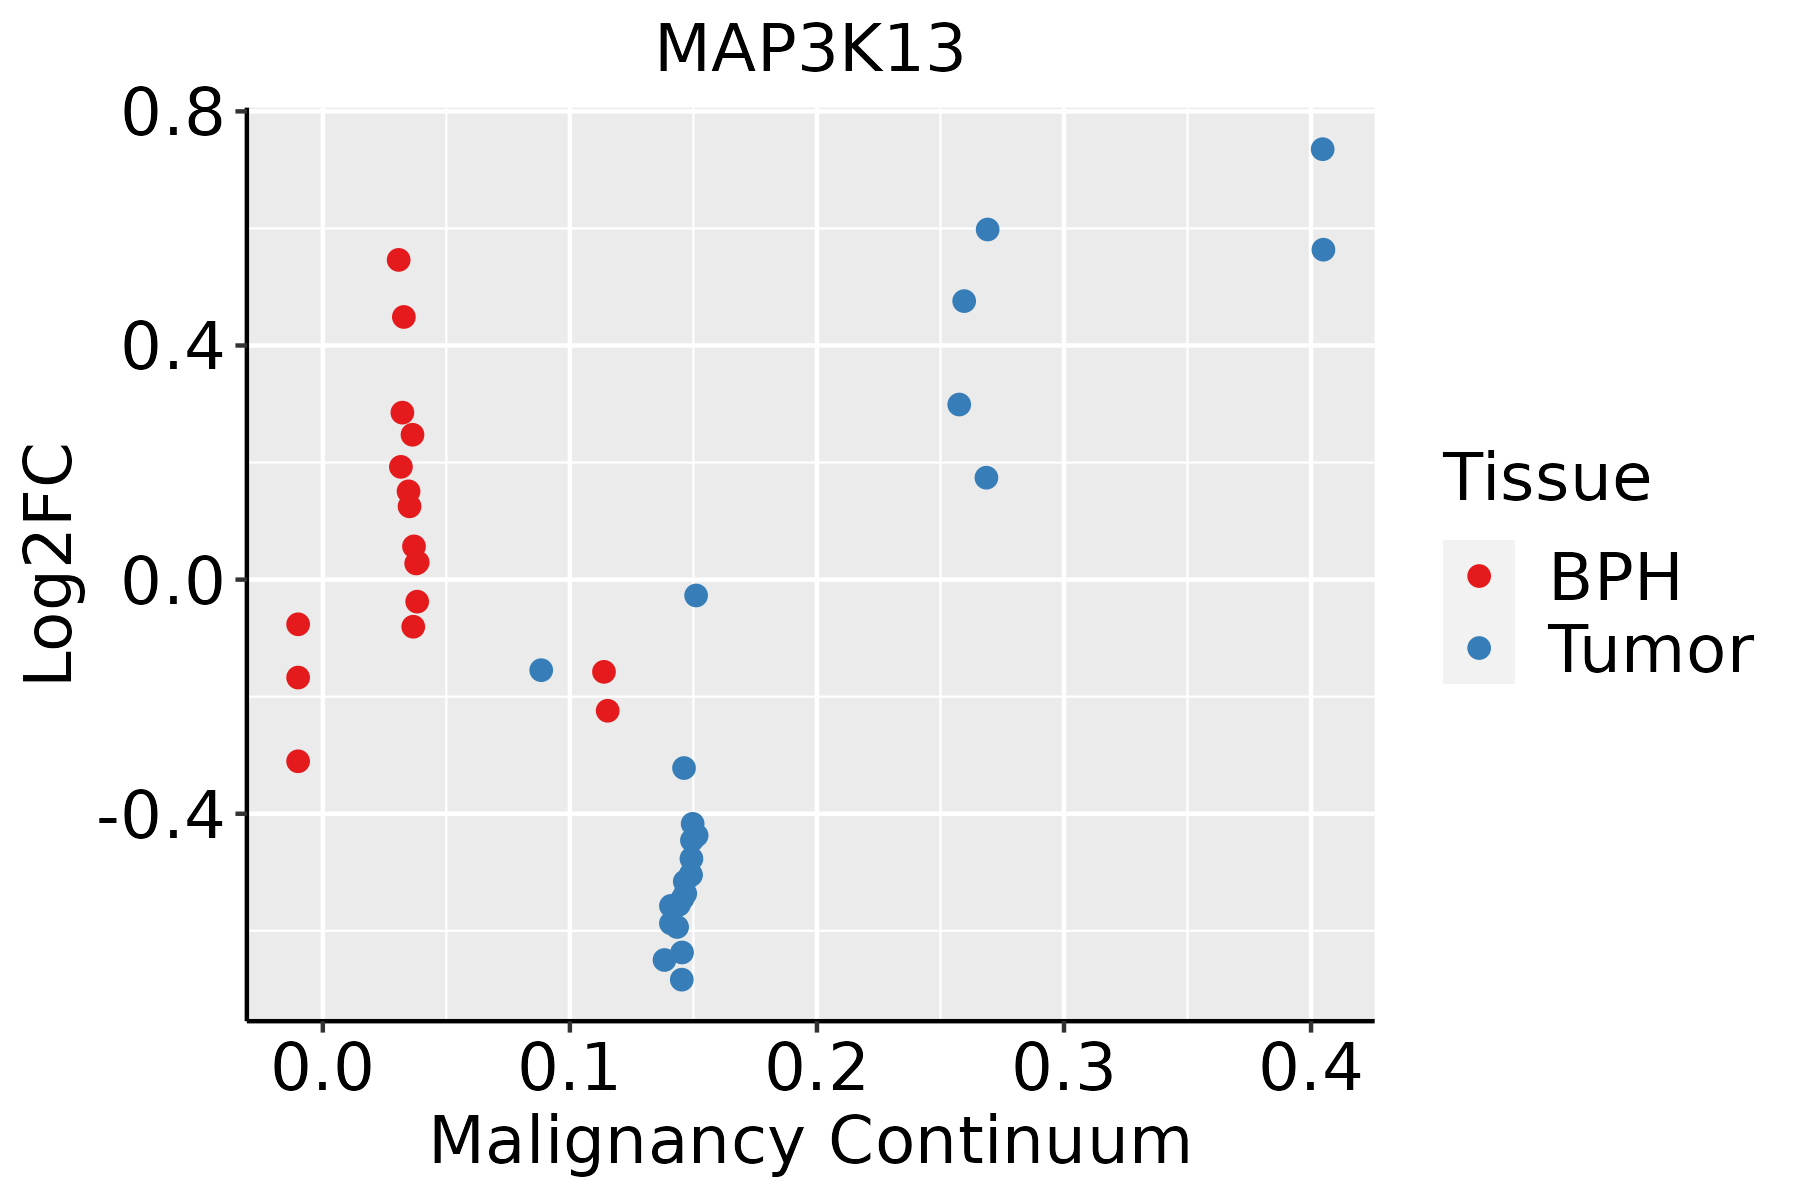 | BPH: Benign Prostatic Hyperplasia |
| Skin |  | AK: Actinic keratosis |
| cSCC: Cutaneous squamous cell carcinoma | ||
| SCCIS:squamous cell carcinoma in situ | ||
| Thyroid |  | ATC: Anaplastic thyroid cancer |
| HT: Hashimoto's thyroiditis | ||
| PTC: Papillary thyroid cancer |
| ∗log2FC in expression of this searched gene in stem-like cells from each diseased tissue sample relative to stem-like cells in normal samples in each tissue plotted against the malignancy continuum. Samples are colored based on if they are from different disease stage. |
Top |
Malignant transformation related pathway analysis |
| Find out the enriched GO biological processes and KEGG pathways involved in transition from healthy to precancer to cancer |
| Tissue | Disease Stage | Enriched GO biological Processes |
| Colorectum | AD |  |
| Colorectum | SER |  |
| Colorectum | MSS |  |
| Colorectum | MSI-H |  |
| Colorectum | FAP |  |
| ∗Top 15 enriched GO BP terms are showed in the bar plot of each disease state in each tissue. Each row represents a significant GO biological process which is colored according to the -log10(p.adjust). |
| Page: 1 2 3 4 5 6 7 8 9 |
| GO ID | Tissue | Disease Stage | Description | Gene Ratio | Bg Ratio | pvalue | p.adjust | Count |
| GO:002260410 | Cervix | CC | regulation of cell morphogenesis | 84/2311 | 309/18723 | 1.00e-12 | 4.29e-10 | 84 |
| GO:003367410 | Cervix | CC | positive regulation of kinase activity | 101/2311 | 467/18723 | 8.66e-09 | 7.22e-07 | 101 |
| GO:00458608 | Cervix | CC | positive regulation of protein kinase activity | 85/2311 | 386/18723 | 5.61e-08 | 3.29e-06 | 85 |
| GO:00310988 | Cervix | CC | stress-activated protein kinase signaling cascade | 58/2311 | 247/18723 | 8.02e-07 | 2.89e-05 | 58 |
| GO:00719007 | Cervix | CC | regulation of protein serine/threonine kinase activity | 75/2311 | 359/18723 | 2.76e-06 | 8.02e-05 | 75 |
| GO:00514038 | Cervix | CC | stress-activated MAPK cascade | 55/2311 | 239/18723 | 2.96e-06 | 8.31e-05 | 55 |
| GO:00109757 | Cervix | CC | regulation of neuron projection development | 88/2311 | 445/18723 | 4.26e-06 | 1.09e-04 | 88 |
| GO:00510904 | Cervix | CC | regulation of DNA-binding transcription factor activity | 87/2311 | 440/18723 | 4.85e-06 | 1.22e-04 | 87 |
| GO:00107206 | Cervix | CC | positive regulation of cell development | 64/2311 | 298/18723 | 5.69e-06 | 1.41e-04 | 64 |
| GO:00313467 | Cervix | CC | positive regulation of cell projection organization | 72/2311 | 353/18723 | 1.04e-05 | 2.32e-04 | 72 |
| GO:00160498 | Cervix | CC | cell growth | 92/2311 | 482/18723 | 1.16e-05 | 2.49e-04 | 92 |
| GO:00325359 | Cervix | CC | regulation of cellular component size | 76/2311 | 383/18723 | 1.66e-05 | 3.21e-04 | 76 |
| GO:00615647 | Cervix | CC | axon development | 89/2311 | 467/18723 | 1.71e-05 | 3.27e-04 | 89 |
| GO:00719025 | Cervix | CC | positive regulation of protein serine/threonine kinase activity | 46/2311 | 200/18723 | 1.87e-05 | 3.47e-04 | 46 |
| GO:00434104 | Cervix | CC | positive regulation of MAPK cascade | 90/2311 | 480/18723 | 2.92e-05 | 4.83e-04 | 90 |
| GO:00181057 | Cervix | CC | peptidyl-serine phosphorylation | 63/2311 | 315/18723 | 6.65e-05 | 9.47e-04 | 63 |
| GO:00182096 | Cervix | CC | peptidyl-serine modification | 66/2311 | 338/18723 | 9.58e-05 | 1.25e-03 | 66 |
| GO:00074097 | Cervix | CC | axonogenesis | 78/2311 | 418/18723 | 1.14e-04 | 1.43e-03 | 78 |
| GO:00459277 | Cervix | CC | positive regulation of growth | 53/2311 | 259/18723 | 1.33e-04 | 1.64e-03 | 53 |
| GO:00015588 | Cervix | CC | regulation of cell growth | 77/2311 | 414/18723 | 1.40e-04 | 1.70e-03 | 77 |
| Page: 1 2 3 4 5 6 7 8 9 10 11 12 13 14 15 16 17 18 19 20 21 22 23 24 25 26 27 28 29 30 31 32 33 34 35 |
| Pathway ID | Tissue | Disease Stage | Description | Gene Ratio | Bg Ratio | pvalue | p.adjust | qvalue | Count |
| hsa040109 | Cervix | CC | MAPK signaling pathway | 62/1267 | 302/8465 | 4.89e-03 | 1.67e-02 | 9.86e-03 | 62 |
| hsa0401012 | Cervix | CC | MAPK signaling pathway | 62/1267 | 302/8465 | 4.89e-03 | 1.67e-02 | 9.86e-03 | 62 |
| hsa04010 | Colorectum | FAP | MAPK signaling pathway | 68/1404 | 302/8465 | 4.00e-03 | 1.67e-02 | 1.02e-02 | 68 |
| hsa040101 | Colorectum | FAP | MAPK signaling pathway | 68/1404 | 302/8465 | 4.00e-03 | 1.67e-02 | 1.02e-02 | 68 |
| hsa040102 | Colorectum | CRC | MAPK signaling pathway | 56/1091 | 302/8465 | 2.76e-03 | 1.77e-02 | 1.20e-02 | 56 |
| hsa040103 | Colorectum | CRC | MAPK signaling pathway | 56/1091 | 302/8465 | 2.76e-03 | 1.77e-02 | 1.20e-02 | 56 |
| hsa040108 | Lung | IAC | MAPK signaling pathway | 62/1053 | 302/8465 | 3.54e-05 | 6.38e-04 | 4.24e-04 | 62 |
| hsa0401011 | Lung | IAC | MAPK signaling pathway | 62/1053 | 302/8465 | 3.54e-05 | 6.38e-04 | 4.24e-04 | 62 |
| hsa0401021 | Lung | AIS | MAPK signaling pathway | 57/961 | 302/8465 | 6.41e-05 | 9.43e-04 | 6.03e-04 | 57 |
| hsa0401031 | Lung | AIS | MAPK signaling pathway | 57/961 | 302/8465 | 6.41e-05 | 9.43e-04 | 6.03e-04 | 57 |
| hsa040106 | Lung | MIAC | MAPK signaling pathway | 32/507 | 302/8465 | 1.12e-03 | 1.36e-02 | 9.81e-03 | 32 |
| hsa040107 | Lung | MIAC | MAPK signaling pathway | 32/507 | 302/8465 | 1.12e-03 | 1.36e-02 | 9.81e-03 | 32 |
| hsa0401014 | Oral cavity | OSCC | MAPK signaling pathway | 165/3704 | 302/8465 | 7.11e-05 | 2.74e-04 | 1.40e-04 | 165 |
| hsa0401015 | Oral cavity | OSCC | MAPK signaling pathway | 165/3704 | 302/8465 | 7.11e-05 | 2.74e-04 | 1.40e-04 | 165 |
| hsa0401010 | Prostate | BPH | MAPK signaling pathway | 87/1718 | 302/8465 | 2.05e-04 | 1.13e-03 | 6.98e-04 | 87 |
| hsa0401013 | Prostate | BPH | MAPK signaling pathway | 87/1718 | 302/8465 | 2.05e-04 | 1.13e-03 | 6.98e-04 | 87 |
| hsa0401022 | Prostate | Tumor | MAPK signaling pathway | 87/1791 | 302/8465 | 8.46e-04 | 3.94e-03 | 2.45e-03 | 87 |
| hsa0401032 | Prostate | Tumor | MAPK signaling pathway | 87/1791 | 302/8465 | 8.46e-04 | 3.94e-03 | 2.45e-03 | 87 |
| Page: 1 |
Top |
Cell-cell communication analysis |
| Identification of potential cell-cell interactions between two cell types and their ligand-receptor pairs for different disease states |
| Ligand | Receptor | LRpair | Pathway | Tissue | Disease Stage |
| Page: 1 |
Top |
Single-cell gene regulatory network inference analysis |
| Find out the significant the regulons (TFs) and the target genes of each regulon across cell types for different disease states |
| TF | Cell Type | Tissue | Disease Stage | Target Gene | RSS | Regulon Activity |
| ∗The dot plots of a searched regulon are shown for all cell subpopulations in each disease state of each tissue based on the regulon specific score inferred using pySCENIC and by calculating the average expression. |
| Page: 1 |
Top |
Somatic mutation of malignant transformation related genes |
| Annotation of somatic variants for genes involved in malignant transformation |
| Hugo Symbol | Variant Class | Variant Classification | dbSNP RS | HGVSc | HGVSp | HGVSp Short | SWISSPROT | BIOTYPE | SIFT | PolyPhen | Tumor Sample Barcode | Tissue | Histology | Sex | Age | Stage | Therapy Types | Drugs | Outcome |
| MAP3K13 | SNV | Missense_Mutation | novel | c.889G>A | p.Asp297Asn | p.D297N | O43283 | protein_coding | deleterious(0.01) | probably_damaging(0.98) | TCGA-5L-AAT1-01 | Breast | breast invasive carcinoma | Female | <65 | III/IV | Hormone Therapy | letrozol | SD |
| MAP3K13 | SNV | Missense_Mutation | c.699N>T | p.Met233Ile | p.M233I | O43283 | protein_coding | deleterious(0) | probably_damaging(0.999) | TCGA-A2-A25A-01 | Breast | breast invasive carcinoma | Female | <65 | I/II | Unspecific | Cytoxan | SD | |
| MAP3K13 | SNV | Missense_Mutation | c.1354N>A | p.Glu452Lys | p.E452K | O43283 | protein_coding | deleterious(0.02) | possibly_damaging(0.709) | TCGA-A8-A093-01 | Breast | breast invasive carcinoma | Female | <65 | I/II | Hormone Therapy | tamoxiphen | SD | |
| MAP3K13 | SNV | Missense_Mutation | novel | c.604N>A | p.Glu202Lys | p.E202K | O43283 | protein_coding | deleterious(0.01) | possibly_damaging(0.555) | TCGA-AC-A23H-01 | Breast | breast invasive carcinoma | Female | >=65 | I/II | Unknown | Unknown | PD |
| MAP3K13 | SNV | Missense_Mutation | rs548832664 | c.209N>T | p.Thr70Met | p.T70M | O43283 | protein_coding | deleterious(0.01) | benign(0.039) | TCGA-AN-A04C-01 | Breast | breast invasive carcinoma | Female | <65 | I/II | Unknown | Unknown | SD |
| MAP3K13 | SNV | Missense_Mutation | rs544421900 | c.2675C>T | p.Thr892Met | p.T892M | O43283 | protein_coding | deleterious_low_confidence(0.01) | probably_damaging(0.92) | TCGA-BH-A0DX-01 | Breast | breast invasive carcinoma | Female | <65 | I/II | Chemotherapy | taxotere | CR |
| MAP3K13 | SNV | Missense_Mutation | c.2677N>T | p.Pro893Ser | p.P893S | O43283 | protein_coding | tolerated_low_confidence(0.64) | probably_damaging(0.996) | TCGA-BH-A0HA-01 | Breast | breast invasive carcinoma | Female | <65 | I/II | Unknown | Unknown | SD | |
| MAP3K13 | SNV | Missense_Mutation | c.2559C>G | p.Phe853Leu | p.F853L | O43283 | protein_coding | tolerated_low_confidence(0.74) | benign(0.003) | TCGA-EW-A1J5-01 | Breast | breast invasive carcinoma | Female | <65 | I/II | Chemotherapy | adriamycin | SD | |
| MAP3K13 | insertion | Nonsense_Mutation | novel | c.2798_2799insCATCAGCTTGGAGTGTAGTGTTTAGTCACATAAATATATAAACCAAAT | p.Glu933delinsAspIleSerLeuGluCysSerValTerSerHisLysTyrIleAsnGlnMet | p.E933delinsDISLECSV*SHKYINQM | O43283 | protein_coding | TCGA-A2-A0EO-01 | Breast | breast invasive carcinoma | Female | <65 | I/II | Hormone Therapy | tamoxiphen | SD | ||
| MAP3K13 | insertion | Nonsense_Mutation | novel | c.290_291insCTCTTAA | p.Gln99Ter | p.Q99* | O43283 | protein_coding | TCGA-A8-A094-01 | Breast | breast invasive carcinoma | Female | >=65 | I/II | Unknown | Unknown | SD |
| Page: 1 2 3 4 5 6 7 8 9 10 11 12 13 14 |
Top |
Related drugs of malignant transformation related genes |
| Identification of chemicals and drugs interact with genes involved in malignant transfromation |
| (DGIdb 4.0) |
| Entrez ID | Symbol | Category | Interaction Types | Drug Claim Name | Drug Name | PMIDs |
| 9175 | MAP3K13 | DRUGGABLE GENOME, CLINICALLY ACTIONABLE, KINASE, ENZYME, SERINE THREONINE KINASE | inhibitor | CHEMBL290352 | CEP-1347 | |
| 9175 | MAP3K13 | DRUGGABLE GENOME, CLINICALLY ACTIONABLE, KINASE, ENZYME, SERINE THREONINE KINASE | inhibitor | 328083457 |
| Page: 1 |

Copyright 2023-Present -The University of Texas Health Science Center at Houston |