
|
|||||
|
 | |
| |
| |
| |
| |
| |
|
Gene: MAP2K7 |
Gene summary for MAP2K7 |
| Gene information | Species | Human | Gene symbol | MAP2K7 | Gene ID | 5609 |
| Gene name | mitogen-activated protein kinase kinase 7 | |
| Gene Alias | JNKK2 | |
| Cytomap | 19p13.2 | |
| Gene Type | protein-coding | GO ID | GO:0000165 | UniProtAcc | B4DV95 |
Top |
Malignant transformation analysis |
| Identification of the aberrant gene expression in precancerous and cancerous lesions by comparing the gene expression of stem-like cells in diseased tissues with normal stem cells |
| Entrez ID | Symbol | Replicates | Species | Organ | Tissue | Adj P-value | Log2FC | Malignancy |
| 5609 | MAP2K7 | LZE4T | Human | Esophagus | ESCC | 3.12e-07 | 1.83e-01 | 0.0811 |
| 5609 | MAP2K7 | LZE7T | Human | Esophagus | ESCC | 3.43e-13 | 6.15e-01 | 0.0667 |
| 5609 | MAP2K7 | LZE24T | Human | Esophagus | ESCC | 3.34e-16 | 1.70e-01 | 0.0596 |
| 5609 | MAP2K7 | LZE21T | Human | Esophagus | ESCC | 3.02e-04 | 3.55e-01 | 0.0655 |
| 5609 | MAP2K7 | P1T-E | Human | Esophagus | ESCC | 3.85e-06 | 3.29e-01 | 0.0875 |
| 5609 | MAP2K7 | P2T-E | Human | Esophagus | ESCC | 2.08e-14 | 2.77e-01 | 0.1177 |
| 5609 | MAP2K7 | P4T-E | Human | Esophagus | ESCC | 2.62e-15 | 1.70e-01 | 0.1323 |
| 5609 | MAP2K7 | P5T-E | Human | Esophagus | ESCC | 6.16e-13 | 1.36e-01 | 0.1327 |
| 5609 | MAP2K7 | P8T-E | Human | Esophagus | ESCC | 1.46e-15 | 2.61e-01 | 0.0889 |
| 5609 | MAP2K7 | P9T-E | Human | Esophagus | ESCC | 3.09e-15 | 3.34e-01 | 0.1131 |
| 5609 | MAP2K7 | P10T-E | Human | Esophagus | ESCC | 1.89e-22 | 5.32e-01 | 0.116 |
| 5609 | MAP2K7 | P11T-E | Human | Esophagus | ESCC | 1.38e-15 | 5.18e-01 | 0.1426 |
| 5609 | MAP2K7 | P12T-E | Human | Esophagus | ESCC | 3.69e-17 | 3.50e-01 | 0.1122 |
| 5609 | MAP2K7 | P15T-E | Human | Esophagus | ESCC | 4.68e-10 | 3.10e-01 | 0.1149 |
| 5609 | MAP2K7 | P16T-E | Human | Esophagus | ESCC | 1.60e-15 | 2.72e-01 | 0.1153 |
| 5609 | MAP2K7 | P17T-E | Human | Esophagus | ESCC | 2.83e-11 | 3.08e-01 | 0.1278 |
| 5609 | MAP2K7 | P19T-E | Human | Esophagus | ESCC | 1.52e-04 | 2.41e-01 | 0.1662 |
| 5609 | MAP2K7 | P20T-E | Human | Esophagus | ESCC | 3.49e-14 | 3.34e-01 | 0.1124 |
| 5609 | MAP2K7 | P21T-E | Human | Esophagus | ESCC | 6.47e-12 | 2.39e-01 | 0.1617 |
| 5609 | MAP2K7 | P22T-E | Human | Esophagus | ESCC | 1.21e-07 | 1.27e-01 | 0.1236 |
| Page: 1 2 3 4 5 6 |
| Tissue | Expression Dynamics | Abbreviation |
| Esophagus | 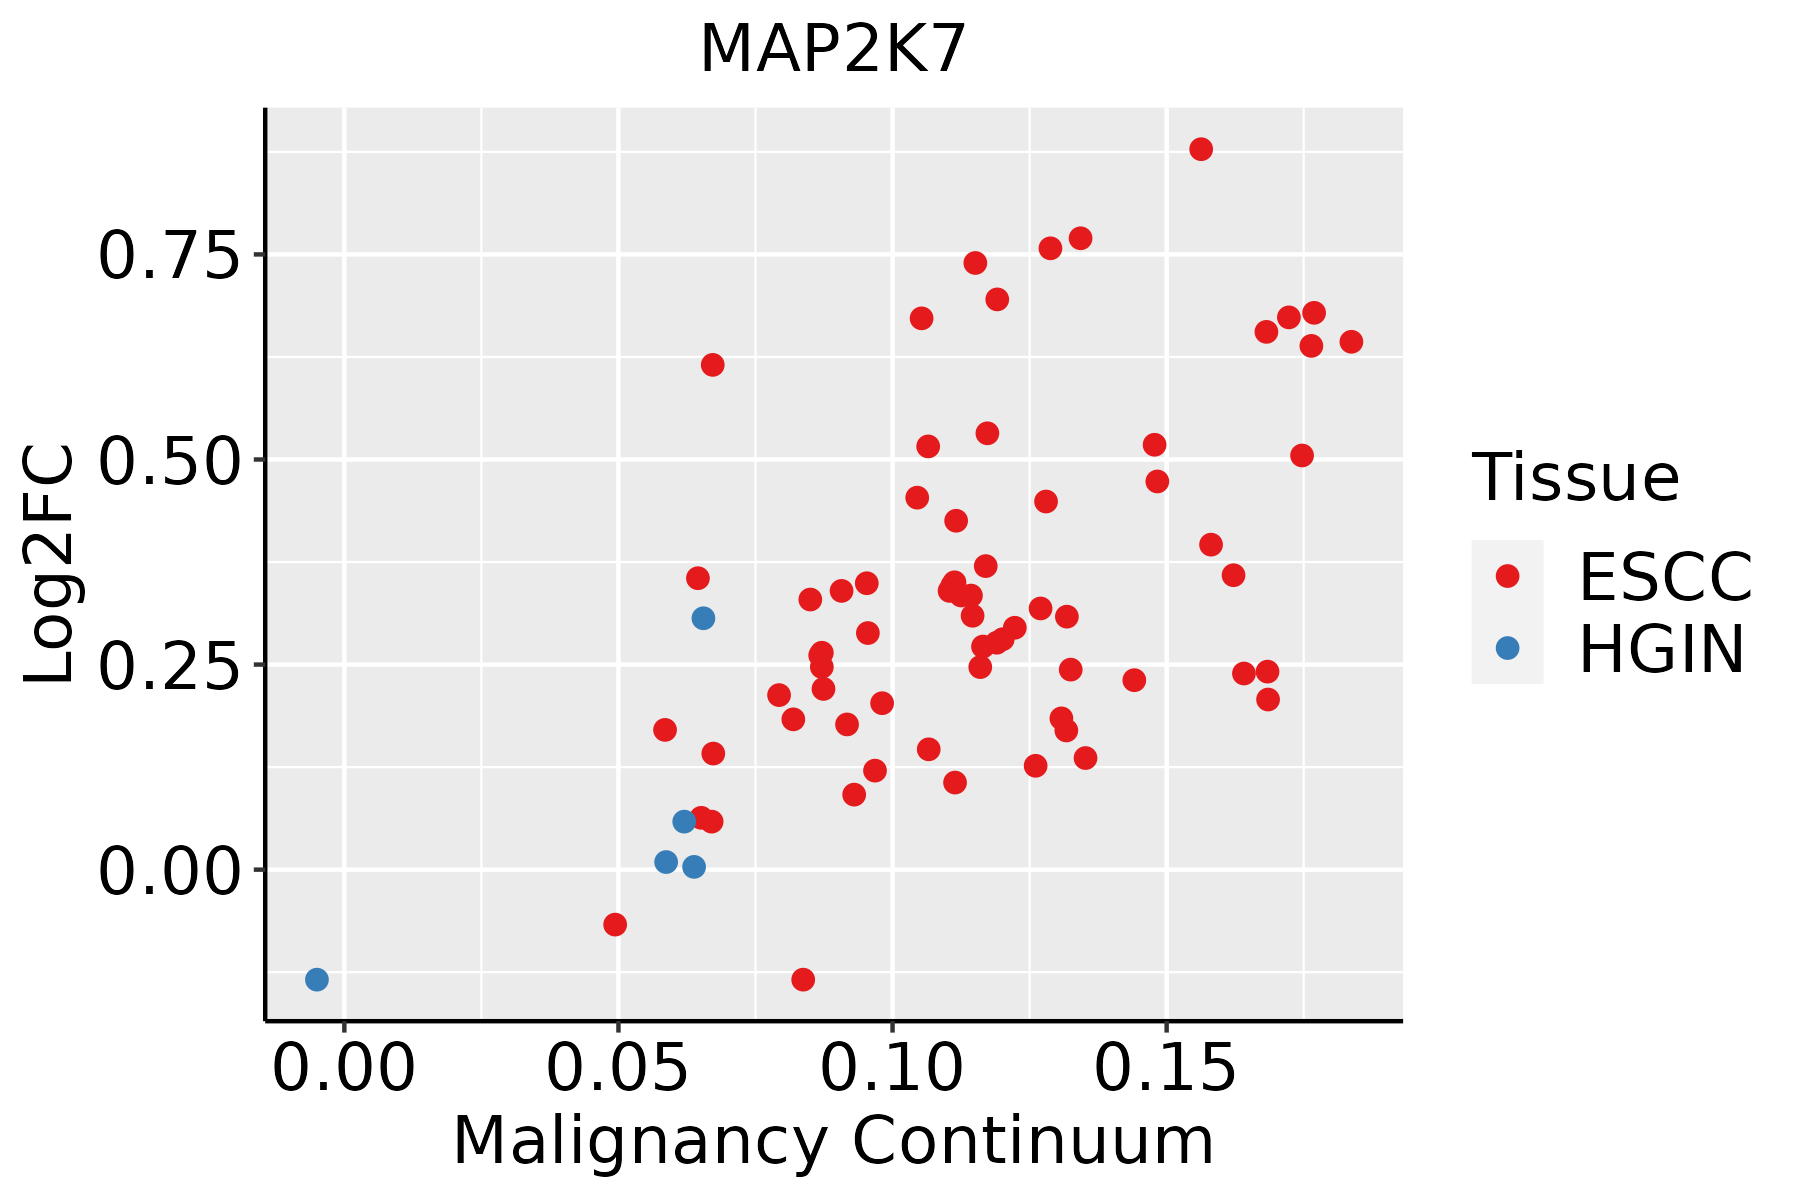 | ESCC: Esophageal squamous cell carcinoma |
| HGIN: High-grade intraepithelial neoplasias | ||
| LGIN: Low-grade intraepithelial neoplasias | ||
| Liver | 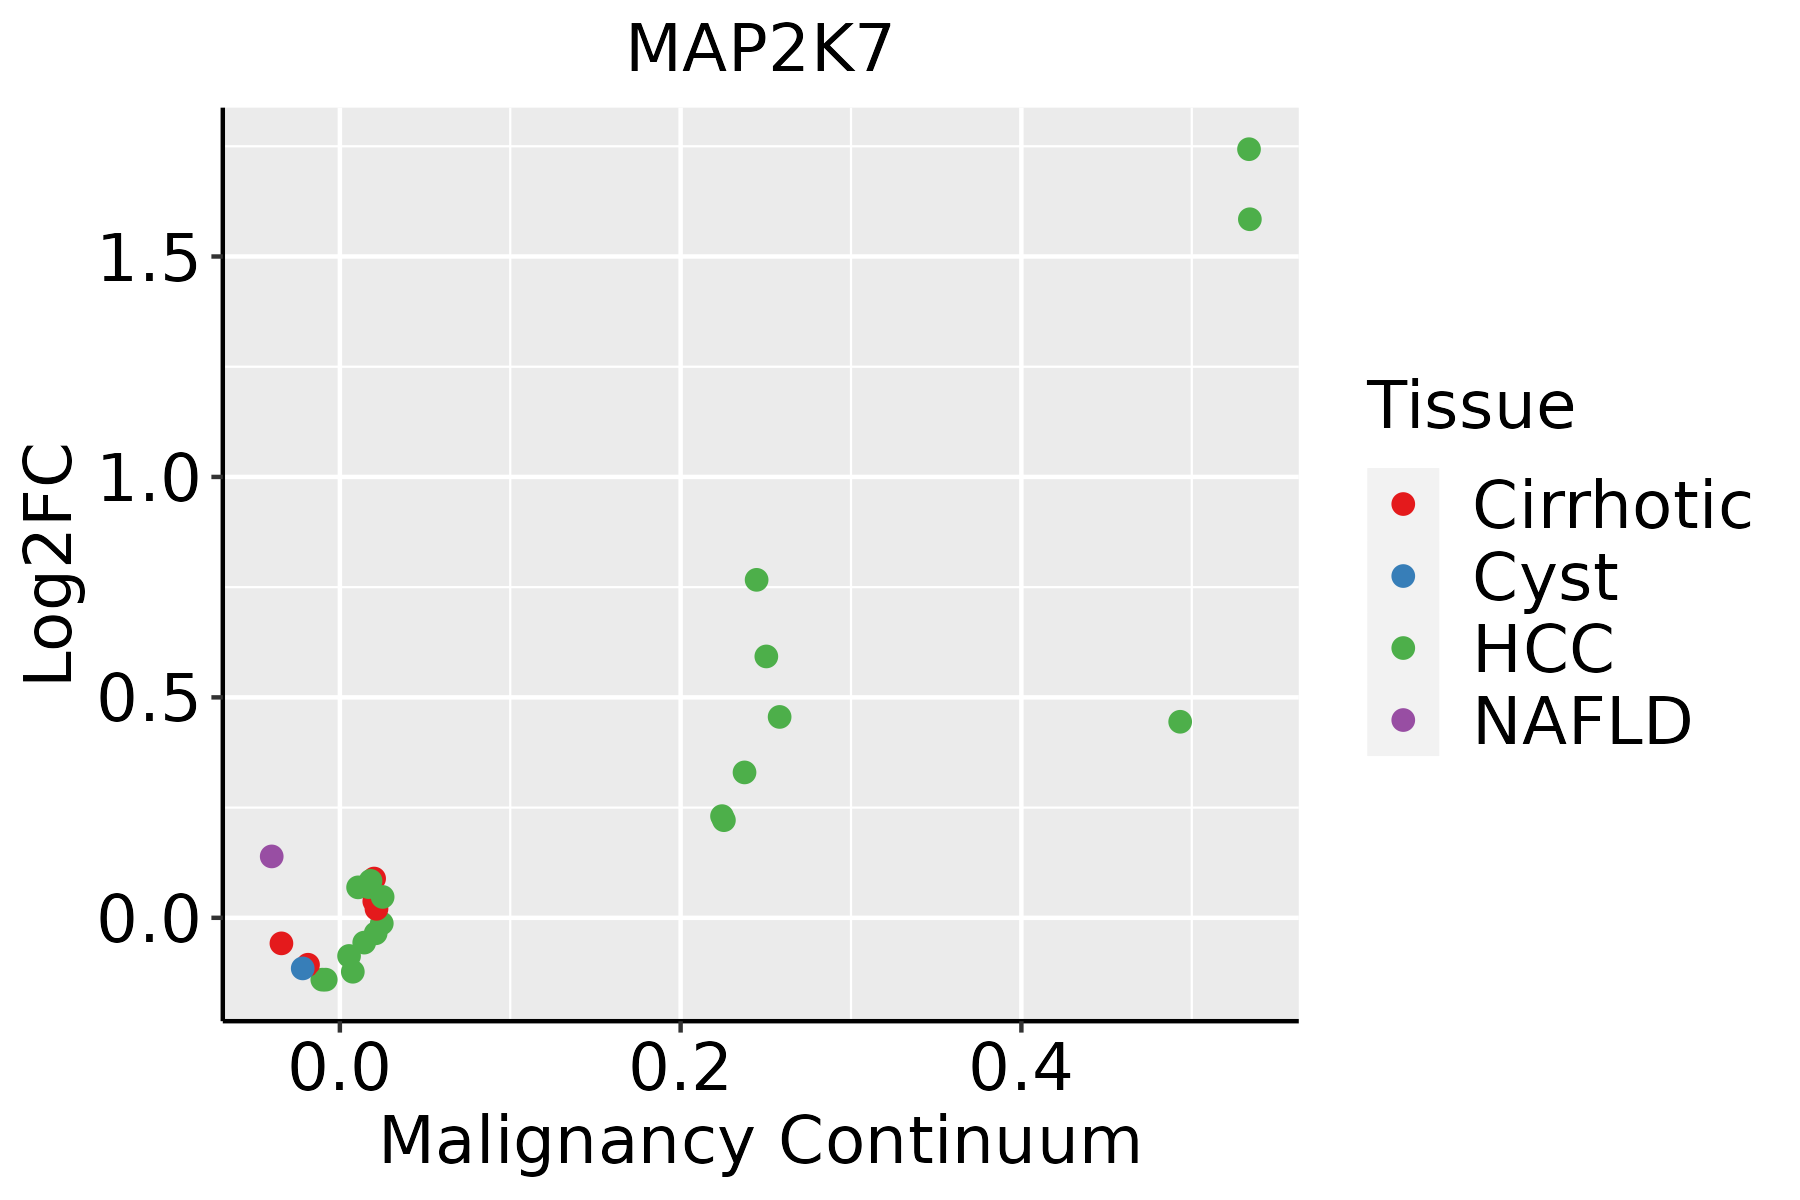 | HCC: Hepatocellular carcinoma |
| NAFLD: Non-alcoholic fatty liver disease | ||
| Oral Cavity | 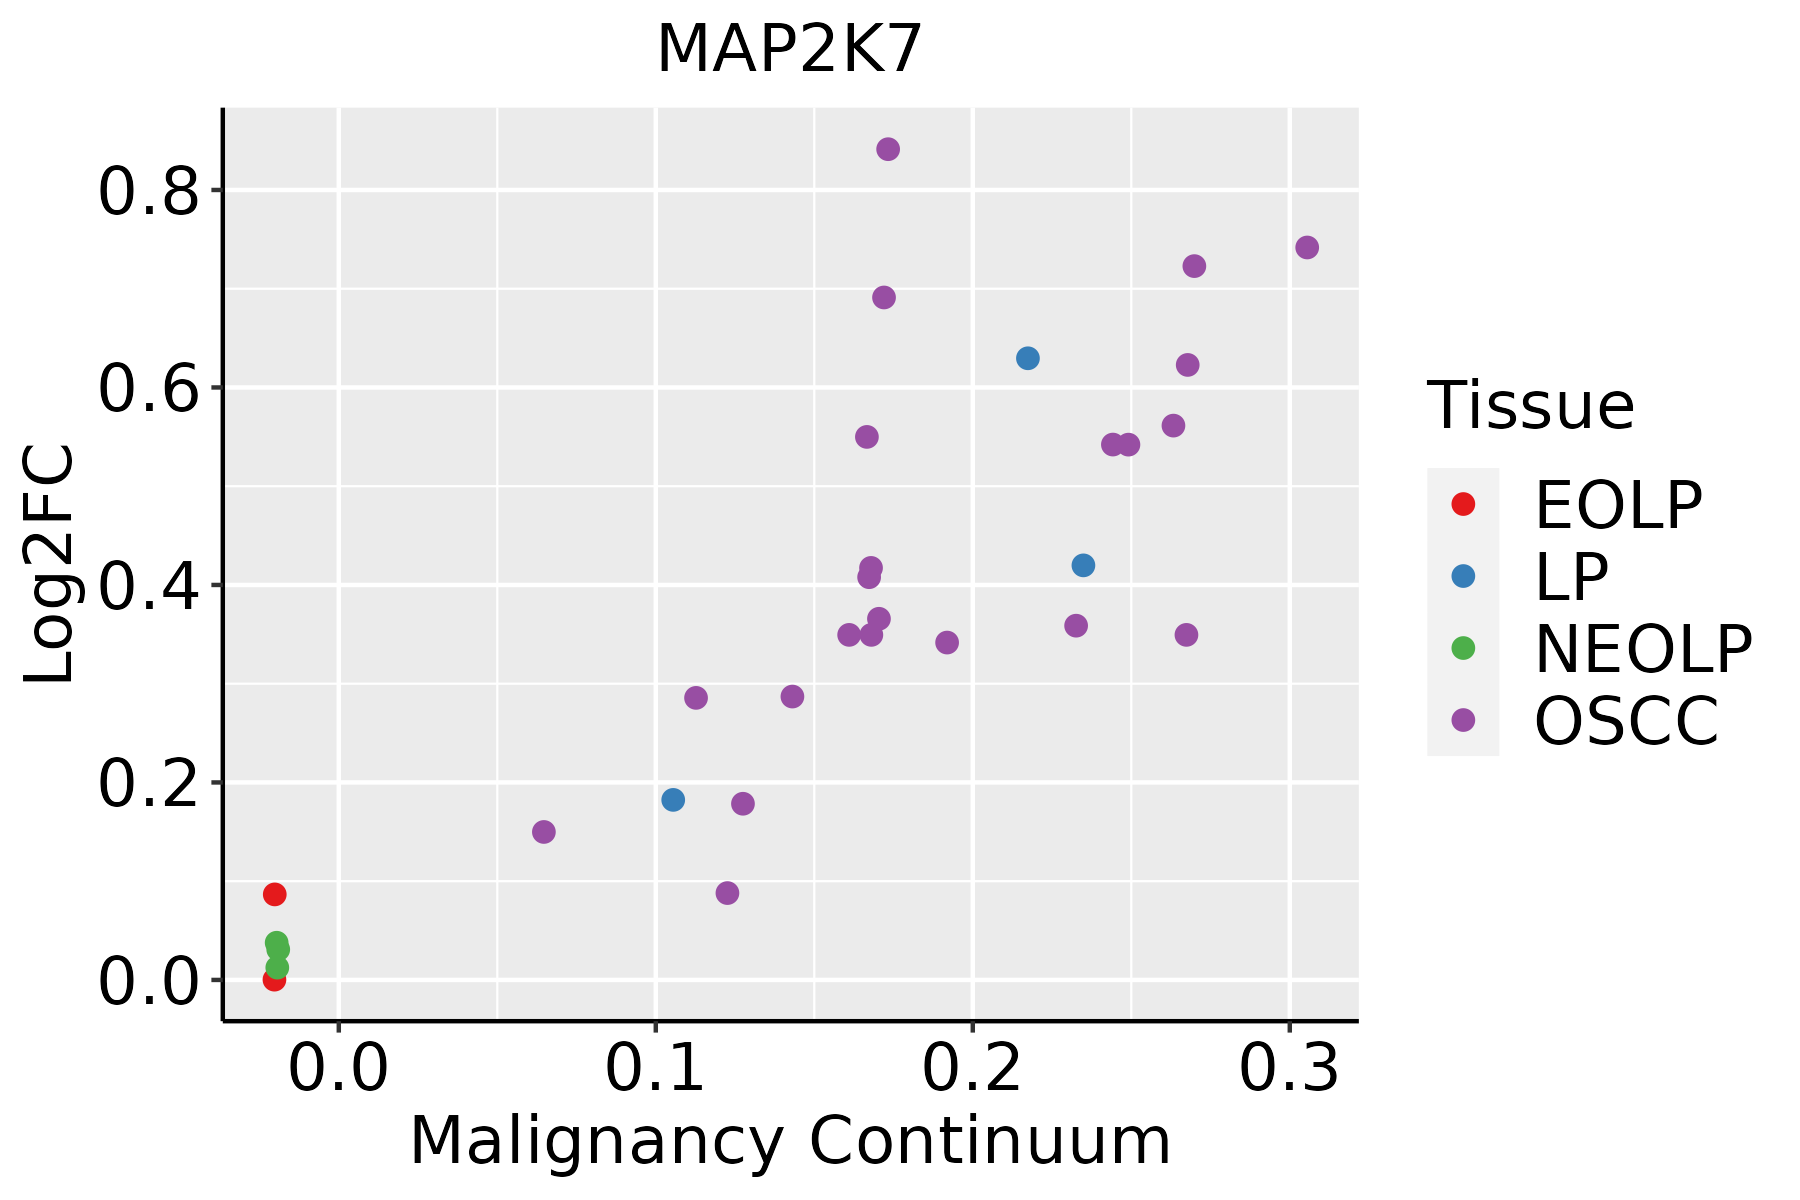 | EOLP: Erosive Oral lichen planus |
| LP: leukoplakia | ||
| NEOLP: Non-erosive oral lichen planus | ||
| OSCC: Oral squamous cell carcinoma | ||
| Skin |  | AK: Actinic keratosis |
| cSCC: Cutaneous squamous cell carcinoma | ||
| SCCIS:squamous cell carcinoma in situ | ||
| Thyroid | 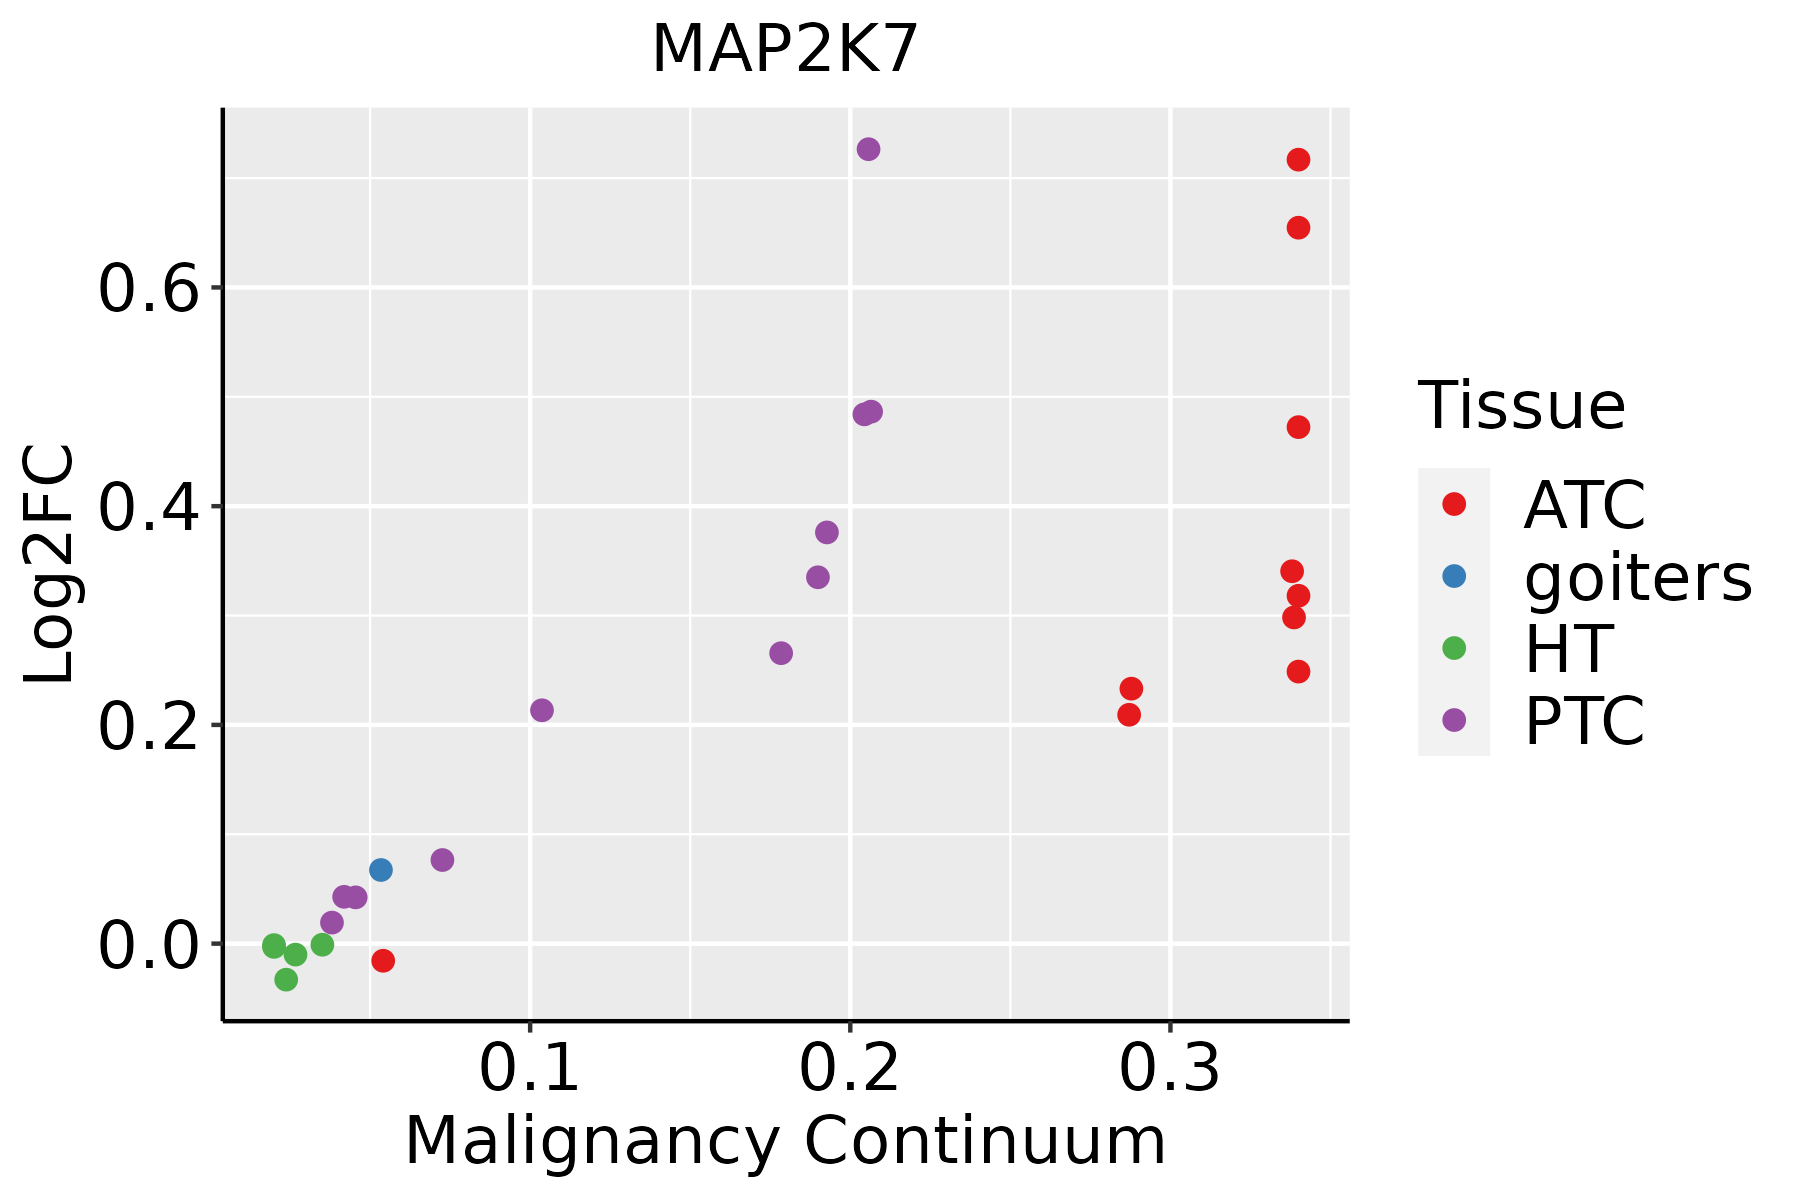 | ATC: Anaplastic thyroid cancer |
| HT: Hashimoto's thyroiditis | ||
| PTC: Papillary thyroid cancer |
| ∗log2FC in expression of this searched gene in stem-like cells from each diseased tissue sample relative to stem-like cells in normal samples in each tissue plotted against the malignancy continuum. Samples are colored based on if they are from different disease stage. |
Top |
Malignant transformation related pathway analysis |
| Find out the enriched GO biological processes and KEGG pathways involved in transition from healthy to precancer to cancer |
| Tissue | Disease Stage | Enriched GO biological Processes |
| Colorectum | AD |  |
| Colorectum | SER |  |
| Colorectum | MSS |  |
| Colorectum | MSI-H |  |
| Colorectum | FAP |  |
| ∗Top 15 enriched GO BP terms are showed in the bar plot of each disease state in each tissue. Each row represents a significant GO biological process which is colored according to the -log10(p.adjust). |
| Page: 1 2 3 4 5 6 7 8 9 |
| GO ID | Tissue | Disease Stage | Description | Gene Ratio | Bg Ratio | pvalue | p.adjust | Count |
| GO:003304416 | Esophagus | ESCC | regulation of chromosome organization | 145/8552 | 187/18723 | 3.80e-19 | 4.31e-17 | 145 |
| GO:000941113 | Esophagus | ESCC | response to UV | 115/8552 | 149/18723 | 3.29e-15 | 1.93e-13 | 115 |
| GO:005105215 | Esophagus | ESCC | regulation of DNA metabolic process | 232/8552 | 359/18723 | 2.40e-13 | 1.13e-11 | 232 |
| GO:000072319 | Esophagus | ESCC | telomere maintenance | 99/8552 | 131/18723 | 2.68e-12 | 1.08e-10 | 99 |
| GO:007189716 | Esophagus | ESCC | DNA biosynthetic process | 127/8552 | 180/18723 | 1.04e-11 | 3.85e-10 | 127 |
| GO:007190016 | Esophagus | ESCC | regulation of protein serine/threonine kinase activity | 227/8552 | 359/18723 | 1.12e-11 | 4.10e-10 | 227 |
| GO:005105417 | Esophagus | ESCC | positive regulation of DNA metabolic process | 139/8552 | 201/18723 | 1.20e-11 | 4.33e-10 | 139 |
| GO:000931419 | Esophagus | ESCC | response to radiation | 277/8552 | 456/18723 | 4.42e-11 | 1.43e-09 | 277 |
| GO:200057319 | Esophagus | ESCC | positive regulation of DNA biosynthetic process | 56/8552 | 66/18723 | 4.51e-11 | 1.45e-09 | 56 |
| GO:003220417 | Esophagus | ESCC | regulation of telomere maintenance | 65/8552 | 80/18723 | 6.02e-11 | 1.90e-09 | 65 |
| GO:2000278110 | Esophagus | ESCC | regulation of DNA biosynthetic process | 81/8552 | 106/18723 | 9.81e-11 | 2.96e-09 | 81 |
| GO:000700418 | Esophagus | ESCC | telomere maintenance via telomerase | 56/8552 | 69/18723 | 1.40e-09 | 3.30e-08 | 56 |
| GO:200125219 | Esophagus | ESCC | positive regulation of chromosome organization | 64/8552 | 82/18723 | 1.98e-09 | 4.52e-08 | 64 |
| GO:001083319 | Esophagus | ESCC | telomere maintenance via telomere lengthening | 61/8552 | 81/18723 | 5.24e-08 | 9.37e-07 | 61 |
| GO:003109818 | Esophagus | ESCC | stress-activated protein kinase signaling cascade | 154/8552 | 247/18723 | 8.53e-08 | 1.44e-06 | 154 |
| GO:00322108 | Esophagus | ESCC | regulation of telomere maintenance via telomerase | 43/8552 | 53/18723 | 1.20e-07 | 1.95e-06 | 43 |
| GO:005197217 | Esophagus | ESCC | regulation of telomerase activity | 39/8552 | 47/18723 | 1.48e-07 | 2.35e-06 | 39 |
| GO:0009408110 | Esophagus | ESCC | response to heat | 77/8552 | 110/18723 | 2.01e-07 | 3.11e-06 | 77 |
| GO:003220618 | Esophagus | ESCC | positive regulation of telomere maintenance | 42/8552 | 52/18723 | 2.15e-07 | 3.30e-06 | 42 |
| GO:000756820 | Esophagus | ESCC | aging | 201/8552 | 339/18723 | 2.64e-07 | 3.94e-06 | 201 |
| Page: 1 2 3 4 5 6 7 8 9 10 11 12 13 |
| Pathway ID | Tissue | Disease Stage | Description | Gene Ratio | Bg Ratio | pvalue | p.adjust | qvalue | Count |
| hsa04141211 | Esophagus | ESCC | Protein processing in endoplasmic reticulum | 147/4205 | 174/8465 | 3.29e-22 | 1.10e-19 | 5.64e-20 | 147 |
| hsa05132211 | Esophagus | ESCC | Salmonella infection | 191/4205 | 249/8465 | 6.51e-19 | 5.45e-17 | 2.79e-17 | 191 |
| hsa05016210 | Esophagus | ESCC | Huntington disease | 226/4205 | 306/8465 | 1.38e-18 | 8.72e-17 | 4.46e-17 | 226 |
| hsa05208211 | Esophagus | ESCC | Chemical carcinogenesis - reactive oxygen species | 168/4205 | 223/8465 | 1.83e-15 | 6.81e-14 | 3.49e-14 | 168 |
| hsa05022210 | Esophagus | ESCC | Pathways of neurodegeneration - multiple diseases | 318/4205 | 476/8465 | 6.10e-15 | 2.04e-13 | 1.05e-13 | 318 |
| hsa05010210 | Esophagus | ESCC | Alzheimer disease | 263/4205 | 384/8465 | 1.80e-14 | 5.47e-13 | 2.80e-13 | 263 |
| hsa05169210 | Esophagus | ESCC | Epstein-Barr virus infection | 151/4205 | 202/8465 | 1.55e-13 | 3.45e-12 | 1.77e-12 | 151 |
| hsa05418211 | Esophagus | ESCC | Fluid shear stress and atherosclerosis | 109/4205 | 139/8465 | 2.00e-12 | 3.72e-11 | 1.90e-11 | 109 |
| hsa0466810 | Esophagus | ESCC | TNF signaling pathway | 89/4205 | 114/8465 | 3.36e-10 | 4.01e-09 | 2.06e-09 | 89 |
| hsa05170210 | Esophagus | ESCC | Human immunodeficiency virus 1 infection | 147/4205 | 212/8465 | 3.37e-09 | 3.53e-08 | 1.81e-08 | 147 |
| hsa05167211 | Esophagus | ESCC | Kaposi sarcoma-associated herpesvirus infection | 136/4205 | 194/8465 | 4.28e-09 | 4.22e-08 | 2.16e-08 | 136 |
| hsa0513526 | Esophagus | ESCC | Yersinia infection | 100/4205 | 137/8465 | 1.80e-08 | 1.59e-07 | 8.12e-08 | 100 |
| hsa05417211 | Esophagus | ESCC | Lipid and atherosclerosis | 143/4205 | 215/8465 | 3.30e-07 | 2.45e-06 | 1.26e-06 | 143 |
| hsa051619 | Esophagus | ESCC | Hepatitis B | 108/4205 | 162/8465 | 7.68e-06 | 4.15e-05 | 2.12e-05 | 108 |
| hsa0472225 | Esophagus | ESCC | Neurotrophin signaling pathway | 80/4205 | 119/8465 | 7.33e-05 | 3.07e-04 | 1.57e-04 | 80 |
| hsa04530211 | Esophagus | ESCC | Tight junction | 105/4205 | 169/8465 | 6.73e-04 | 2.23e-03 | 1.14e-03 | 105 |
| hsa049268 | Esophagus | ESCC | Relaxin signaling pathway | 81/4205 | 129/8465 | 1.72e-03 | 5.09e-03 | 2.61e-03 | 81 |
| hsa0401218 | Esophagus | ESCC | ErbB signaling pathway | 56/4205 | 85/8465 | 1.78e-03 | 5.24e-03 | 2.68e-03 | 56 |
| hsa046607 | Esophagus | ESCC | T cell receptor signaling pathway | 63/4205 | 104/8465 | 1.60e-02 | 3.60e-02 | 1.84e-02 | 63 |
| hsa04141310 | Esophagus | ESCC | Protein processing in endoplasmic reticulum | 147/4205 | 174/8465 | 3.29e-22 | 1.10e-19 | 5.64e-20 | 147 |
| Page: 1 2 3 4 5 6 7 |
Top |
Cell-cell communication analysis |
| Identification of potential cell-cell interactions between two cell types and their ligand-receptor pairs for different disease states |
| Ligand | Receptor | LRpair | Pathway | Tissue | Disease Stage |
| Page: 1 |
Top |
Single-cell gene regulatory network inference analysis |
| Find out the significant the regulons (TFs) and the target genes of each regulon across cell types for different disease states |
| TF | Cell Type | Tissue | Disease Stage | Target Gene | RSS | Regulon Activity |
| ∗The dot plots of a searched regulon are shown for all cell subpopulations in each disease state of each tissue based on the regulon specific score inferred using pySCENIC and by calculating the average expression. |
| Page: 1 |
Top |
Somatic mutation of malignant transformation related genes |
| Annotation of somatic variants for genes involved in malignant transformation |
| Hugo Symbol | Variant Class | Variant Classification | dbSNP RS | HGVSc | HGVSp | HGVSp Short | SWISSPROT | BIOTYPE | SIFT | PolyPhen | Tumor Sample Barcode | Tissue | Histology | Sex | Age | Stage | Therapy Types | Drugs | Outcome |
| MAP2K7 | SNV | Missense_Mutation | rs759229847 | c.1193G>A | p.Arg398His | p.R398H | O14733 | protein_coding | tolerated(0.13) | benign(0.006) | TCGA-AO-A128-01 | Breast | breast invasive carcinoma | Female | <65 | I/II | Chemotherapy | doxorubicin | SD |
| MAP2K7 | insertion | Frame_Shift_Ins | novel | c.322_323insTT | p.Asp109LeufsTer9 | p.D109Lfs*9 | O14733 | protein_coding | TCGA-BH-A0DQ-01 | Breast | breast invasive carcinoma | Female | <65 | I/II | Chemotherapy | doxorubicin | SD | ||
| MAP2K7 | SNV | Missense_Mutation | novel | c.523G>A | p.Glu175Lys | p.E175K | O14733 | protein_coding | deleterious(0) | probably_damaging(0.988) | TCGA-JW-A5VL-01 | Cervix | cervical & endocervical cancer | Female | <65 | I/II | Unknown | Unknown | SD |
| MAP2K7 | SNV | Missense_Mutation | c.883N>A | p.Gly295Ser | p.G295S | O14733 | protein_coding | deleterious(0.01) | probably_damaging(1) | TCGA-A6-2685-01 | Colorectum | colon adenocarcinoma | Female | <65 | I/II | Unknown | Unknown | PD | |
| MAP2K7 | SNV | Missense_Mutation | rs775112625 | c.1273N>A | p.Val425Ile | p.V425I | O14733 | protein_coding | tolerated_low_confidence(0.35) | benign(0) | TCGA-A6-5665-01 | Colorectum | colon adenocarcinoma | Female | >=65 | I/II | Unknown | Unknown | PD |
| MAP2K7 | SNV | Missense_Mutation | c.775G>A | p.Asp259Asn | p.D259N | O14733 | protein_coding | deleterious(0) | probably_damaging(1) | TCGA-AA-3527-01 | Colorectum | colon adenocarcinoma | Female | >=65 | I/II | Unknown | Unknown | SD | |
| MAP2K7 | SNV | Missense_Mutation | c.775N>A | p.Asp259Asn | p.D259N | O14733 | protein_coding | deleterious(0) | probably_damaging(1) | TCGA-AD-6890-01 | Colorectum | colon adenocarcinoma | Male | >=65 | I/II | Unknown | Unknown | SD | |
| MAP2K7 | SNV | Missense_Mutation | rs55800262 | c.631N>A | p.Ala211Thr | p.A211T | O14733 | protein_coding | deleterious(0) | benign(0.145) | TCGA-AD-A5EJ-01 | Colorectum | colon adenocarcinoma | Female | >=65 | I/II | Unknown | Unknown | SD |
| MAP2K7 | SNV | Missense_Mutation | c.791N>G | p.Asn264Ser | p.N264S | O14733 | protein_coding | deleterious(0) | probably_damaging(0.999) | TCGA-CK-4950-01 | Colorectum | colon adenocarcinoma | Female | >=65 | III/IV | Chemotherapy | folfox | SD | |
| MAP2K7 | SNV | Missense_Mutation | c.1028N>T | p.Thr343Met | p.T343M | O14733 | protein_coding | deleterious(0) | possibly_damaging(0.768) | TCGA-CM-6162-01 | Colorectum | colon adenocarcinoma | Female | <65 | III/IV | Chemotherapy | oxaliplatin | SD |
| Page: 1 2 3 4 5 6 7 8 |
Top |
Related drugs of malignant transformation related genes |
| Identification of chemicals and drugs interact with genes involved in malignant transfromation |
| (DGIdb 4.0) |
| Entrez ID | Symbol | Category | Interaction Types | Drug Claim Name | Drug Name | PMIDs |
| 5609 | MAP2K7 | DRUGGABLE GENOME, SERINE THREONINE KINASE, KINASE, TYROSINE KINASE, ENZYME | inhibitor | GDC-0973 | COBIMETINIB | |
| 5609 | MAP2K7 | DRUGGABLE GENOME, SERINE THREONINE KINASE, KINASE, TYROSINE KINASE, ENZYME | Benzoimidazole derivative 2 | |||
| 5609 | MAP2K7 | DRUGGABLE GENOME, SERINE THREONINE KINASE, KINASE, TYROSINE KINASE, ENZYME | Benzoheterocyclic compound 1 | |||
| 5609 | MAP2K7 | DRUGGABLE GENOME, SERINE THREONINE KINASE, KINASE, TYROSINE KINASE, ENZYME | PMID28594589-Compound-TABLE3C12 | |||
| 5609 | MAP2K7 | DRUGGABLE GENOME, SERINE THREONINE KINASE, KINASE, TYROSINE KINASE, ENZYME | allosteric modulator | 223365961 | COBIMETINIB | |
| 5609 | MAP2K7 | DRUGGABLE GENOME, SERINE THREONINE KINASE, KINASE, TYROSINE KINASE, ENZYME | ARRY-162 | BINIMETINIB | ||
| 5609 | MAP2K7 | DRUGGABLE GENOME, SERINE THREONINE KINASE, KINASE, TYROSINE KINASE, ENZYME | Pyridinone compound 1 | |||
| 5609 | MAP2K7 | DRUGGABLE GENOME, SERINE THREONINE KINASE, KINASE, TYROSINE KINASE, ENZYME | PMID28594589-Compound-TABLE3C14 | |||
| 5609 | MAP2K7 | DRUGGABLE GENOME, SERINE THREONINE KINASE, KINASE, TYROSINE KINASE, ENZYME | inhibitor | COBIMETINIB | COBIMETINIB | |
| 5609 | MAP2K7 | DRUGGABLE GENOME, SERINE THREONINE KINASE, KINASE, TYROSINE KINASE, ENZYME | GDC-0623 | RG-7420 |
| Page: 1 2 3 |

Copyright 2023-Present -The University of Texas Health Science Center at Houston |