
|
|||||
|
 | |
| |
| |
| |
| |
| |
|
Gene: MAP2K6 |
Gene summary for MAP2K6 |
| Gene information | Species | Human | Gene symbol | MAP2K6 | Gene ID | 5608 |
| Gene name | mitogen-activated protein kinase kinase 6 | |
| Gene Alias | MAPKK6 | |
| Cytomap | 17q24.3 | |
| Gene Type | protein-coding | GO ID | GO:0000003 | UniProtAcc | A0A024R8K3 |
Top |
Malignant transformation analysis |
| Identification of the aberrant gene expression in precancerous and cancerous lesions by comparing the gene expression of stem-like cells in diseased tissues with normal stem cells |
| Entrez ID | Symbol | Replicates | Species | Organ | Tissue | Adj P-value | Log2FC | Malignancy |
| 5608 | MAP2K6 | HTA11_3410_2000001011 | Human | Colorectum | AD | 6.17e-04 | -3.89e-01 | 0.0155 |
| 5608 | MAP2K6 | HTA11_347_2000001011 | Human | Colorectum | AD | 2.39e-18 | 8.28e-01 | -0.1954 |
| 5608 | MAP2K6 | HTA11_7862_2000001011 | Human | Colorectum | AD | 1.43e-02 | -7.22e-02 | -0.0179 |
| 5608 | MAP2K6 | HTA11_7696_3000711011 | Human | Colorectum | AD | 7.73e-07 | -3.73e-01 | 0.0674 |
| 5608 | MAP2K6 | HTA11_99999974143_84620 | Human | Colorectum | MSS | 2.66e-15 | -5.03e-01 | 0.3005 |
| 5608 | MAP2K6 | A015-C-203 | Human | Colorectum | FAP | 1.26e-21 | -4.64e-01 | -0.1294 |
| 5608 | MAP2K6 | A015-C-204 | Human | Colorectum | FAP | 2.14e-09 | -4.69e-01 | -0.0228 |
| 5608 | MAP2K6 | A014-C-040 | Human | Colorectum | FAP | 7.05e-03 | -3.75e-01 | -0.1184 |
| 5608 | MAP2K6 | A002-C-201 | Human | Colorectum | FAP | 2.10e-10 | -3.43e-01 | 0.0324 |
| 5608 | MAP2K6 | A002-C-203 | Human | Colorectum | FAP | 2.38e-02 | -1.95e-01 | 0.2786 |
| 5608 | MAP2K6 | A001-C-119 | Human | Colorectum | FAP | 3.92e-06 | -4.68e-01 | -0.1557 |
| 5608 | MAP2K6 | A001-C-108 | Human | Colorectum | FAP | 4.07e-12 | -3.98e-01 | -0.0272 |
| 5608 | MAP2K6 | A002-C-205 | Human | Colorectum | FAP | 6.26e-17 | -4.23e-01 | -0.1236 |
| 5608 | MAP2K6 | A001-C-104 | Human | Colorectum | FAP | 9.48e-08 | -3.86e-01 | 0.0184 |
| 5608 | MAP2K6 | A015-C-006 | Human | Colorectum | FAP | 1.16e-15 | -5.99e-01 | -0.0994 |
| 5608 | MAP2K6 | A015-C-106 | Human | Colorectum | FAP | 3.13e-11 | -3.11e-01 | -0.0511 |
| 5608 | MAP2K6 | A002-C-114 | Human | Colorectum | FAP | 1.31e-13 | -4.43e-01 | -0.1561 |
| 5608 | MAP2K6 | A015-C-104 | Human | Colorectum | FAP | 5.82e-24 | -5.07e-01 | -0.1899 |
| 5608 | MAP2K6 | A001-C-014 | Human | Colorectum | FAP | 9.73e-13 | -4.15e-01 | 0.0135 |
| 5608 | MAP2K6 | A002-C-016 | Human | Colorectum | FAP | 1.08e-14 | -3.55e-01 | 0.0521 |
| Page: 1 2 3 |
| Tissue | Expression Dynamics | Abbreviation |
| Colorectum (GSE201348) |  | FAP: Familial adenomatous polyposis |
| CRC: Colorectal cancer | ||
| Colorectum (HTA11) |  | AD: Adenomas |
| SER: Sessile serrated lesions | ||
| MSI-H: Microsatellite-high colorectal cancer | ||
| MSS: Microsatellite stable colorectal cancer | ||
| Endometrium | 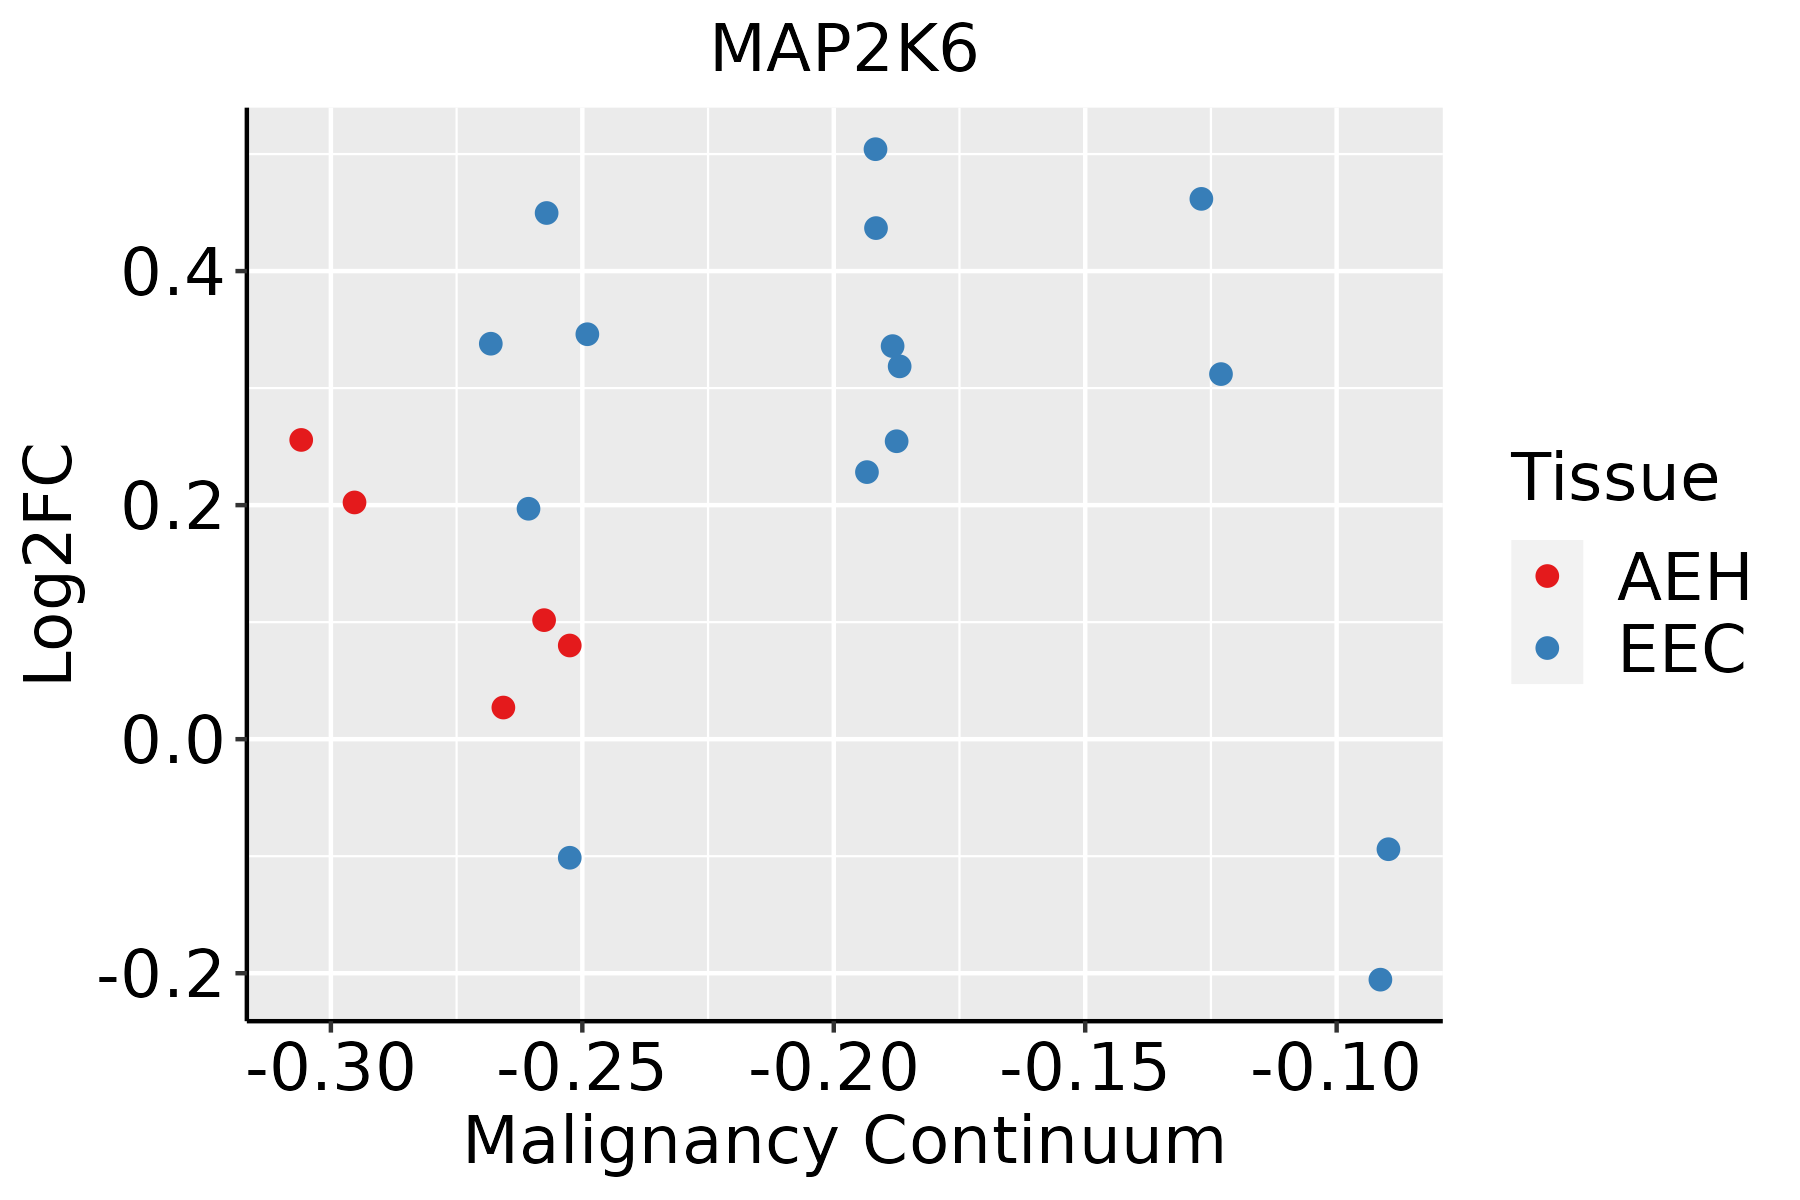 | AEH: Atypical endometrial hyperplasia |
| EEC: Endometrioid Cancer | ||
| Liver |  | HCC: Hepatocellular carcinoma |
| NAFLD: Non-alcoholic fatty liver disease |
| ∗log2FC in expression of this searched gene in stem-like cells from each diseased tissue sample relative to stem-like cells in normal samples in each tissue plotted against the malignancy continuum. Samples are colored based on if they are from different disease stage. |
Top |
Malignant transformation related pathway analysis |
| Find out the enriched GO biological processes and KEGG pathways involved in transition from healthy to precancer to cancer |
| Tissue | Disease Stage | Enriched GO biological Processes |
| Colorectum | AD |  |
| Colorectum | SER |  |
| Colorectum | MSS |  |
| Colorectum | MSI-H |  |
| Colorectum | FAP |  |
| ∗Top 15 enriched GO BP terms are showed in the bar plot of each disease state in each tissue. Each row represents a significant GO biological process which is colored according to the -log10(p.adjust). |
| Page: 1 2 3 4 5 6 7 8 9 |
| GO ID | Tissue | Disease Stage | Description | Gene Ratio | Bg Ratio | pvalue | p.adjust | Count |
| GO:0009743 | Colorectum | AD | response to carbohydrate | 86/3918 | 253/18723 | 8.43e-07 | 2.90e-05 | 86 |
| GO:0030522 | Colorectum | AD | intracellular receptor signaling pathway | 87/3918 | 265/18723 | 3.69e-06 | 1.03e-04 | 87 |
| GO:0048511 | Colorectum | AD | rhythmic process | 94/3918 | 298/18723 | 1.00e-05 | 2.34e-04 | 94 |
| GO:0072331 | Colorectum | AD | signal transduction by p53 class mediator | 58/3918 | 163/18723 | 1.04e-05 | 2.40e-04 | 58 |
| GO:0071322 | Colorectum | AD | cellular response to carbohydrate stimulus | 56/3918 | 163/18723 | 4.61e-05 | 7.97e-04 | 56 |
| GO:1901796 | Colorectum | AD | regulation of signal transduction by p53 class mediator | 36/3918 | 93/18723 | 6.58e-05 | 1.07e-03 | 36 |
| GO:0033674 | Colorectum | AD | positive regulation of kinase activity | 131/3918 | 467/18723 | 1.28e-04 | 1.85e-03 | 131 |
| GO:0009410 | Colorectum | AD | response to xenobiotic stimulus | 128/3918 | 462/18723 | 2.69e-04 | 3.31e-03 | 128 |
| GO:0007568 | Colorectum | AD | aging | 98/3918 | 339/18723 | 2.77e-04 | 3.39e-03 | 98 |
| GO:0001649 | Colorectum | AD | osteoblast differentiation | 70/3918 | 229/18723 | 3.59e-04 | 4.18e-03 | 70 |
| GO:0051047 | Colorectum | AD | positive regulation of secretion | 90/3918 | 310/18723 | 4.11e-04 | 4.66e-03 | 90 |
| GO:0051403 | Colorectum | AD | stress-activated MAPK cascade | 72/3918 | 239/18723 | 4.77e-04 | 5.25e-03 | 72 |
| GO:0031098 | Colorectum | AD | stress-activated protein kinase signaling cascade | 74/3918 | 247/18723 | 4.80e-04 | 5.27e-03 | 74 |
| GO:1903532 | Colorectum | AD | positive regulation of secretion by cell | 82/3918 | 282/18723 | 6.85e-04 | 7.00e-03 | 82 |
| GO:0045860 | Colorectum | AD | positive regulation of protein kinase activity | 107/3918 | 386/18723 | 8.01e-04 | 7.92e-03 | 107 |
| GO:0015732 | Colorectum | AD | prostaglandin transport | 10/3918 | 18/18723 | 1.31e-03 | 1.15e-02 | 10 |
| GO:0010876 | Colorectum | AD | lipid localization | 120/3918 | 448/18723 | 1.59e-03 | 1.33e-02 | 120 |
| GO:0006869 | Colorectum | AD | lipid transport | 108/3918 | 398/18723 | 1.67e-03 | 1.39e-02 | 108 |
| GO:0071900 | Colorectum | AD | regulation of protein serine/threonine kinase activity | 98/3918 | 359/18723 | 2.18e-03 | 1.73e-02 | 98 |
| GO:2000191 | Colorectum | AD | regulation of fatty acid transport | 14/3918 | 32/18723 | 3.03e-03 | 2.25e-02 | 14 |
| Page: 1 2 3 4 5 6 7 8 |
| Pathway ID | Tissue | Disease Stage | Description | Gene Ratio | Bg Ratio | pvalue | p.adjust | qvalue | Count |
| hsa05014 | Colorectum | AD | Amyotrophic lateral sclerosis | 164/2092 | 364/8465 | 4.28e-18 | 1.27e-16 | 8.09e-17 | 164 |
| hsa05022 | Colorectum | AD | Pathways of neurodegeneration - multiple diseases | 201/2092 | 476/8465 | 4.54e-18 | 1.27e-16 | 8.09e-17 | 201 |
| hsa05132 | Colorectum | AD | Salmonella infection | 102/2092 | 249/8465 | 7.65e-09 | 1.28e-07 | 8.17e-08 | 102 |
| hsa05135 | Colorectum | AD | Yersinia infection | 58/2092 | 137/8465 | 3.90e-06 | 4.35e-05 | 2.78e-05 | 58 |
| hsa05418 | Colorectum | AD | Fluid shear stress and atherosclerosis | 54/2092 | 139/8465 | 1.41e-04 | 1.16e-03 | 7.37e-04 | 54 |
| hsa05417 | Colorectum | AD | Lipid and atherosclerosis | 73/2092 | 215/8465 | 1.31e-03 | 8.27e-03 | 5.27e-03 | 73 |
| hsa05170 | Colorectum | AD | Human immunodeficiency virus 1 infection | 72/2092 | 212/8465 | 1.40e-03 | 8.46e-03 | 5.39e-03 | 72 |
| hsa04015 | Colorectum | AD | Rap1 signaling pathway | 71/2092 | 210/8465 | 1.72e-03 | 9.68e-03 | 6.18e-03 | 71 |
| hsa05163 | Colorectum | AD | Human cytomegalovirus infection | 75/2092 | 225/8465 | 2.00e-03 | 1.10e-02 | 7.01e-03 | 75 |
| hsa04912 | Colorectum | AD | GnRH signaling pathway | 35/2092 | 93/8465 | 3.69e-03 | 1.90e-02 | 1.21e-02 | 35 |
| hsa04218 | Colorectum | AD | Cellular senescence | 53/2092 | 156/8465 | 5.55e-03 | 2.48e-02 | 1.58e-02 | 53 |
| hsa050141 | Colorectum | AD | Amyotrophic lateral sclerosis | 164/2092 | 364/8465 | 4.28e-18 | 1.27e-16 | 8.09e-17 | 164 |
| hsa050221 | Colorectum | AD | Pathways of neurodegeneration - multiple diseases | 201/2092 | 476/8465 | 4.54e-18 | 1.27e-16 | 8.09e-17 | 201 |
| hsa051321 | Colorectum | AD | Salmonella infection | 102/2092 | 249/8465 | 7.65e-09 | 1.28e-07 | 8.17e-08 | 102 |
| hsa051351 | Colorectum | AD | Yersinia infection | 58/2092 | 137/8465 | 3.90e-06 | 4.35e-05 | 2.78e-05 | 58 |
| hsa054181 | Colorectum | AD | Fluid shear stress and atherosclerosis | 54/2092 | 139/8465 | 1.41e-04 | 1.16e-03 | 7.37e-04 | 54 |
| hsa054171 | Colorectum | AD | Lipid and atherosclerosis | 73/2092 | 215/8465 | 1.31e-03 | 8.27e-03 | 5.27e-03 | 73 |
| hsa051701 | Colorectum | AD | Human immunodeficiency virus 1 infection | 72/2092 | 212/8465 | 1.40e-03 | 8.46e-03 | 5.39e-03 | 72 |
| hsa040151 | Colorectum | AD | Rap1 signaling pathway | 71/2092 | 210/8465 | 1.72e-03 | 9.68e-03 | 6.18e-03 | 71 |
| hsa051631 | Colorectum | AD | Human cytomegalovirus infection | 75/2092 | 225/8465 | 2.00e-03 | 1.10e-02 | 7.01e-03 | 75 |
| Page: 1 2 3 4 5 6 7 8 |
Top |
Cell-cell communication analysis |
| Identification of potential cell-cell interactions between two cell types and their ligand-receptor pairs for different disease states |
| Ligand | Receptor | LRpair | Pathway | Tissue | Disease Stage |
| Page: 1 |
Top |
Single-cell gene regulatory network inference analysis |
| Find out the significant the regulons (TFs) and the target genes of each regulon across cell types for different disease states |
| TF | Cell Type | Tissue | Disease Stage | Target Gene | RSS | Regulon Activity |
| ∗The dot plots of a searched regulon are shown for all cell subpopulations in each disease state of each tissue based on the regulon specific score inferred using pySCENIC and by calculating the average expression. |
| Page: 1 |
Top |
Somatic mutation of malignant transformation related genes |
| Annotation of somatic variants for genes involved in malignant transformation |
| Hugo Symbol | Variant Class | Variant Classification | dbSNP RS | HGVSc | HGVSp | HGVSp Short | SWISSPROT | BIOTYPE | SIFT | PolyPhen | Tumor Sample Barcode | Tissue | Histology | Sex | Age | Stage | Therapy Types | Drugs | Outcome |
| MAP2K6 | SNV | Missense_Mutation | c.994N>A | p.Leu332Ile | p.L332I | P52564 | protein_coding | deleterious(0.03) | probably_damaging(0.997) | TCGA-A7-A26H-01 | Breast | breast invasive carcinoma | Female | >=65 | I/II | Hormone Therapy | anastrozole | PD | |
| MAP2K6 | SNV | Missense_Mutation | c.637N>T | p.Asp213Tyr | p.D213Y | P52564 | protein_coding | deleterious(0.02) | probably_damaging(1) | TCGA-A8-A06X-01 | Breast | breast invasive carcinoma | Female | >=65 | I/II | Unknown | Unknown | SD | |
| MAP2K6 | SNV | Missense_Mutation | c.95N>T | p.Asp32Val | p.D32V | P52564 | protein_coding | deleterious(0.01) | possibly_damaging(0.766) | TCGA-BH-A0HX-01 | Breast | breast invasive carcinoma | Female | <65 | I/II | Chemotherapy | adrimycin | SD | |
| MAP2K6 | deletion | Frame_Shift_Del | novel | c.591delN | p.Phe198LeufsTer28 | p.F198Lfs*28 | P52564 | protein_coding | TCGA-D8-A27V-01 | Breast | breast invasive carcinoma | Female | <65 | I/II | Hormone Therapy | tamoxiphen | SD | ||
| MAP2K6 | SNV | Missense_Mutation | c.21N>T | p.Lys7Asn | p.K7N | P52564 | protein_coding | deleterious(0.03) | benign(0.033) | TCGA-2W-A8YY-01 | Cervix | cervical & endocervical cancer | Female | <65 | I/II | Chemotherapy | cisplatin | CR | |
| MAP2K6 | SNV | Missense_Mutation | novel | c.352G>A | p.Ala118Thr | p.A118T | P52564 | protein_coding | deleterious(0.01) | probably_damaging(0.969) | TCGA-AA-3947-01 | Colorectum | colon adenocarcinoma | Female | <65 | I/II | Unknown | Unknown | SD |
| MAP2K6 | SNV | Missense_Mutation | c.279G>T | p.Gln93His | p.Q93H | P52564 | protein_coding | deleterious(0) | probably_damaging(0.976) | TCGA-AA-A010-01 | Colorectum | colon adenocarcinoma | Female | <65 | I/II | Chemotherapy | folinic | CR | |
| MAP2K6 | SNV | Missense_Mutation | c.26G>A | p.Arg9Gln | p.R9Q | P52564 | protein_coding | deleterious(0.01) | benign(0.035) | TCGA-CA-6718-01 | Colorectum | colon adenocarcinoma | Male | <65 | I/II | Unknown | Unknown | PD | |
| MAP2K6 | SNV | Missense_Mutation | c.550N>G | p.Asn184Asp | p.N184D | P52564 | protein_coding | deleterious(0) | probably_damaging(0.999) | TCGA-CM-5868-01 | Colorectum | colon adenocarcinoma | Female | <65 | I/II | Chemotherapy | fluorouracil | SD | |
| MAP2K6 | SNV | Missense_Mutation | novel | c.469N>G | p.Lys157Glu | p.K157E | P52564 | protein_coding | tolerated(0.05) | benign(0.03) | TCGA-AG-3892-01 | Colorectum | rectum adenocarcinoma | Female | <65 | I/II | Unknown | Unknown | SD |
| Page: 1 2 3 4 5 |
Top |
Related drugs of malignant transformation related genes |
| Identification of chemicals and drugs interact with genes involved in malignant transfromation |
| (DGIdb 4.0) |
| Entrez ID | Symbol | Category | Interaction Types | Drug Claim Name | Drug Name | PMIDs |
| 5608 | MAP2K6 | KINASE, TRANSCRIPTION FACTOR, DRUGGABLE GENOME, ENZYME, SERINE THREONINE KINASE, TYROSINE KINASE, TUMOR SUPPRESSOR | inhibitor | TRAMETINIB | TRAMETINIB | |
| 5608 | MAP2K6 | KINASE, TRANSCRIPTION FACTOR, DRUGGABLE GENOME, ENZYME, SERINE THREONINE KINASE, TYROSINE KINASE, TUMOR SUPPRESSOR | inhibitor | BAY869766 | ||
| 5608 | MAP2K6 | KINASE, TRANSCRIPTION FACTOR, DRUGGABLE GENOME, ENZYME, SERINE THREONINE KINASE, TYROSINE KINASE, TUMOR SUPPRESSOR | inhibitor | SELUMETINIB | SELUMETINIB | |
| 5608 | MAP2K6 | KINASE, TRANSCRIPTION FACTOR, DRUGGABLE GENOME, ENZYME, SERINE THREONINE KINASE, TYROSINE KINASE, TUMOR SUPPRESSOR | inhibitor | GDC-0973 | COBIMETINIB | |
| 5608 | MAP2K6 | KINASE, TRANSCRIPTION FACTOR, DRUGGABLE GENOME, ENZYME, SERINE THREONINE KINASE, TYROSINE KINASE, TUMOR SUPPRESSOR | inhibitor | DABRAFENIB MESYLATE | ||
| 5608 | MAP2K6 | KINASE, TRANSCRIPTION FACTOR, DRUGGABLE GENOME, ENZYME, SERINE THREONINE KINASE, TYROSINE KINASE, TUMOR SUPPRESSOR | inhibitor | 135652717 | STAUROSPORINE | |
| 5608 | MAP2K6 | KINASE, TRANSCRIPTION FACTOR, DRUGGABLE GENOME, ENZYME, SERINE THREONINE KINASE, TYROSINE KINASE, TUMOR SUPPRESSOR | inhibitor | MEK162 | BINIMETINIB | |
| 5608 | MAP2K6 | KINASE, TRANSCRIPTION FACTOR, DRUGGABLE GENOME, ENZYME, SERINE THREONINE KINASE, TYROSINE KINASE, TUMOR SUPPRESSOR | inhibitor | AZD6244 | SELUMETINIB | |
| 5608 | MAP2K6 | KINASE, TRANSCRIPTION FACTOR, DRUGGABLE GENOME, ENZYME, SERINE THREONINE KINASE, TYROSINE KINASE, TUMOR SUPPRESSOR | inhibitor | PD 0325901 | ||
| 5608 | MAP2K6 | KINASE, TRANSCRIPTION FACTOR, DRUGGABLE GENOME, ENZYME, SERINE THREONINE KINASE, TYROSINE KINASE, TUMOR SUPPRESSOR | VX-745 | NEFLAMAPIMOD |
| Page: 1 2 |

Copyright 2023-Present -The University of Texas Health Science Center at Houston |