
|
|||||
|
 | |
| |
| |
| |
| |
| |
|
Gene: MAP2K3 |
Gene summary for MAP2K3 |
| Gene information | Species | Human | Gene symbol | MAP2K3 | Gene ID | 5606 |
| Gene name | mitogen-activated protein kinase kinase 3 | |
| Gene Alias | MAPKK3 | |
| Cytomap | 17p11.2 | |
| Gene Type | protein-coding | GO ID | GO:0000165 | UniProtAcc | P46734 |
Top |
Malignant transformation analysis |
| Identification of the aberrant gene expression in precancerous and cancerous lesions by comparing the gene expression of stem-like cells in diseased tissues with normal stem cells |
| Entrez ID | Symbol | Replicates | Species | Organ | Tissue | Adj P-value | Log2FC | Malignancy |
| 5606 | MAP2K3 | HTA11_2487_2000001011 | Human | Colorectum | SER | 2.70e-09 | 7.55e-01 | -0.1808 |
| 5606 | MAP2K3 | HTA11_1938_2000001011 | Human | Colorectum | AD | 3.80e-02 | 3.62e-01 | -0.0811 |
| 5606 | MAP2K3 | HTA11_347_2000001011 | Human | Colorectum | AD | 5.06e-04 | 2.61e-01 | -0.1954 |
| 5606 | MAP2K3 | HTA11_696_2000001011 | Human | Colorectum | AD | 3.00e-05 | 2.98e-01 | -0.1464 |
| 5606 | MAP2K3 | HTA11_866_2000001011 | Human | Colorectum | AD | 4.27e-02 | 1.91e-01 | -0.1001 |
| 5606 | MAP2K3 | HTA11_1391_2000001011 | Human | Colorectum | AD | 1.80e-04 | 4.60e-01 | -0.059 |
| 5606 | MAP2K3 | HTA11_7696_3000711011 | Human | Colorectum | AD | 2.98e-09 | 3.66e-01 | 0.0674 |
| 5606 | MAP2K3 | HTA11_99999970781_79442 | Human | Colorectum | MSS | 9.71e-09 | 3.55e-01 | 0.294 |
| 5606 | MAP2K3 | HTA11_99999971662_82457 | Human | Colorectum | MSS | 5.51e-05 | 2.70e-01 | 0.3859 |
| 5606 | MAP2K3 | HTA11_99999974143_84620 | Human | Colorectum | MSS | 1.18e-06 | 3.30e-01 | 0.3005 |
| 5606 | MAP2K3 | LZE4T | Human | Esophagus | ESCC | 5.09e-19 | -1.83e-01 | 0.0811 |
| 5606 | MAP2K3 | LZE7T | Human | Esophagus | ESCC | 9.66e-05 | -2.55e-01 | 0.0667 |
| 5606 | MAP2K3 | LZE8T | Human | Esophagus | ESCC | 2.36e-08 | -2.06e-01 | 0.067 |
| 5606 | MAP2K3 | LZE20T | Human | Esophagus | ESCC | 4.55e-10 | -3.22e-01 | 0.0662 |
| 5606 | MAP2K3 | LZE24T | Human | Esophagus | ESCC | 1.25e-05 | 4.59e-01 | 0.0596 |
| 5606 | MAP2K3 | LZE21T | Human | Esophagus | ESCC | 1.59e-02 | 8.47e-02 | 0.0655 |
| 5606 | MAP2K3 | LZE6T | Human | Esophagus | ESCC | 1.73e-05 | -4.00e-01 | 0.0845 |
| 5606 | MAP2K3 | P2T-E | Human | Esophagus | ESCC | 1.42e-14 | 4.44e-01 | 0.1177 |
| 5606 | MAP2K3 | P4T-E | Human | Esophagus | ESCC | 7.82e-16 | 4.54e-01 | 0.1323 |
| 5606 | MAP2K3 | P5T-E | Human | Esophagus | ESCC | 3.08e-06 | -1.40e-01 | 0.1327 |
| Page: 1 2 3 4 5 6 |
| Tissue | Expression Dynamics | Abbreviation |
| Colorectum (GSE201348) |  | FAP: Familial adenomatous polyposis |
| CRC: Colorectal cancer | ||
| Colorectum (HTA11) |  | AD: Adenomas |
| SER: Sessile serrated lesions | ||
| MSI-H: Microsatellite-high colorectal cancer | ||
| MSS: Microsatellite stable colorectal cancer | ||
| Esophagus | 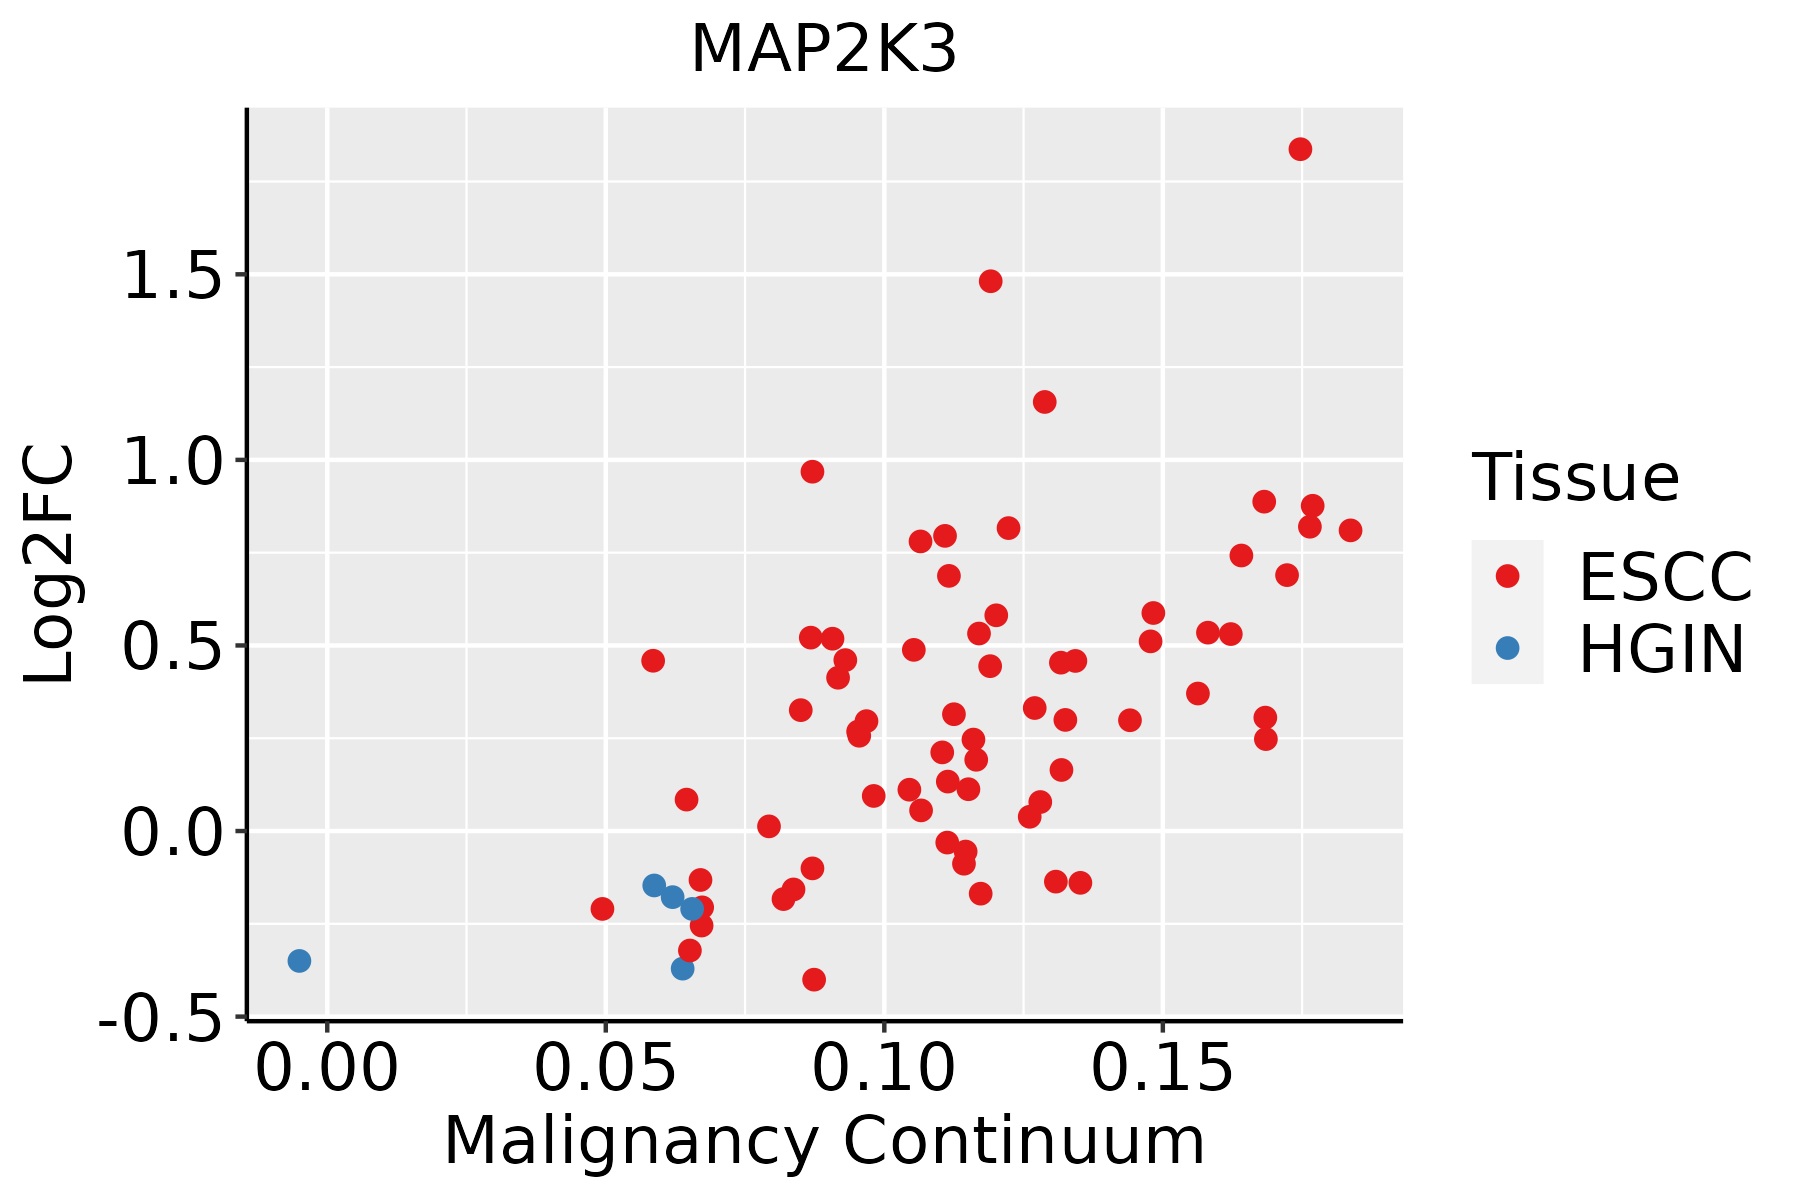 | ESCC: Esophageal squamous cell carcinoma |
| HGIN: High-grade intraepithelial neoplasias | ||
| LGIN: Low-grade intraepithelial neoplasias | ||
| Liver | 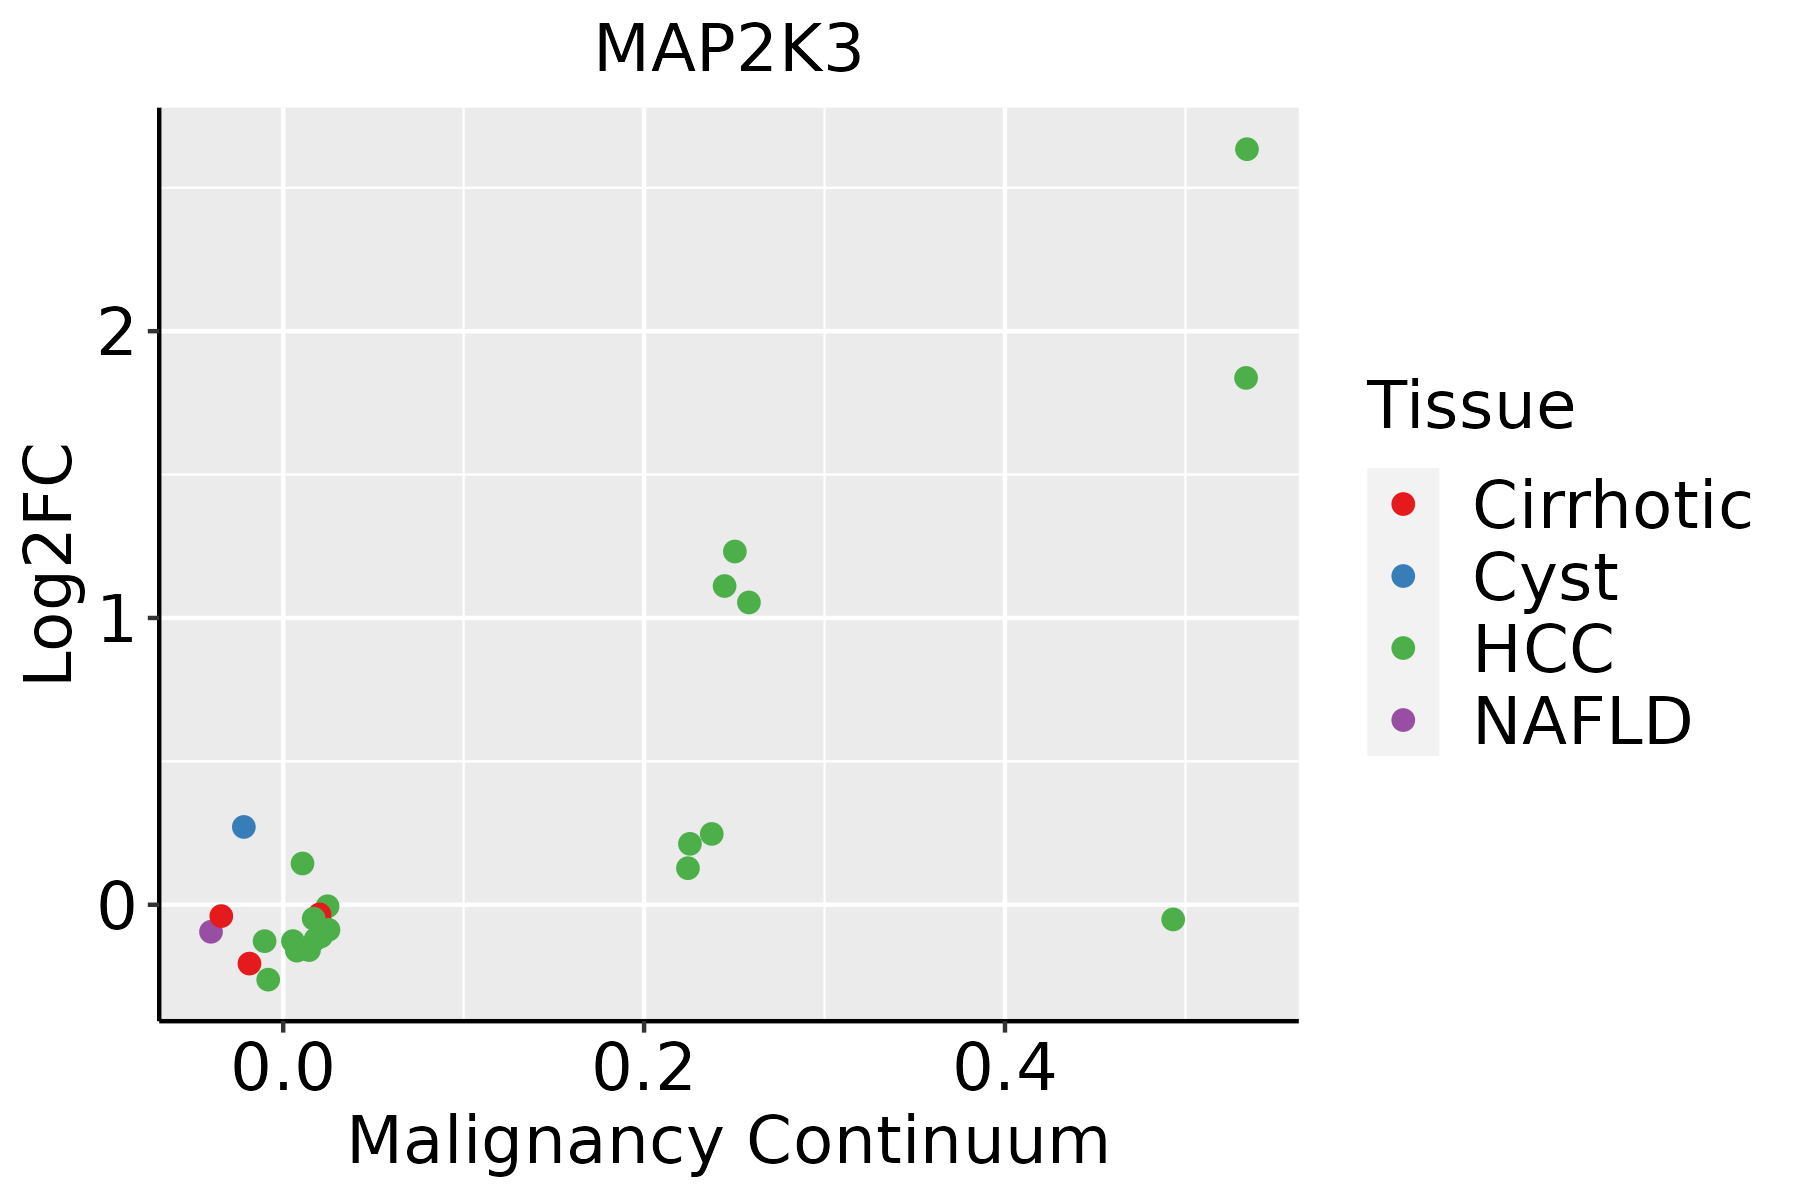 | HCC: Hepatocellular carcinoma |
| NAFLD: Non-alcoholic fatty liver disease | ||
| Oral Cavity |  | EOLP: Erosive Oral lichen planus |
| LP: leukoplakia | ||
| NEOLP: Non-erosive oral lichen planus | ||
| OSCC: Oral squamous cell carcinoma | ||
| Prostate | 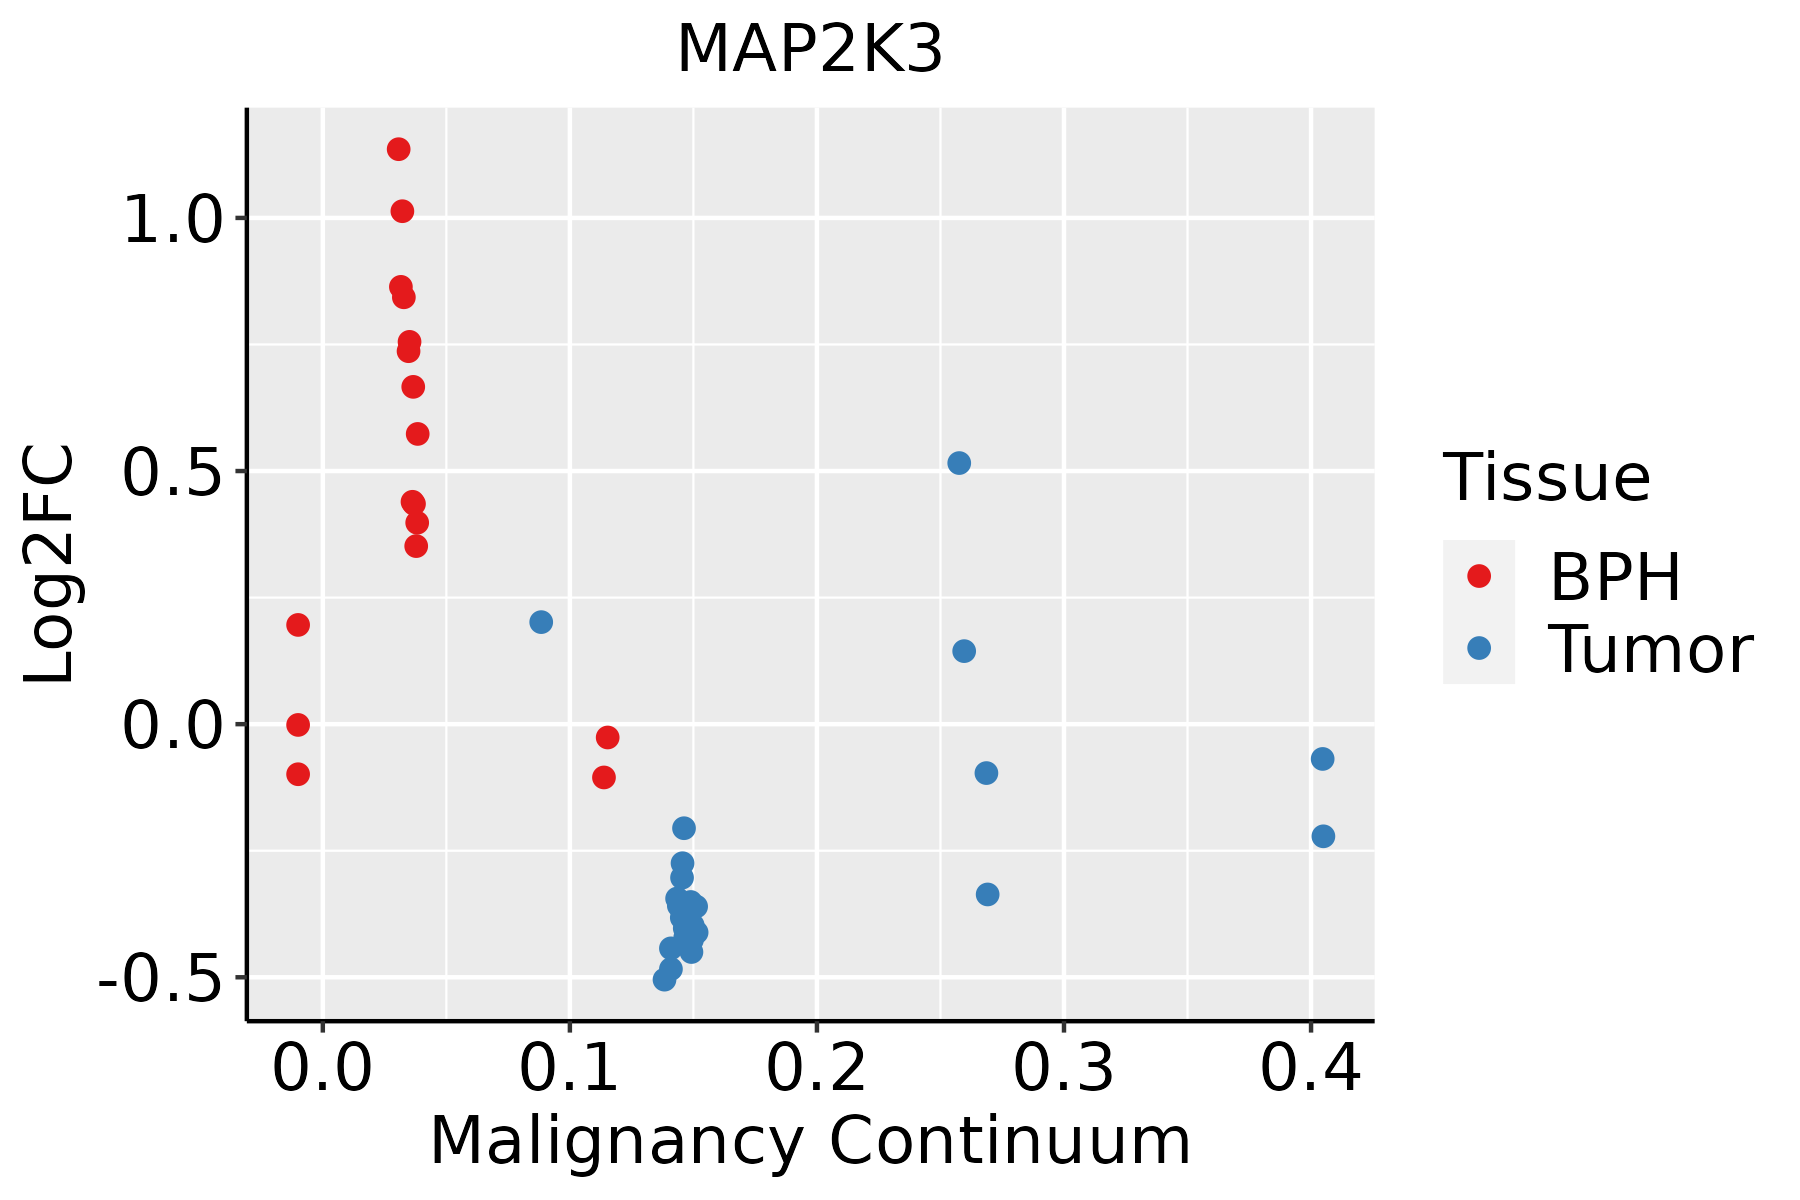 | BPH: Benign Prostatic Hyperplasia |
| ∗log2FC in expression of this searched gene in stem-like cells from each diseased tissue sample relative to stem-like cells in normal samples in each tissue plotted against the malignancy continuum. Samples are colored based on if they are from different disease stage. |
Top |
Malignant transformation related pathway analysis |
| Find out the enriched GO biological processes and KEGG pathways involved in transition from healthy to precancer to cancer |
| Tissue | Disease Stage | Enriched GO biological Processes |
| Colorectum | AD |  |
| Colorectum | SER |  |
| Colorectum | MSS |  |
| Colorectum | MSI-H |  |
| Colorectum | FAP |  |
| ∗Top 15 enriched GO BP terms are showed in the bar plot of each disease state in each tissue. Each row represents a significant GO biological process which is colored according to the -log10(p.adjust). |
| Page: 1 2 3 4 5 6 7 8 9 |
| GO ID | Tissue | Disease Stage | Description | Gene Ratio | Bg Ratio | pvalue | p.adjust | Count |
| GO:0001667 | Colorectum | AD | ameboidal-type cell migration | 137/3918 | 475/18723 | 2.17e-05 | 4.33e-04 | 137 |
| GO:0090132 | Colorectum | AD | epithelium migration | 105/3918 | 360/18723 | 1.18e-04 | 1.73e-03 | 105 |
| GO:0010632 | Colorectum | AD | regulation of epithelial cell migration | 88/3918 | 292/18723 | 1.19e-04 | 1.75e-03 | 88 |
| GO:0033674 | Colorectum | AD | positive regulation of kinase activity | 131/3918 | 467/18723 | 1.28e-04 | 1.85e-03 | 131 |
| GO:0010631 | Colorectum | AD | epithelial cell migration | 104/3918 | 357/18723 | 1.33e-04 | 1.90e-03 | 104 |
| GO:0090130 | Colorectum | AD | tissue migration | 105/3918 | 365/18723 | 2.10e-04 | 2.77e-03 | 105 |
| GO:0007568 | Colorectum | AD | aging | 98/3918 | 339/18723 | 2.77e-04 | 3.39e-03 | 98 |
| GO:0010634 | Colorectum | AD | positive regulation of epithelial cell migration | 56/3918 | 176/18723 | 4.51e-04 | 5.03e-03 | 56 |
| GO:0051403 | Colorectum | AD | stress-activated MAPK cascade | 72/3918 | 239/18723 | 4.77e-04 | 5.25e-03 | 72 |
| GO:0031098 | Colorectum | AD | stress-activated protein kinase signaling cascade | 74/3918 | 247/18723 | 4.80e-04 | 5.27e-03 | 74 |
| GO:0045860 | Colorectum | AD | positive regulation of protein kinase activity | 107/3918 | 386/18723 | 8.01e-04 | 7.92e-03 | 107 |
| GO:0043542 | Colorectum | AD | endothelial cell migration | 78/3918 | 279/18723 | 2.97e-03 | 2.22e-02 | 78 |
| GO:0010595 | Colorectum | AD | positive regulation of endothelial cell migration | 40/3918 | 133/18723 | 8.01e-03 | 4.73e-02 | 40 |
| GO:00016671 | Colorectum | SER | ameboidal-type cell migration | 105/2897 | 475/18723 | 6.97e-05 | 1.59e-03 | 105 |
| GO:00901321 | Colorectum | SER | epithelium migration | 82/2897 | 360/18723 | 1.50e-04 | 2.93e-03 | 82 |
| GO:00106311 | Colorectum | SER | epithelial cell migration | 81/2897 | 357/18723 | 1.87e-04 | 3.44e-03 | 81 |
| GO:00901301 | Colorectum | SER | tissue migration | 82/2897 | 365/18723 | 2.40e-04 | 4.12e-03 | 82 |
| GO:00106321 | Colorectum | SER | regulation of epithelial cell migration | 68/2897 | 292/18723 | 2.72e-04 | 4.53e-03 | 68 |
| GO:00336741 | Colorectum | SER | positive regulation of kinase activity | 95/2897 | 467/18723 | 2.62e-03 | 2.41e-02 | 95 |
| GO:00435421 | Colorectum | SER | endothelial cell migration | 61/2897 | 279/18723 | 2.76e-03 | 2.47e-02 | 61 |
| Page: 1 2 3 4 5 6 7 8 |
| Pathway ID | Tissue | Disease Stage | Description | Gene Ratio | Bg Ratio | pvalue | p.adjust | qvalue | Count |
| hsa04714 | Colorectum | AD | Thermogenesis | 120/2092 | 232/8465 | 2.76e-19 | 1.16e-17 | 7.37e-18 | 120 |
| hsa05014 | Colorectum | AD | Amyotrophic lateral sclerosis | 164/2092 | 364/8465 | 4.28e-18 | 1.27e-16 | 8.09e-17 | 164 |
| hsa05022 | Colorectum | AD | Pathways of neurodegeneration - multiple diseases | 201/2092 | 476/8465 | 4.54e-18 | 1.27e-16 | 8.09e-17 | 201 |
| hsa05132 | Colorectum | AD | Salmonella infection | 102/2092 | 249/8465 | 7.65e-09 | 1.28e-07 | 8.17e-08 | 102 |
| hsa05135 | Colorectum | AD | Yersinia infection | 58/2092 | 137/8465 | 3.90e-06 | 4.35e-05 | 2.78e-05 | 58 |
| hsa05417 | Colorectum | AD | Lipid and atherosclerosis | 73/2092 | 215/8465 | 1.31e-03 | 8.27e-03 | 5.27e-03 | 73 |
| hsa05170 | Colorectum | AD | Human immunodeficiency virus 1 infection | 72/2092 | 212/8465 | 1.40e-03 | 8.46e-03 | 5.39e-03 | 72 |
| hsa04015 | Colorectum | AD | Rap1 signaling pathway | 71/2092 | 210/8465 | 1.72e-03 | 9.68e-03 | 6.18e-03 | 71 |
| hsa04912 | Colorectum | AD | GnRH signaling pathway | 35/2092 | 93/8465 | 3.69e-03 | 1.90e-02 | 1.21e-02 | 35 |
| hsa04218 | Colorectum | AD | Cellular senescence | 53/2092 | 156/8465 | 5.55e-03 | 2.48e-02 | 1.58e-02 | 53 |
| hsa047141 | Colorectum | AD | Thermogenesis | 120/2092 | 232/8465 | 2.76e-19 | 1.16e-17 | 7.37e-18 | 120 |
| hsa050141 | Colorectum | AD | Amyotrophic lateral sclerosis | 164/2092 | 364/8465 | 4.28e-18 | 1.27e-16 | 8.09e-17 | 164 |
| hsa050221 | Colorectum | AD | Pathways of neurodegeneration - multiple diseases | 201/2092 | 476/8465 | 4.54e-18 | 1.27e-16 | 8.09e-17 | 201 |
| hsa051321 | Colorectum | AD | Salmonella infection | 102/2092 | 249/8465 | 7.65e-09 | 1.28e-07 | 8.17e-08 | 102 |
| hsa051351 | Colorectum | AD | Yersinia infection | 58/2092 | 137/8465 | 3.90e-06 | 4.35e-05 | 2.78e-05 | 58 |
| hsa054171 | Colorectum | AD | Lipid and atherosclerosis | 73/2092 | 215/8465 | 1.31e-03 | 8.27e-03 | 5.27e-03 | 73 |
| hsa051701 | Colorectum | AD | Human immunodeficiency virus 1 infection | 72/2092 | 212/8465 | 1.40e-03 | 8.46e-03 | 5.39e-03 | 72 |
| hsa040151 | Colorectum | AD | Rap1 signaling pathway | 71/2092 | 210/8465 | 1.72e-03 | 9.68e-03 | 6.18e-03 | 71 |
| hsa049121 | Colorectum | AD | GnRH signaling pathway | 35/2092 | 93/8465 | 3.69e-03 | 1.90e-02 | 1.21e-02 | 35 |
| hsa042181 | Colorectum | AD | Cellular senescence | 53/2092 | 156/8465 | 5.55e-03 | 2.48e-02 | 1.58e-02 | 53 |
| Page: 1 2 3 4 5 6 7 8 9 10 11 12 13 14 15 |
Top |
Cell-cell communication analysis |
| Identification of potential cell-cell interactions between two cell types and their ligand-receptor pairs for different disease states |
| Ligand | Receptor | LRpair | Pathway | Tissue | Disease Stage |
| Page: 1 |
Top |
Single-cell gene regulatory network inference analysis |
| Find out the significant the regulons (TFs) and the target genes of each regulon across cell types for different disease states |
| TF | Cell Type | Tissue | Disease Stage | Target Gene | RSS | Regulon Activity |
| ∗The dot plots of a searched regulon are shown for all cell subpopulations in each disease state of each tissue based on the regulon specific score inferred using pySCENIC and by calculating the average expression. |
| Page: 1 |
Top |
Somatic mutation of malignant transformation related genes |
| Annotation of somatic variants for genes involved in malignant transformation |
| Hugo Symbol | Variant Class | Variant Classification | dbSNP RS | HGVSc | HGVSp | HGVSp Short | SWISSPROT | BIOTYPE | SIFT | PolyPhen | Tumor Sample Barcode | Tissue | Histology | Sex | Age | Stage | Therapy Types | Drugs | Outcome |
| MAP2K3 | SNV | Missense_Mutation | rs748513234 | c.466G>T | p.Asp156Tyr | p.D156Y | P46734 | protein_coding | deleterious(0) | possibly_damaging(0.526) | TCGA-AN-A0FX-01 | Breast | breast invasive carcinoma | Female | <65 | I/II | Unknown | Unknown | SD |
| MAP2K3 | SNV | Missense_Mutation | novel | c.545N>A | p.Ser182Asn | p.S182N | P46734 | protein_coding | tolerated(0.1) | benign(0.034) | TCGA-D8-A1XR-01 | Breast | breast invasive carcinoma | Female | <65 | I/II | Chemotherapy | adriamycin+cyclophosphamide | SD |
| MAP2K3 | SNV | Missense_Mutation | rs148304866 | c.455N>A | p.Arg152Gln | p.R152Q | P46734 | protein_coding | deleterious(0.02) | benign(0.003) | TCGA-JL-A3YW-01 | Breast | breast invasive carcinoma | Female | <65 | I/II | Unknown | Unknown | SD |
| MAP2K3 | insertion | Frame_Shift_Ins | novel | c.900_901insATAAAGGAGTACGAGGTTGAAGG | p.Phe301IlefsTer14 | p.F301Ifs*14 | P46734 | protein_coding | TCGA-AO-A0J9-01 | Breast | breast invasive carcinoma | Female | <65 | III/IV | Chemotherapy | cyclophosphamide | PD | ||
| MAP2K3 | SNV | Missense_Mutation | c.778N>C | p.Glu260Gln | p.E260Q | P46734 | protein_coding | deleterious(0) | probably_damaging(0.959) | TCGA-C5-A3HE-01 | Cervix | cervical & endocervical cancer | Female | <65 | I/II | Unknown | Unknown | PD | |
| MAP2K3 | SNV | Missense_Mutation | c.50N>C | p.Gly17Ala | p.G17A | P46734 | protein_coding | tolerated(0.54) | benign(0.033) | TCGA-FU-A2QG-01 | Cervix | cervical & endocervical cancer | Female | <65 | I/II | Unknown | Unknown | SD | |
| MAP2K3 | SNV | Missense_Mutation | novel | c.140G>T | p.Arg47Leu | p.R47L | P46734 | protein_coding | tolerated(0.07) | benign(0.137) | TCGA-VS-A8EL-01 | Cervix | cervical & endocervical cancer | Female | <65 | I/II | Chemotherapy | cisplatin | CR |
| MAP2K3 | SNV | Missense_Mutation | c.1028T>C | p.Leu343Pro | p.L343P | P46734 | protein_coding | deleterious(0) | probably_damaging(0.959) | TCGA-AA-3710-01 | Colorectum | colon adenocarcinoma | Female | >=65 | I/II | Unknown | Unknown | SD | |
| MAP2K3 | SNV | Missense_Mutation | rs775653621 | c.119N>A | p.Pro40His | p.P40H | P46734 | protein_coding | deleterious(0) | possibly_damaging(0.819) | TCGA-AA-3950-01 | Colorectum | colon adenocarcinoma | Female | >=65 | I/II | Unknown | Unknown | SD |
| MAP2K3 | SNV | Missense_Mutation | c.931N>T | p.Ala311Ser | p.A311S | P46734 | protein_coding | tolerated(0.74) | benign(0.009) | TCGA-AA-3977-01 | Colorectum | colon adenocarcinoma | Male | >=65 | I/II | Unknown | Unknown | SD |
| Page: 1 2 3 4 5 6 7 8 |
Top |
Related drugs of malignant transformation related genes |
| Identification of chemicals and drugs interact with genes involved in malignant transfromation |
| (DGIdb 4.0) |
| Entrez ID | Symbol | Category | Interaction Types | Drug Claim Name | Drug Name | PMIDs |
| 5606 | MAP2K3 | KINASE, DRUGGABLE GENOME, TRANSPORTER, ENZYME, SERINE THREONINE KINASE, TYROSINE KINASE | inhibitor | TRAMETINIB | TRAMETINIB | |
| 5606 | MAP2K3 | KINASE, DRUGGABLE GENOME, TRANSPORTER, ENZYME, SERINE THREONINE KINASE, TYROSINE KINASE | inhibitor | AZD6244 | SELUMETINIB | |
| 5606 | MAP2K3 | KINASE, DRUGGABLE GENOME, TRANSPORTER, ENZYME, SERINE THREONINE KINASE, TYROSINE KINASE | inhibitor | DABRAFENIB MESYLATE | ||
| 5606 | MAP2K3 | KINASE, DRUGGABLE GENOME, TRANSPORTER, ENZYME, SERINE THREONINE KINASE, TYROSINE KINASE | WX-554 | WX-554 | ||
| 5606 | MAP2K3 | KINASE, DRUGGABLE GENOME, TRANSPORTER, ENZYME, SERINE THREONINE KINASE, TYROSINE KINASE | inhibitor | MEK162 | BINIMETINIB | |
| 5606 | MAP2K3 | KINASE, DRUGGABLE GENOME, TRANSPORTER, ENZYME, SERINE THREONINE KINASE, TYROSINE KINASE | ROSIGLITAZONE | ROSIGLITAZONE | 11591391 | |
| 5606 | MAP2K3 | KINASE, DRUGGABLE GENOME, TRANSPORTER, ENZYME, SERINE THREONINE KINASE, TYROSINE KINASE | inhibitor | BAY869766 | ||
| 5606 | MAP2K3 | KINASE, DRUGGABLE GENOME, TRANSPORTER, ENZYME, SERINE THREONINE KINASE, TYROSINE KINASE | inhibitor | GDC-0973 | COBIMETINIB | |
| 5606 | MAP2K3 | KINASE, DRUGGABLE GENOME, TRANSPORTER, ENZYME, SERINE THREONINE KINASE, TYROSINE KINASE | inhibitor | 178102628 | ||
| 5606 | MAP2K3 | KINASE, DRUGGABLE GENOME, TRANSPORTER, ENZYME, SERINE THREONINE KINASE, TYROSINE KINASE | inhibitor | SELUMETINIB | SELUMETINIB |
| Page: 1 2 |

Copyright 2023-Present -The University of Texas Health Science Center at Houston |