| Tissue | Expression Dynamics | Abbreviation |
| Cervix |  | CC: Cervix cancer |
| HSIL_HPV: HPV-infected high-grade squamous intraepithelial lesions |
| N_HPV: HPV-infected normal cervix |
| Esophagus |  | ESCC: Esophageal squamous cell carcinoma |
| HGIN: High-grade intraepithelial neoplasias |
| LGIN: Low-grade intraepithelial neoplasias |
| Liver |  | HCC: Hepatocellular carcinoma |
| NAFLD: Non-alcoholic fatty liver disease |
| Oral Cavity | 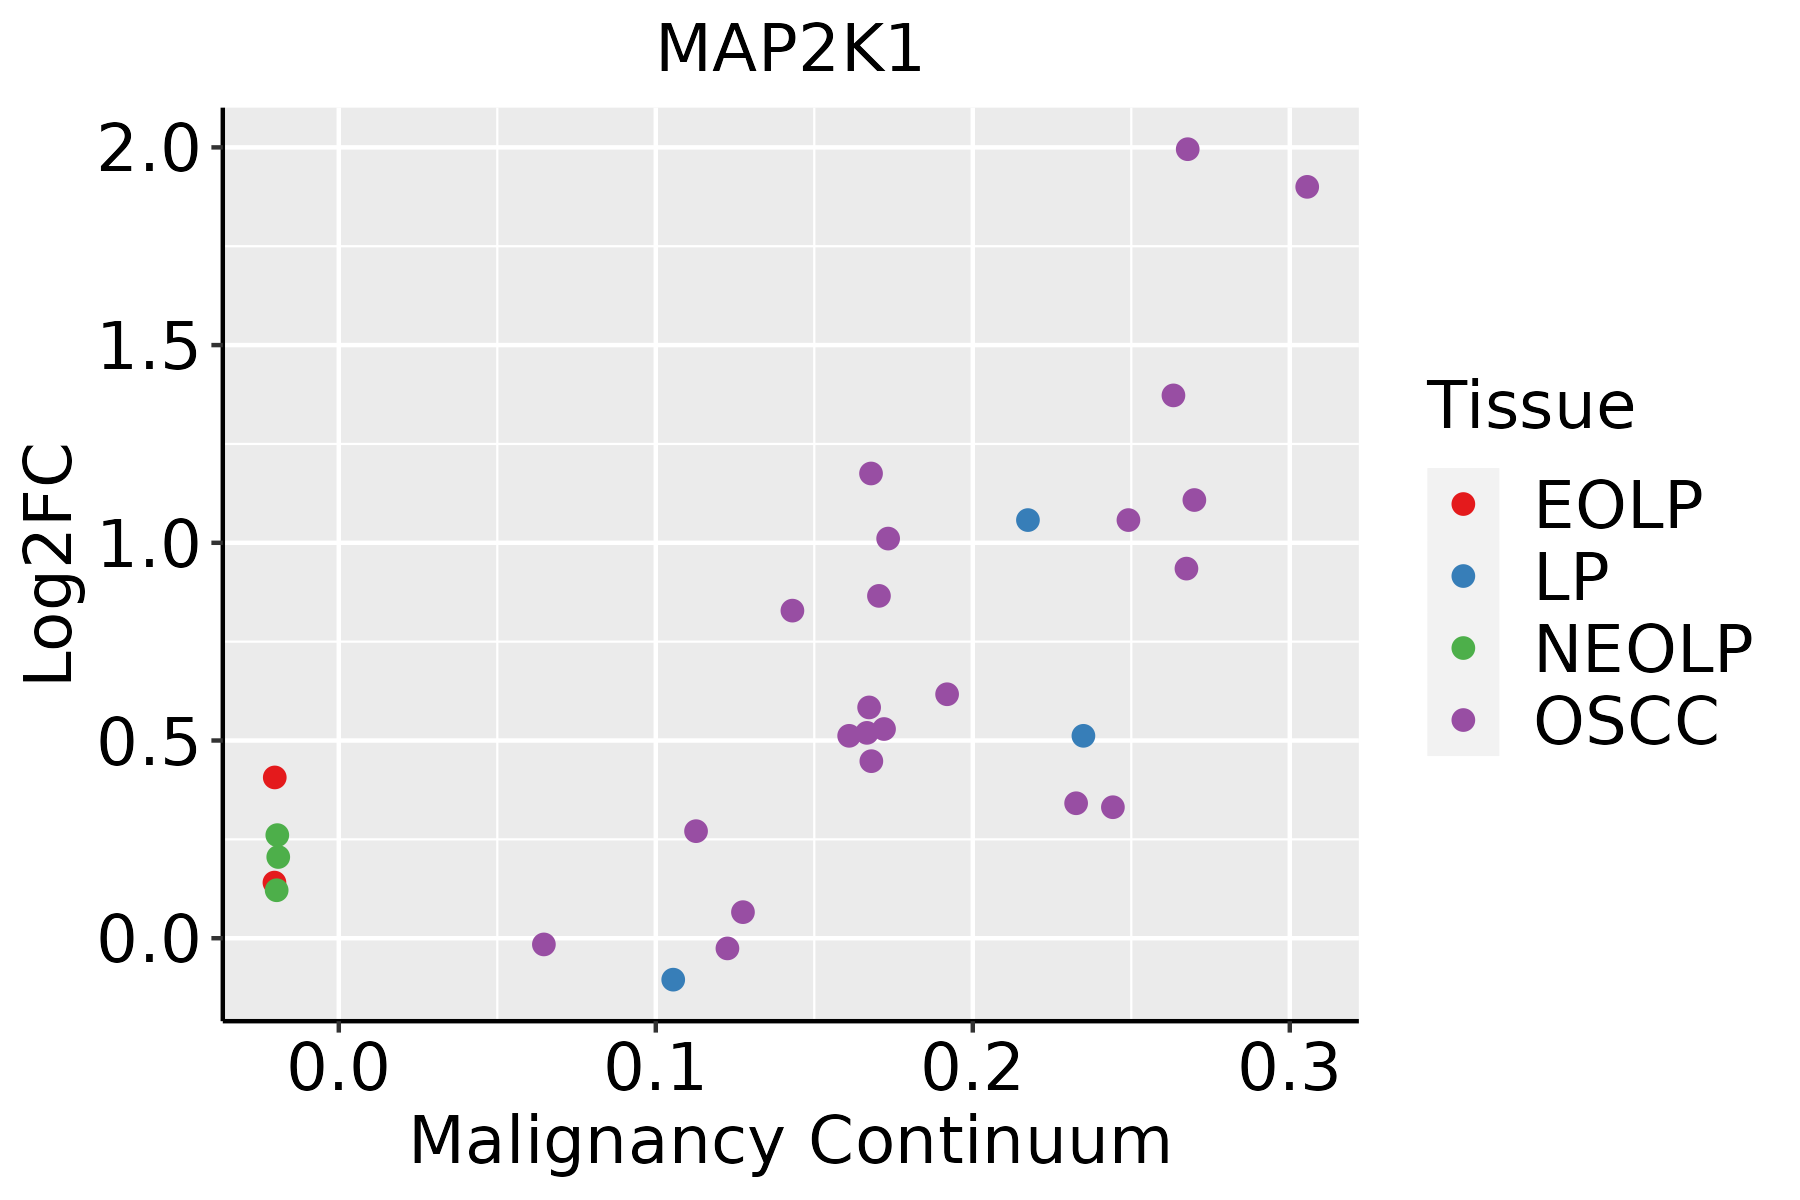 | EOLP: Erosive Oral lichen planus |
| LP: leukoplakia |
| NEOLP: Non-erosive oral lichen planus |
| OSCC: Oral squamous cell carcinoma |
| Skin | 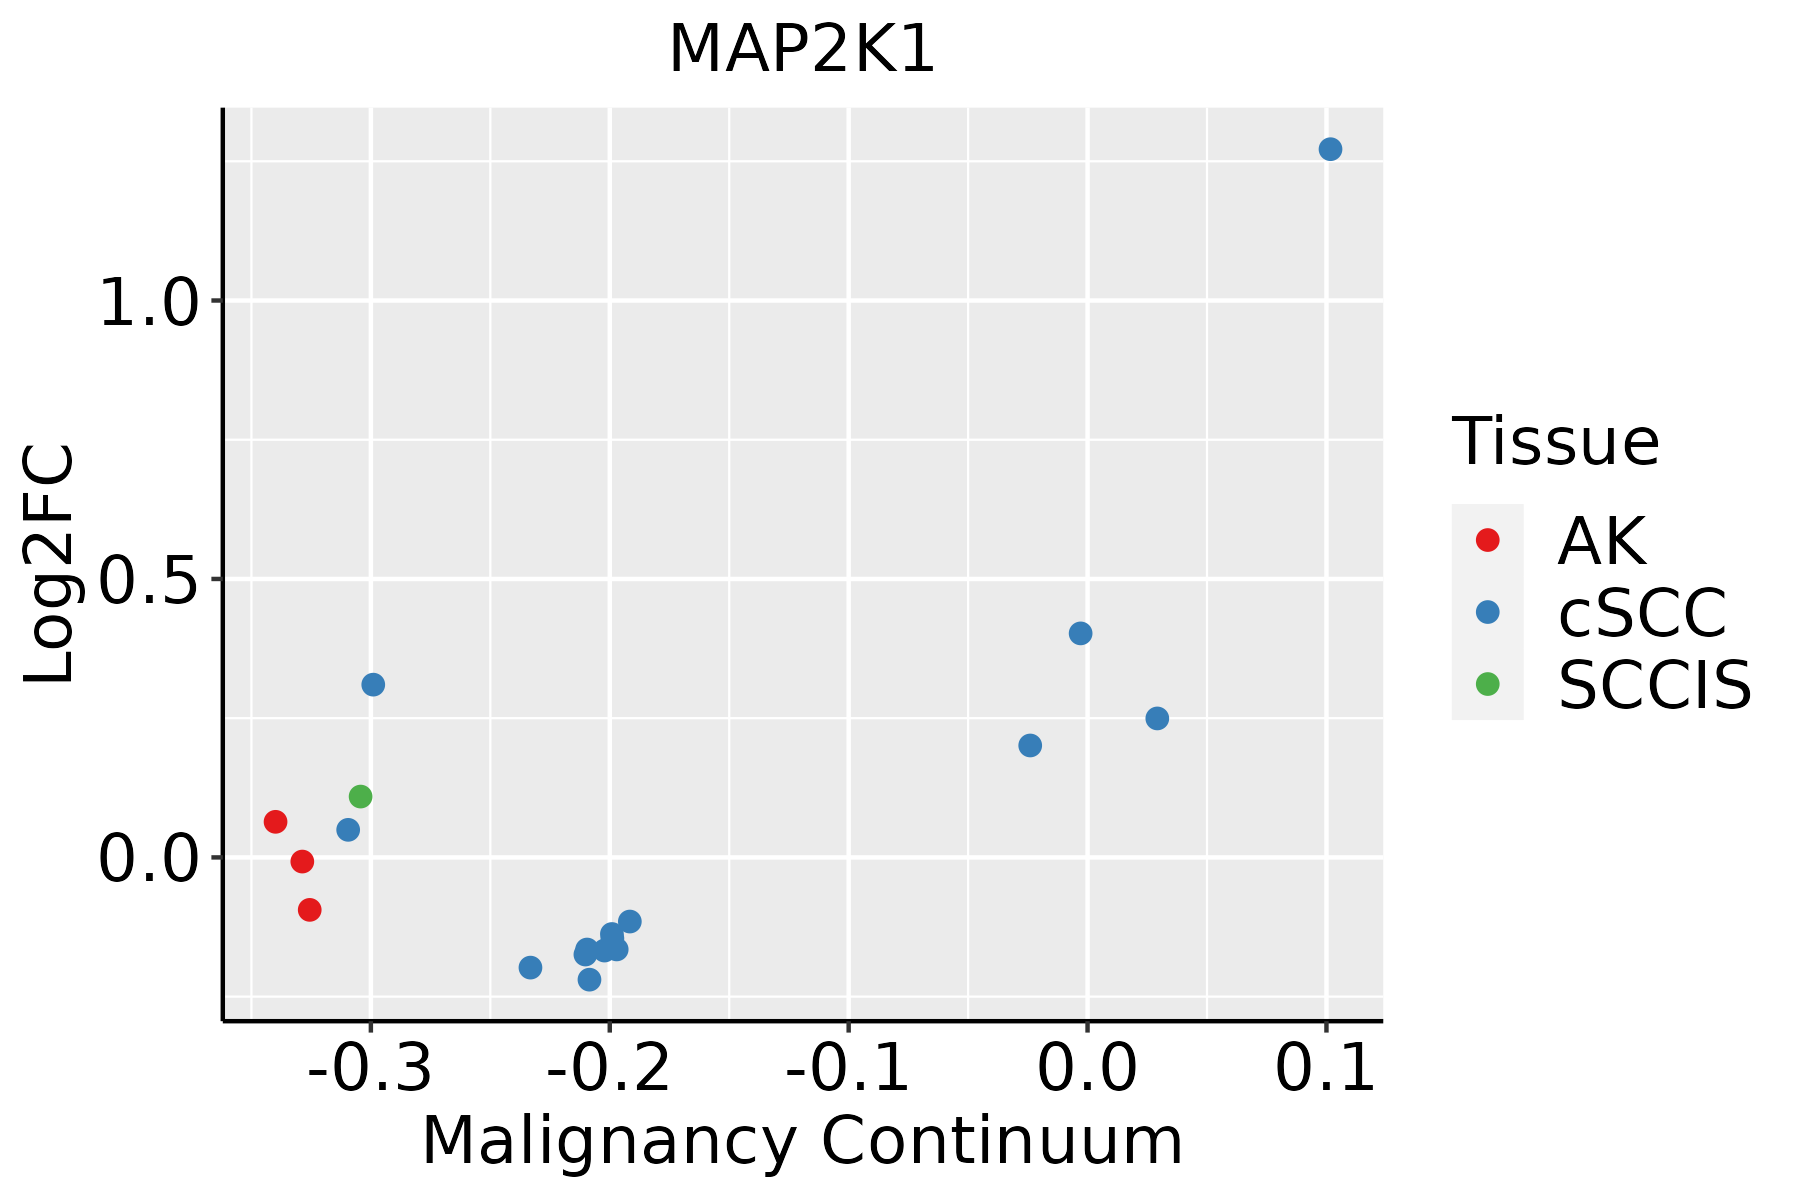 | AK: Actinic keratosis |
| cSCC: Cutaneous squamous cell carcinoma |
| SCCIS:squamous cell carcinoma in situ |
| GO ID | Tissue | Disease Stage | Description | Gene Ratio | Bg Ratio | pvalue | p.adjust | Count |
| GO:00085446 | Cervix | CC | epidermis development | 83/2311 | 324/18723 | 3.91e-11 | 8.54e-09 | 83 |
| GO:00435884 | Cervix | CC | skin development | 71/2311 | 263/18723 | 8.04e-11 | 1.46e-08 | 71 |
| GO:00506737 | Cervix | CC | epithelial cell proliferation | 98/2311 | 437/18723 | 2.01e-09 | 2.15e-07 | 98 |
| GO:003367410 | Cervix | CC | positive regulation of kinase activity | 101/2311 | 467/18723 | 8.66e-09 | 7.22e-07 | 101 |
| GO:00302164 | Cervix | CC | keratinocyte differentiation | 42/2311 | 139/18723 | 1.74e-08 | 1.28e-06 | 42 |
| GO:00099137 | Cervix | CC | epidermal cell differentiation | 53/2311 | 202/18723 | 5.48e-08 | 3.25e-06 | 53 |
| GO:00458608 | Cervix | CC | positive regulation of protein kinase activity | 85/2311 | 386/18723 | 5.61e-08 | 3.29e-06 | 85 |
| GO:00075689 | Cervix | CC | aging | 75/2311 | 339/18723 | 2.75e-07 | 1.13e-05 | 75 |
| GO:00018908 | Cervix | CC | placenta development | 40/2311 | 144/18723 | 4.59e-07 | 1.77e-05 | 40 |
| GO:19030349 | Cervix | CC | regulation of response to wounding | 44/2311 | 167/18723 | 6.33e-07 | 2.31e-05 | 44 |
| GO:00310988 | Cervix | CC | stress-activated protein kinase signaling cascade | 58/2311 | 247/18723 | 8.02e-07 | 2.89e-05 | 58 |
| GO:00614588 | Cervix | CC | reproductive system development | 87/2311 | 427/18723 | 1.37e-06 | 4.55e-05 | 87 |
| GO:00486088 | Cervix | CC | reproductive structure development | 86/2311 | 424/18723 | 1.90e-06 | 5.97e-05 | 86 |
| GO:00719007 | Cervix | CC | regulation of protein serine/threonine kinase activity | 75/2311 | 359/18723 | 2.76e-06 | 8.02e-05 | 75 |
| GO:00514038 | Cervix | CC | stress-activated MAPK cascade | 55/2311 | 239/18723 | 2.96e-06 | 8.31e-05 | 55 |
| GO:00323868 | Cervix | CC | regulation of intracellular transport | 71/2311 | 337/18723 | 3.70e-06 | 9.74e-05 | 71 |
| GO:00109757 | Cervix | CC | regulation of neuron projection development | 88/2311 | 445/18723 | 4.26e-06 | 1.09e-04 | 88 |
| GO:00107206 | Cervix | CC | positive regulation of cell development | 64/2311 | 298/18723 | 5.69e-06 | 1.41e-04 | 64 |
| GO:00703027 | Cervix | CC | regulation of stress-activated protein kinase signaling cascade | 46/2311 | 195/18723 | 9.35e-06 | 2.11e-04 | 46 |
| GO:00313467 | Cervix | CC | positive regulation of cell projection organization | 72/2311 | 353/18723 | 1.04e-05 | 2.32e-04 | 72 |
| Pathway ID | Tissue | Disease Stage | Description | Gene Ratio | Bg Ratio | pvalue | p.adjust | qvalue | Count |
| hsa0520820 | Cervix | CC | Chemical carcinogenesis - reactive oxygen species | 92/1267 | 223/8465 | 4.71e-22 | 5.09e-20 | 3.01e-20 | 92 |
| hsa0501018 | Cervix | CC | Alzheimer disease | 113/1267 | 384/8465 | 9.67e-14 | 3.92e-12 | 2.32e-12 | 113 |
| hsa0502218 | Cervix | CC | Pathways of neurodegeneration - multiple diseases | 128/1267 | 476/8465 | 2.87e-12 | 9.29e-11 | 5.50e-11 | 128 |
| hsa0513220 | Cervix | CC | Salmonella infection | 74/1267 | 249/8465 | 1.33e-09 | 2.54e-08 | 1.50e-08 | 74 |
| hsa0516720 | Cervix | CC | Kaposi sarcoma-associated herpesvirus infection | 60/1267 | 194/8465 | 9.74e-09 | 1.58e-07 | 9.33e-08 | 60 |
| hsa0516318 | Cervix | CC | Human cytomegalovirus infection | 65/1267 | 225/8465 | 4.59e-08 | 6.47e-07 | 3.83e-07 | 65 |
| hsa0520516 | Cervix | CC | Proteoglycans in cancer | 60/1267 | 205/8465 | 9.13e-08 | 1.18e-06 | 7.00e-07 | 60 |
| hsa0421810 | Cervix | CC | Cellular senescence | 49/1267 | 156/8465 | 1.30e-07 | 1.63e-06 | 9.61e-07 | 49 |
| hsa0451010 | Cervix | CC | Focal adhesion | 59/1267 | 203/8465 | 1.53e-07 | 1.84e-06 | 1.09e-06 | 59 |
| hsa0481016 | Cervix | CC | Regulation of actin cytoskeleton | 64/1267 | 229/8465 | 2.24e-07 | 2.59e-06 | 1.53e-06 | 64 |
| hsa0491520 | Cervix | CC | Estrogen signaling pathway | 44/1267 | 138/8465 | 3.55e-07 | 3.97e-06 | 2.35e-06 | 44 |
| hsa0516620 | Cervix | CC | Human T-cell leukemia virus 1 infection | 61/1267 | 222/8465 | 8.13e-07 | 7.98e-06 | 4.72e-06 | 61 |
| hsa0401512 | Cervix | CC | Rap1 signaling pathway | 56/1267 | 210/8465 | 6.23e-06 | 5.61e-05 | 3.32e-05 | 56 |
| hsa0466612 | Cervix | CC | Fc gamma R-mediated phagocytosis | 31/1267 | 97/8465 | 1.78e-05 | 1.42e-04 | 8.40e-05 | 31 |
| hsa0517016 | Cervix | CC | Human immunodeficiency virus 1 infection | 55/1267 | 212/8465 | 1.80e-05 | 1.42e-04 | 8.40e-05 | 55 |
| hsa0401210 | Cervix | CC | ErbB signaling pathway | 28/1267 | 85/8465 | 2.40e-05 | 1.82e-04 | 1.08e-04 | 28 |
| hsa0513516 | Cervix | CC | Yersinia infection | 39/1267 | 137/8465 | 3.27e-05 | 2.41e-04 | 1.42e-04 | 39 |
| hsa0407110 | Cervix | CC | Sphingolipid signaling pathway | 35/1267 | 121/8465 | 5.70e-05 | 3.93e-04 | 2.32e-04 | 35 |
| hsa0521010 | Cervix | CC | Colorectal cancer | 27/1267 | 86/8465 | 8.60e-05 | 5.57e-04 | 3.30e-04 | 27 |
| hsa052197 | Cervix | CC | Bladder cancer | 16/1267 | 41/8465 | 1.45e-04 | 9.05e-04 | 5.35e-04 | 16 |
| Hugo Symbol | Variant Class | Variant Classification | dbSNP RS | HGVSc | HGVSp | HGVSp Short | SWISSPROT | BIOTYPE | SIFT | PolyPhen | Tumor Sample Barcode | Tissue | Histology | Sex | Age | Stage | Therapy Types | Drugs | Outcome |
| MAP2K1 | SNV | Missense_Mutation | novel | c.12G>T | p.Lys4Asn | p.K4N | Q02750 | protein_coding | deleterious(0.01) | benign(0.135) | TCGA-AN-A046-01 | Breast | breast invasive carcinoma | Female | >=65 | I/II | Unknown | Unknown | SD |
| MAP2K1 | SNV | Missense_Mutation | | c.256N>G | p.Ser86Ala | p.S86A | Q02750 | protein_coding | tolerated(0.67) | benign(0.027) | TCGA-D8-A1XK-01 | Breast | breast invasive carcinoma | Female | <65 | I/II | Chemotherapy | doxorubicine+cyclophosphamide | SD |
| MAP2K1 | SNV | Missense_Mutation | | c.607N>A | p.Glu203Lys | p.E203K | Q02750 | protein_coding | deleterious(0) | possibly_damaging(0.838) | TCGA-E2-A159-01 | Breast | breast invasive carcinoma | Female | <65 | I/II | Chemotherapy | cyclophosphamide | SD |
| MAP2K1 | SNV | Missense_Mutation | rs754765552 | c.1006G>C | p.Asp336His | p.D336H | Q02750 | protein_coding | deleterious(0.03) | possibly_damaging(0.897) | TCGA-PE-A5DE-01 | Breast | breast invasive carcinoma | Female | <65 | I/II | Chemotherapy | taxotere | CR |
| MAP2K1 | insertion | Frame_Shift_Ins | novel | c.845_846insCCCAGGCTGGAGTGCAGTGGTGCGATCT | p.Ala283ProfsTer12 | p.A283Pfs*12 | Q02750 | protein_coding | | | TCGA-A2-A0EM-01 | Breast | breast invasive carcinoma | Female | >=65 | I/II | Hormone Therapy | tamoxiphen | SD |
| MAP2K1 | SNV | Missense_Mutation | novel | c.770N>T | p.Ala257Val | p.A257V | Q02750 | protein_coding | tolerated(0.11) | benign(0.274) | TCGA-EA-A3HS-01 | Cervix | cervical & endocervical cancer | Female | <65 | I/II | Unknown | Unknown | SD |
| MAP2K1 | SNV | Missense_Mutation | | c.1046N>A | p.Arg349Lys | p.R349K | Q02750 | protein_coding | deleterious(0) | probably_damaging(1) | TCGA-EK-A2RA-01 | Cervix | cervical & endocervical cancer | Female | >=65 | I/II | Unknown | Unknown | SD |
| MAP2K1 | SNV | Missense_Mutation | | c.1099N>C | p.Glu367Gln | p.E367Q | Q02750 | protein_coding | tolerated(0.07) | benign(0.062) | TCGA-VS-A94Z-01 | Cervix | cervical & endocervical cancer | Female | <65 | I/II | Chemotherapy | cisplatin | CR |
| MAP2K1 | SNV | Missense_Mutation | | c.308N>A | p.Ile103Asn | p.I103N | Q02750 | protein_coding | deleterious(0) | possibly_damaging(0.866) | TCGA-VS-A9UQ-01 | Cervix | cervical & endocervical cancer | Female | <65 | I/II | Unknown | Unknown | PD |
| MAP2K1 | SNV | Missense_Mutation | | c.692N>T | p.Ser231Leu | p.S231L | Q02750 | protein_coding | deleterious(0) | possibly_damaging(0.871) | TCGA-A6-5661-01 | Colorectum | colon adenocarcinoma | Female | >=65 | I/II | Unknown | Unknown | SD |
| Entrez ID | Symbol | Category | Interaction Types | Drug Claim Name | Drug Name | PMIDs |
| 5604 | MAP2K1 | ENZYME, DRUGGABLE GENOME, KINASE, CLINICALLY ACTIONABLE, SERINE THREONINE KINASE, DRUG RESISTANCE, TYROSINE KINASE, NUCLEAR HORMONE RECEPTOR | | SELUMETINIB | SELUMETINIB | |
| 5604 | MAP2K1 | ENZYME, DRUGGABLE GENOME, KINASE, CLINICALLY ACTIONABLE, SERINE THREONINE KINASE, DRUG RESISTANCE, TYROSINE KINASE, NUCLEAR HORMONE RECEPTOR | | WX-554 | WX-554 | |
| 5604 | MAP2K1 | ENZYME, DRUGGABLE GENOME, KINASE, CLINICALLY ACTIONABLE, SERINE THREONINE KINASE, DRUG RESISTANCE, TYROSINE KINASE, NUCLEAR HORMONE RECEPTOR | | Pyridic ketone derivative 1 | | |
| 5604 | MAP2K1 | ENZYME, DRUGGABLE GENOME, KINASE, CLINICALLY ACTIONABLE, SERINE THREONINE KINASE, DRUG RESISTANCE, TYROSINE KINASE, NUCLEAR HORMONE RECEPTOR | | PANITUMUMAB | PANITUMUMAB | 31227518 |
| 5604 | MAP2K1 | ENZYME, DRUGGABLE GENOME, KINASE, CLINICALLY ACTIONABLE, SERINE THREONINE KINASE, DRUG RESISTANCE, TYROSINE KINASE, NUCLEAR HORMONE RECEPTOR | allosteric modulator | 363894205 | TAK-733 | |
| 5604 | MAP2K1 | ENZYME, DRUGGABLE GENOME, KINASE, CLINICALLY ACTIONABLE, SERINE THREONINE KINASE, DRUG RESISTANCE, TYROSINE KINASE, NUCLEAR HORMONE RECEPTOR | allosteric modulator | 249565604 | BINIMETINIB | |
| 5604 | MAP2K1 | ENZYME, DRUGGABLE GENOME, KINASE, CLINICALLY ACTIONABLE, SERINE THREONINE KINASE, DRUG RESISTANCE, TYROSINE KINASE, NUCLEAR HORMONE RECEPTOR | | BAY 869766 | | |
| 5604 | MAP2K1 | ENZYME, DRUGGABLE GENOME, KINASE, CLINICALLY ACTIONABLE, SERINE THREONINE KINASE, DRUG RESISTANCE, TYROSINE KINASE, NUCLEAR HORMONE RECEPTOR | inhibitor | PIMASERTIB | PIMASERTIB | |
| 5604 | MAP2K1 | ENZYME, DRUGGABLE GENOME, KINASE, CLINICALLY ACTIONABLE, SERINE THREONINE KINASE, DRUG RESISTANCE, TYROSINE KINASE, NUCLEAR HORMONE RECEPTOR | inhibitor | CHEMBL2146883 | COBIMETINIB | |
| 5604 | MAP2K1 | ENZYME, DRUGGABLE GENOME, KINASE, CLINICALLY ACTIONABLE, SERINE THREONINE KINASE, DRUG RESISTANCE, TYROSINE KINASE, NUCLEAR HORMONE RECEPTOR | | VEMURAFENIB | VEMURAFENIB | 22197931,7651428,18632602,19915144,23569304,25157968 |


