
|
|||||
|
 | |
| |
| |
| |
| |
| |
|
Gene: MAP1LC3B |
Gene summary for MAP1LC3B |
| Gene information | Species | Human | Gene symbol | MAP1LC3B | Gene ID | 81631 |
| Gene name | microtubule associated protein 1 light chain 3 beta | |
| Gene Alias | ATG8F | |
| Cytomap | 16q24.2 | |
| Gene Type | protein-coding | GO ID | GO:0000045 | UniProtAcc | Q658J6 |
Top |
Malignant transformation analysis |
| Identification of the aberrant gene expression in precancerous and cancerous lesions by comparing the gene expression of stem-like cells in diseased tissues with normal stem cells |
| Entrez ID | Symbol | Replicates | Species | Organ | Tissue | Adj P-value | Log2FC | Malignancy |
| 81631 | MAP1LC3B | GSM4909277 | Human | Breast | Precancer | 1.57e-02 | 5.35e-01 | 0.0177 |
| 81631 | MAP1LC3B | GSM4909285 | Human | Breast | IDC | 2.81e-02 | 1.23e-01 | 0.21 |
| 81631 | MAP1LC3B | GSM4909286 | Human | Breast | IDC | 1.54e-09 | -3.41e-01 | 0.1081 |
| 81631 | MAP1LC3B | GSM4909287 | Human | Breast | IDC | 3.81e-11 | -4.03e-01 | 0.2057 |
| 81631 | MAP1LC3B | GSM4909293 | Human | Breast | IDC | 4.14e-09 | -3.90e-01 | 0.1581 |
| 81631 | MAP1LC3B | GSM4909294 | Human | Breast | IDC | 7.01e-04 | -2.87e-01 | 0.2022 |
| 81631 | MAP1LC3B | GSM4909296 | Human | Breast | IDC | 3.66e-19 | -4.72e-01 | 0.1524 |
| 81631 | MAP1LC3B | GSM4909297 | Human | Breast | IDC | 1.21e-20 | -4.89e-01 | 0.1517 |
| 81631 | MAP1LC3B | GSM4909298 | Human | Breast | IDC | 1.48e-05 | -3.41e-01 | 0.1551 |
| 81631 | MAP1LC3B | GSM4909301 | Human | Breast | IDC | 1.82e-03 | -3.29e-01 | 0.1577 |
| 81631 | MAP1LC3B | GSM4909302 | Human | Breast | IDC | 3.44e-20 | -5.02e-01 | 0.1545 |
| 81631 | MAP1LC3B | GSM4909304 | Human | Breast | IDC | 2.14e-04 | -2.70e-01 | 0.1636 |
| 81631 | MAP1LC3B | GSM4909305 | Human | Breast | IDC | 4.52e-03 | -3.12e-01 | 0.0436 |
| 81631 | MAP1LC3B | GSM4909306 | Human | Breast | IDC | 1.25e-05 | -4.14e-01 | 0.1564 |
| 81631 | MAP1LC3B | GSM4909307 | Human | Breast | IDC | 1.02e-11 | -4.66e-01 | 0.1569 |
| 81631 | MAP1LC3B | GSM4909308 | Human | Breast | IDC | 1.00e-04 | -3.10e-01 | 0.158 |
| 81631 | MAP1LC3B | GSM4909309 | Human | Breast | IDC | 1.10e-12 | -4.24e-01 | 0.0483 |
| 81631 | MAP1LC3B | GSM4909311 | Human | Breast | IDC | 4.13e-41 | -6.52e-01 | 0.1534 |
| 81631 | MAP1LC3B | GSM4909312 | Human | Breast | IDC | 1.21e-26 | -5.84e-01 | 0.1552 |
| 81631 | MAP1LC3B | GSM4909313 | Human | Breast | IDC | 1.45e-11 | -4.16e-01 | 0.0391 |
| Page: 1 2 3 4 5 6 7 8 9 10 11 |
| Tissue | Expression Dynamics | Abbreviation |
| Breast | 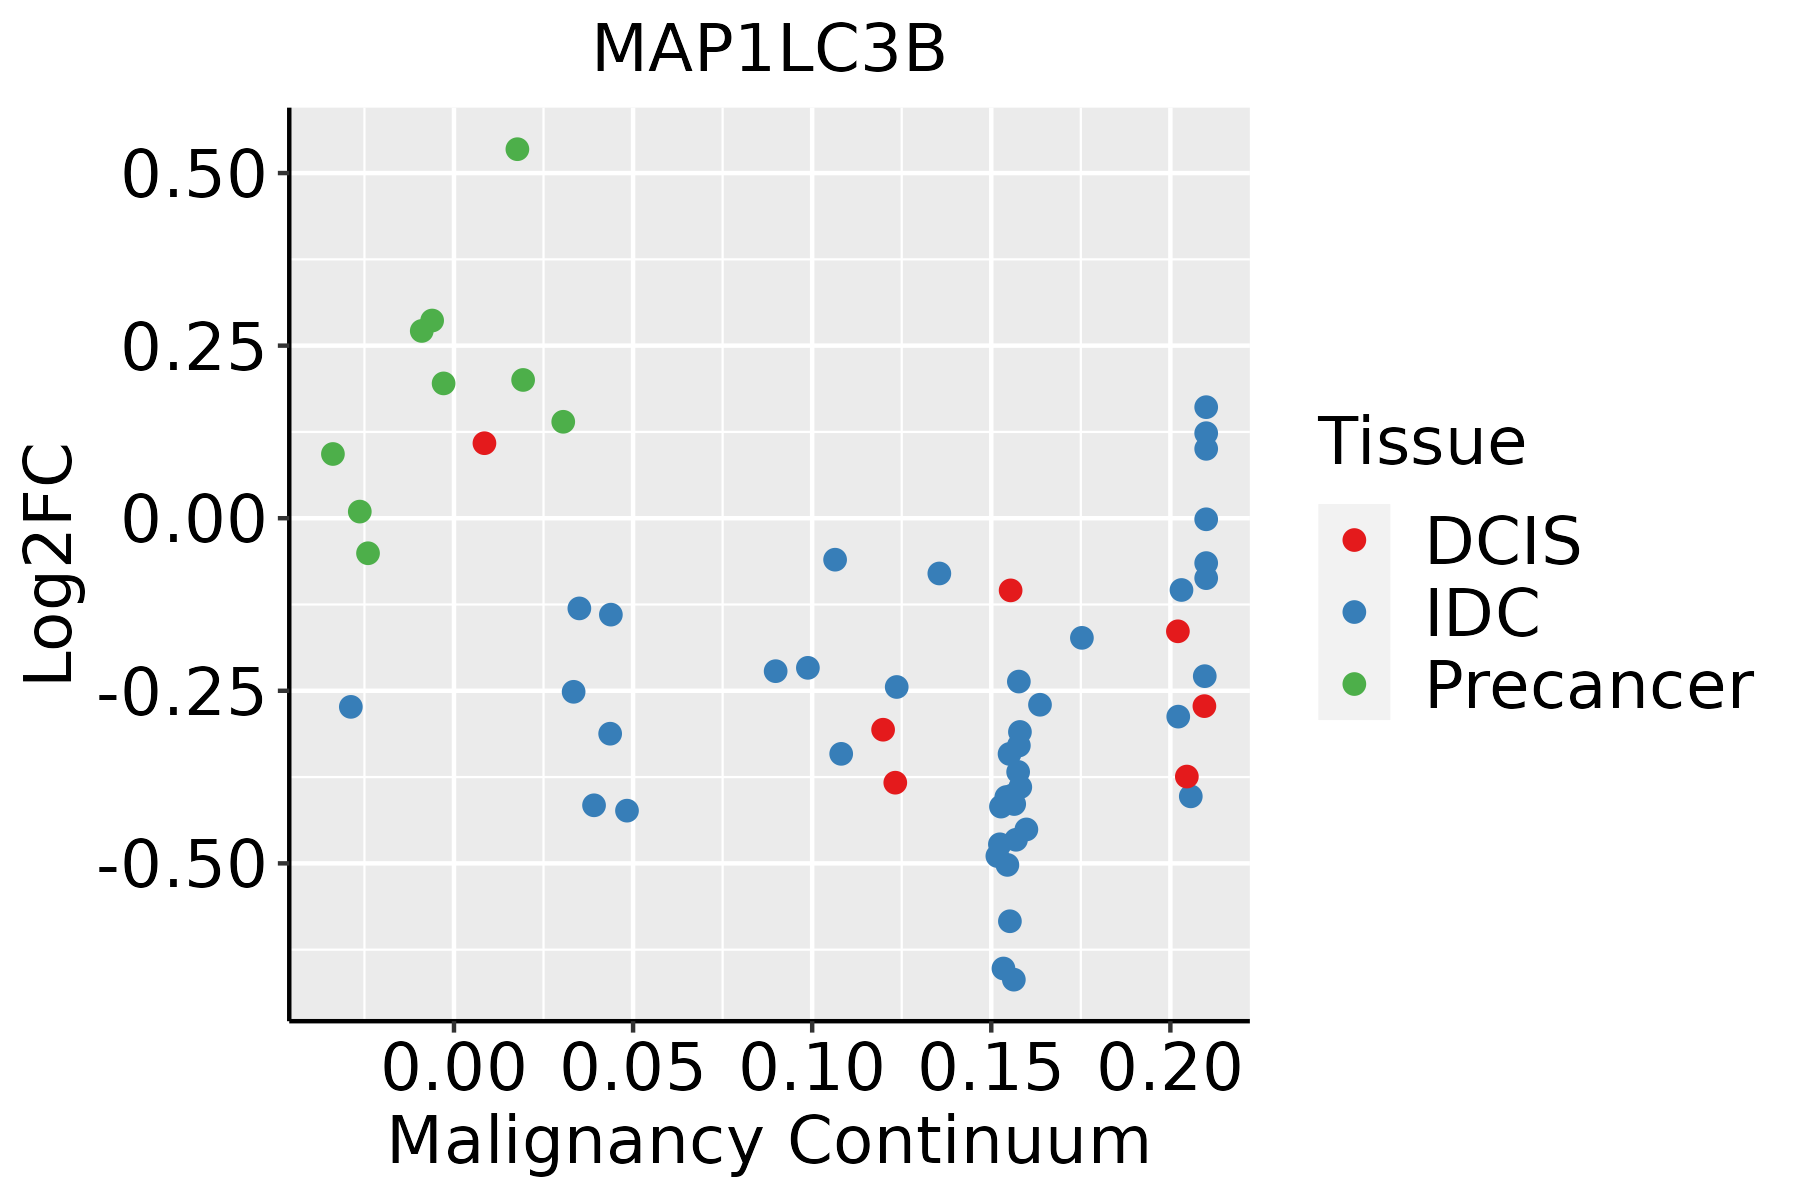 | IDC: Invasive ductal carcinoma |
| DCIS: Ductal carcinoma in situ | ||
| Precancer(BRCA1-mut): Precancerous lesion from BRCA1 mutation carriers | ||
| Cervix |  | CC: Cervix cancer |
| HSIL_HPV: HPV-infected high-grade squamous intraepithelial lesions | ||
| N_HPV: HPV-infected normal cervix | ||
| Endometrium | 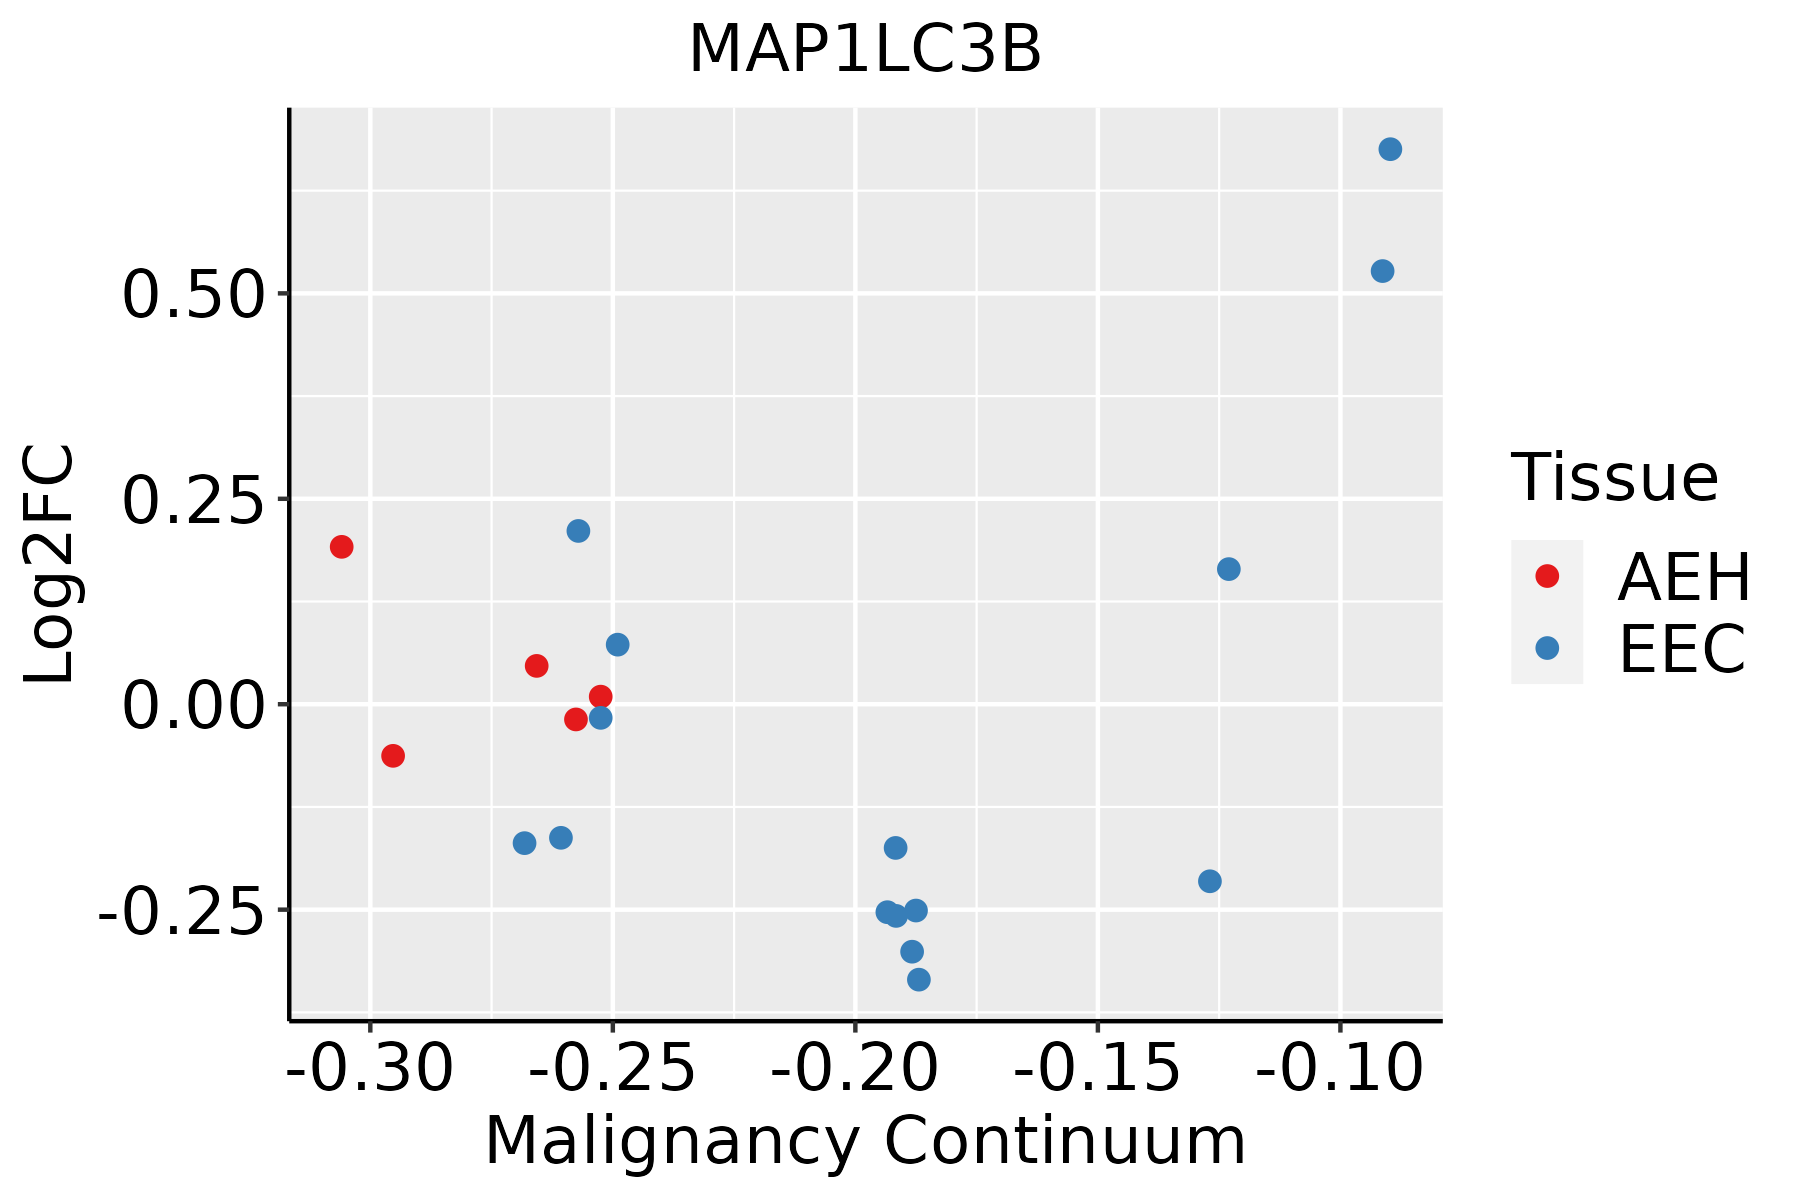 | AEH: Atypical endometrial hyperplasia |
| EEC: Endometrioid Cancer | ||
| Esophagus |  | ESCC: Esophageal squamous cell carcinoma |
| HGIN: High-grade intraepithelial neoplasias | ||
| LGIN: Low-grade intraepithelial neoplasias | ||
| Liver |  | HCC: Hepatocellular carcinoma |
| NAFLD: Non-alcoholic fatty liver disease | ||
| Oral Cavity | 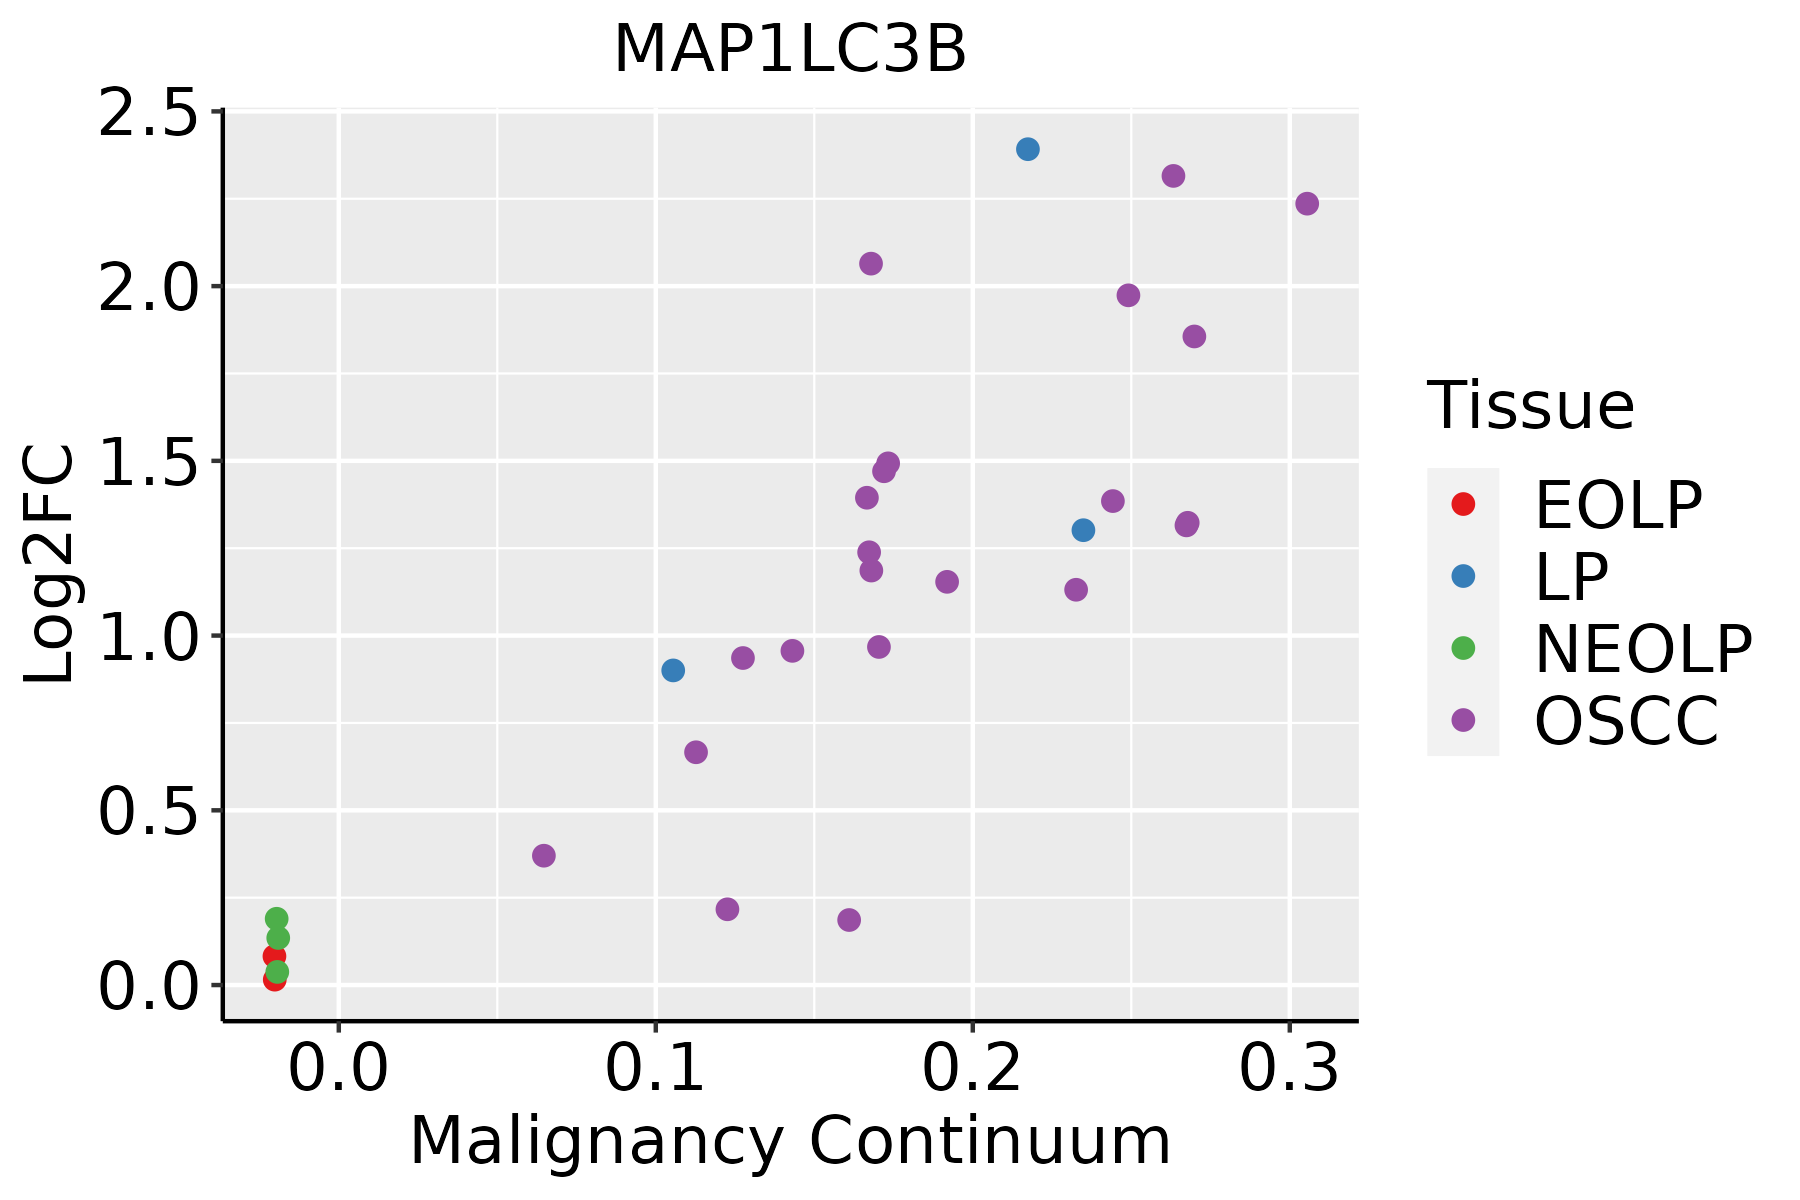 | EOLP: Erosive Oral lichen planus |
| LP: leukoplakia | ||
| NEOLP: Non-erosive oral lichen planus | ||
| OSCC: Oral squamous cell carcinoma | ||
| Prostate | 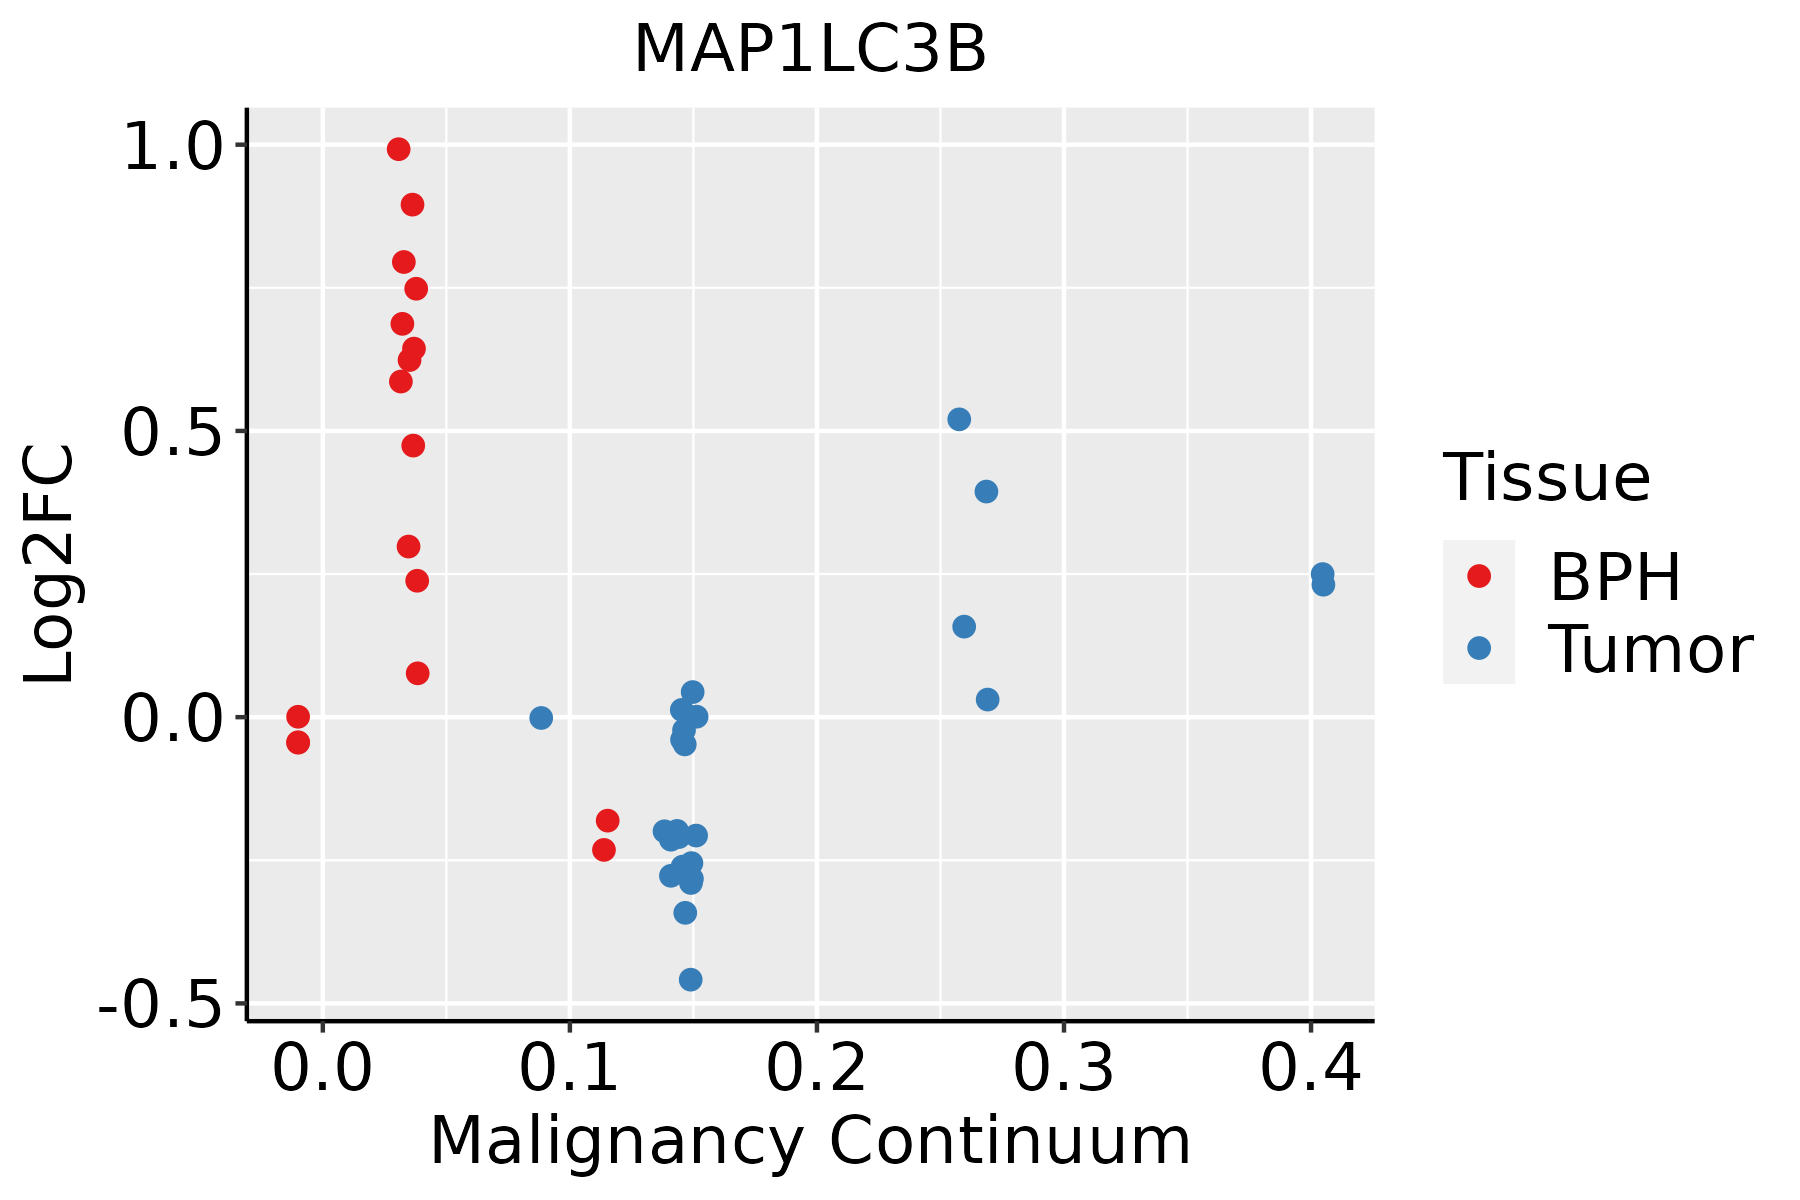 | BPH: Benign Prostatic Hyperplasia |
| Skin | 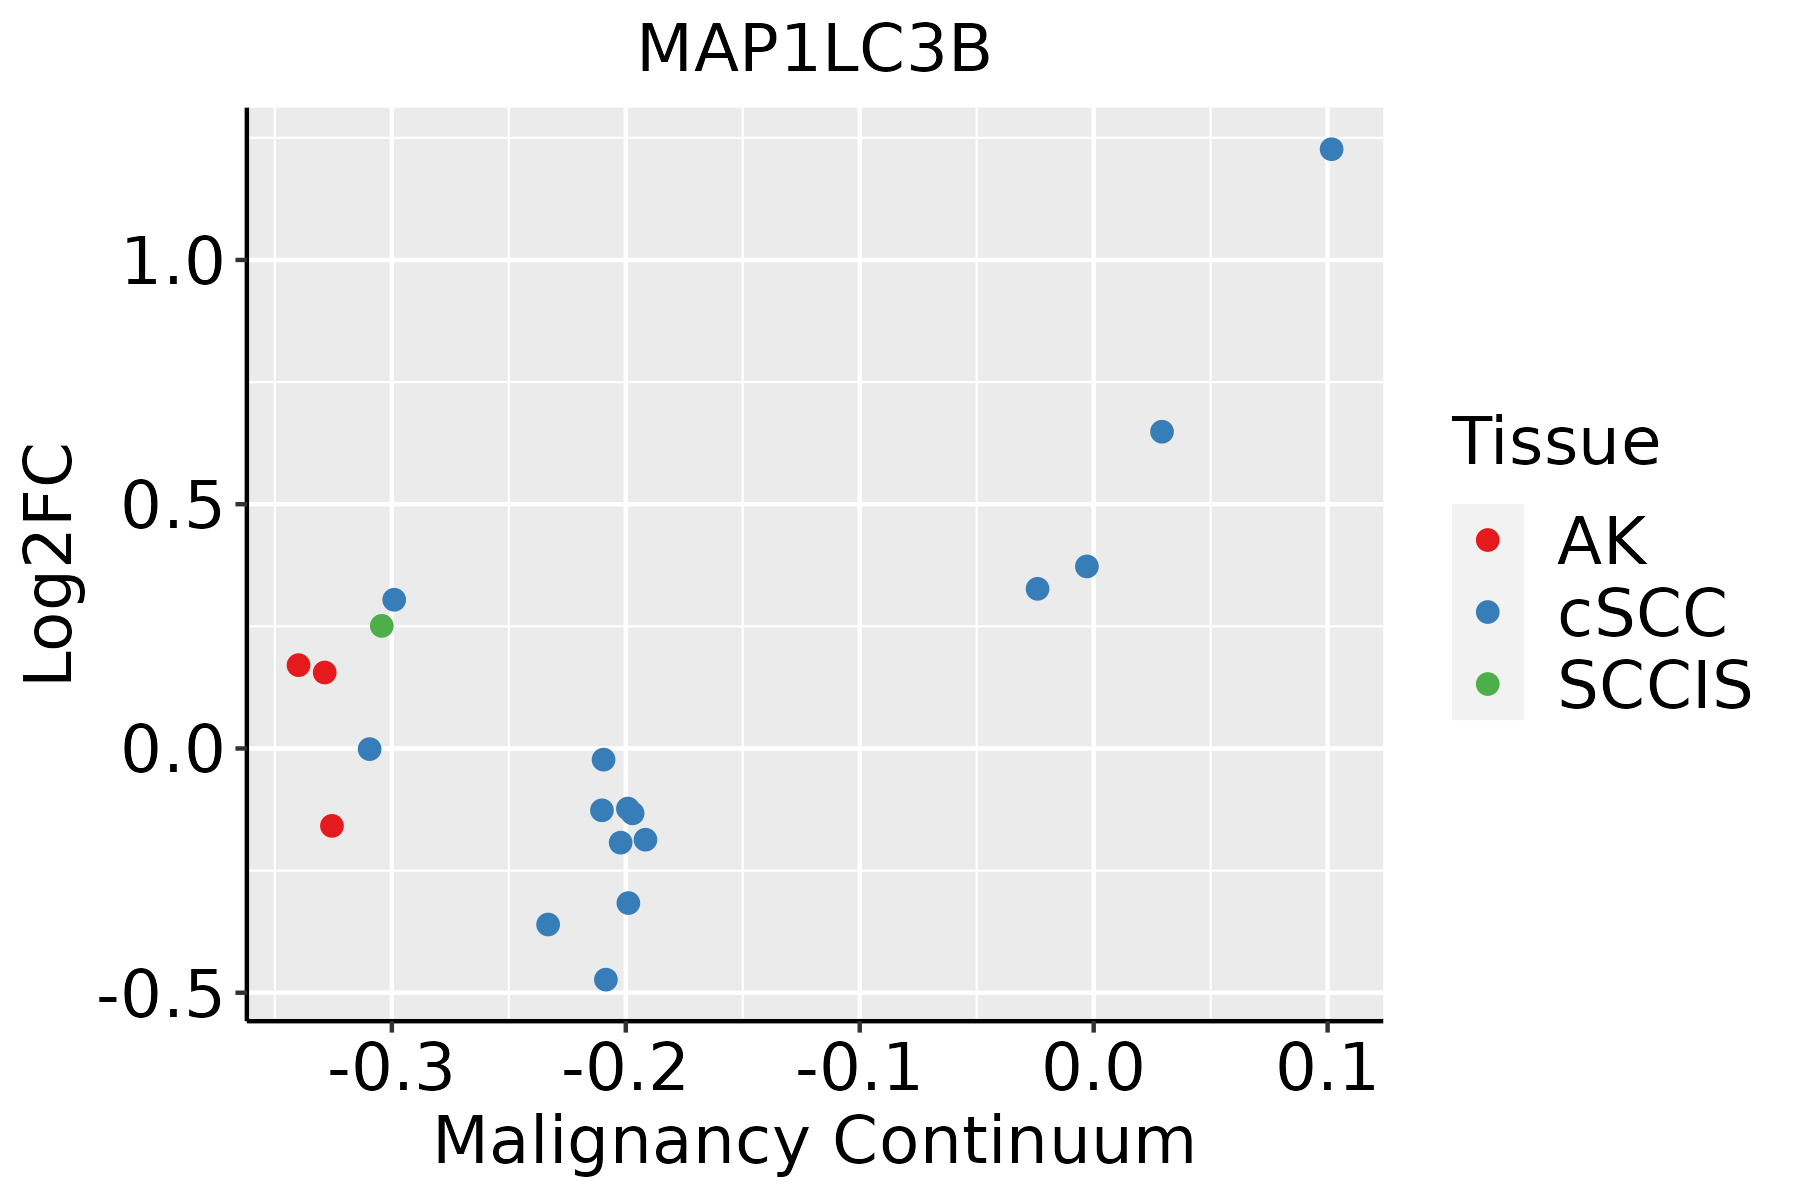 | AK: Actinic keratosis |
| cSCC: Cutaneous squamous cell carcinoma | ||
| SCCIS:squamous cell carcinoma in situ | ||
| Thyroid |  | ATC: Anaplastic thyroid cancer |
| HT: Hashimoto's thyroiditis | ||
| PTC: Papillary thyroid cancer |
| ∗log2FC in expression of this searched gene in stem-like cells from each diseased tissue sample relative to stem-like cells in normal samples in each tissue plotted against the malignancy continuum. Samples are colored based on if they are from different disease stage. |
Top |
Malignant transformation related pathway analysis |
| Find out the enriched GO biological processes and KEGG pathways involved in transition from healthy to precancer to cancer |
| Tissue | Disease Stage | Enriched GO biological Processes |
| Colorectum | AD |  |
| Colorectum | SER |  |
| Colorectum | MSS |  |
| Colorectum | MSI-H |  |
| Colorectum | FAP |  |
| ∗Top 15 enriched GO BP terms are showed in the bar plot of each disease state in each tissue. Each row represents a significant GO biological process which is colored according to the -log10(p.adjust). |
| Page: 1 2 3 4 5 6 7 8 9 |
| GO ID | Tissue | Disease Stage | Description | Gene Ratio | Bg Ratio | pvalue | p.adjust | Count |
| GO:00004226 | Breast | Precancer | autophagy of mitochondrion | 14/1080 | 81/18723 | 2.01e-04 | 3.16e-03 | 14 |
| GO:00617266 | Breast | Precancer | mitochondrion disassembly | 14/1080 | 81/18723 | 2.01e-04 | 3.16e-03 | 14 |
| GO:00316679 | Breast | Precancer | response to nutrient levels | 47/1080 | 474/18723 | 2.09e-04 | 3.27e-03 | 47 |
| GO:00224119 | Breast | Precancer | cellular component disassembly | 44/1080 | 443/18723 | 3.17e-04 | 4.51e-03 | 44 |
| GO:00714969 | Breast | Precancer | cellular response to external stimulus | 33/1080 | 320/18723 | 9.01e-04 | 1.03e-02 | 33 |
| GO:00316688 | Breast | Precancer | cellular response to extracellular stimulus | 27/1080 | 246/18723 | 1.02e-03 | 1.13e-02 | 27 |
| GO:00092677 | Breast | Precancer | cellular response to starvation | 19/1080 | 156/18723 | 1.65e-03 | 1.67e-02 | 19 |
| GO:00425947 | Breast | Precancer | response to starvation | 22/1080 | 197/18723 | 2.30e-03 | 2.15e-02 | 22 |
| GO:19030085 | Breast | Precancer | organelle disassembly | 15/1080 | 114/18723 | 2.31e-03 | 2.15e-02 | 15 |
| GO:00316697 | Breast | Precancer | cellular response to nutrient levels | 22/1080 | 215/18723 | 6.58e-03 | 4.53e-02 | 22 |
| GO:003166714 | Breast | IDC | response to nutrient levels | 62/1434 | 474/18723 | 2.33e-05 | 5.57e-04 | 62 |
| GO:007149614 | Breast | IDC | cellular response to external stimulus | 45/1434 | 320/18723 | 5.40e-05 | 1.15e-03 | 45 |
| GO:003166814 | Breast | IDC | cellular response to extracellular stimulus | 35/1434 | 246/18723 | 2.79e-04 | 4.26e-03 | 35 |
| GO:000042212 | Breast | IDC | autophagy of mitochondrion | 15/1434 | 81/18723 | 1.13e-03 | 1.23e-02 | 15 |
| GO:006172612 | Breast | IDC | mitochondrion disassembly | 15/1434 | 81/18723 | 1.13e-03 | 1.23e-02 | 15 |
| GO:003166914 | Breast | IDC | cellular response to nutrient levels | 28/1434 | 215/18723 | 4.02e-03 | 3.25e-02 | 28 |
| GO:190300812 | Breast | IDC | organelle disassembly | 17/1434 | 114/18723 | 5.99e-03 | 4.31e-02 | 17 |
| GO:007149623 | Breast | DCIS | cellular response to external stimulus | 45/1390 | 320/18723 | 2.55e-05 | 5.87e-04 | 45 |
| GO:003166723 | Breast | DCIS | response to nutrient levels | 58/1390 | 474/18723 | 1.16e-04 | 2.03e-03 | 58 |
| GO:003166822 | Breast | DCIS | cellular response to extracellular stimulus | 35/1390 | 246/18723 | 1.54e-04 | 2.59e-03 | 35 |
| Page: 1 2 3 4 5 6 7 8 9 10 11 12 13 14 15 |
| Pathway ID | Tissue | Disease Stage | Description | Gene Ratio | Bg Ratio | pvalue | p.adjust | qvalue | Count |
| hsa0501416 | Breast | Precancer | Amyotrophic lateral sclerosis | 98/684 | 364/8465 | 2.13e-28 | 8.41e-27 | 6.44e-27 | 98 |
| hsa0502216 | Breast | Precancer | Pathways of neurodegeneration - multiple diseases | 112/684 | 476/8465 | 6.96e-27 | 2.44e-25 | 1.87e-25 | 112 |
| hsa0513118 | Breast | Precancer | Shigellosis | 44/684 | 247/8465 | 3.91e-07 | 6.86e-06 | 5.26e-06 | 44 |
| hsa0516718 | Breast | Precancer | Kaposi sarcoma-associated herpesvirus infection | 36/684 | 194/8465 | 1.68e-06 | 2.53e-05 | 1.94e-05 | 36 |
| hsa0421610 | Breast | Precancer | Ferroptosis | 11/684 | 41/8465 | 2.95e-04 | 2.45e-03 | 1.88e-03 | 11 |
| hsa0413716 | Breast | Precancer | Mitophagy - animal | 15/684 | 72/8465 | 5.22e-04 | 3.93e-03 | 3.01e-03 | 15 |
| hsa0501417 | Breast | Precancer | Amyotrophic lateral sclerosis | 98/684 | 364/8465 | 2.13e-28 | 8.41e-27 | 6.44e-27 | 98 |
| hsa0502217 | Breast | Precancer | Pathways of neurodegeneration - multiple diseases | 112/684 | 476/8465 | 6.96e-27 | 2.44e-25 | 1.87e-25 | 112 |
| hsa0513119 | Breast | Precancer | Shigellosis | 44/684 | 247/8465 | 3.91e-07 | 6.86e-06 | 5.26e-06 | 44 |
| hsa0516719 | Breast | Precancer | Kaposi sarcoma-associated herpesvirus infection | 36/684 | 194/8465 | 1.68e-06 | 2.53e-05 | 1.94e-05 | 36 |
| hsa0421613 | Breast | Precancer | Ferroptosis | 11/684 | 41/8465 | 2.95e-04 | 2.45e-03 | 1.88e-03 | 11 |
| hsa0413717 | Breast | Precancer | Mitophagy - animal | 15/684 | 72/8465 | 5.22e-04 | 3.93e-03 | 3.01e-03 | 15 |
| hsa0501423 | Breast | IDC | Amyotrophic lateral sclerosis | 102/867 | 364/8465 | 1.29e-22 | 5.22e-21 | 3.91e-21 | 102 |
| hsa0502223 | Breast | IDC | Pathways of neurodegeneration - multiple diseases | 116/867 | 476/8465 | 3.63e-20 | 1.18e-18 | 8.82e-19 | 116 |
| hsa0513124 | Breast | IDC | Shigellosis | 47/867 | 247/8465 | 1.78e-05 | 2.00e-04 | 1.49e-04 | 47 |
| hsa0516723 | Breast | IDC | Kaposi sarcoma-associated herpesvirus infection | 38/867 | 194/8465 | 5.87e-05 | 5.96e-04 | 4.46e-04 | 38 |
| hsa0421623 | Breast | IDC | Ferroptosis | 12/867 | 41/8465 | 5.87e-04 | 4.89e-03 | 3.66e-03 | 12 |
| hsa0413723 | Breast | IDC | Mitophagy - animal | 17/867 | 72/8465 | 7.61e-04 | 6.04e-03 | 4.52e-03 | 17 |
| hsa0501433 | Breast | IDC | Amyotrophic lateral sclerosis | 102/867 | 364/8465 | 1.29e-22 | 5.22e-21 | 3.91e-21 | 102 |
| hsa0502233 | Breast | IDC | Pathways of neurodegeneration - multiple diseases | 116/867 | 476/8465 | 3.63e-20 | 1.18e-18 | 8.82e-19 | 116 |
| Page: 1 2 3 4 5 6 7 8 9 10 11 |
Top |
Cell-cell communication analysis |
| Identification of potential cell-cell interactions between two cell types and their ligand-receptor pairs for different disease states |
| Ligand | Receptor | LRpair | Pathway | Tissue | Disease Stage |
| Page: 1 |
Top |
Single-cell gene regulatory network inference analysis |
| Find out the significant the regulons (TFs) and the target genes of each regulon across cell types for different disease states |
| TF | Cell Type | Tissue | Disease Stage | Target Gene | RSS | Regulon Activity |
| ∗The dot plots of a searched regulon are shown for all cell subpopulations in each disease state of each tissue based on the regulon specific score inferred using pySCENIC and by calculating the average expression. |
| Page: 1 |
Top |
Somatic mutation of malignant transformation related genes |
| Annotation of somatic variants for genes involved in malignant transformation |
| Hugo Symbol | Variant Class | Variant Classification | dbSNP RS | HGVSc | HGVSp | HGVSp Short | SWISSPROT | BIOTYPE | SIFT | PolyPhen | Tumor Sample Barcode | Tissue | Histology | Sex | Age | Stage | Therapy Types | Drugs | Outcome |
| MAP1LC3B | insertion | Frame_Shift_Ins | novel | c.314_315insAG | p.Asp106GlufsTer17 | p.D106Efs*17 | Q9GZQ8 | protein_coding | TCGA-EA-A44S-01 | Cervix | cervical & endocervical cancer | Female | <65 | III/IV | Chemotherapy | carboplatin | SD | ||
| MAP1LC3B | SNV | Missense_Mutation | c.116A>G | p.Lys39Arg | p.K39R | Q9GZQ8 | protein_coding | tolerated(0.24) | benign(0.265) | TCGA-AZ-6598-01 | Colorectum | colon adenocarcinoma | Female | >=65 | I/II | Unknown | Unknown | SD | |
| MAP1LC3B | SNV | Missense_Mutation | rs775971070 | c.110N>A | p.Arg37Gln | p.R37Q | Q9GZQ8 | protein_coding | deleterious(0) | probably_damaging(0.965) | TCGA-AX-A1CE-01 | Endometrium | uterine corpus endometrioid carcinoma | Female | <65 | I/II | Unspecific | Paclitaxel | SD |
| MAP1LC3B | SNV | Missense_Mutation | novel | c.208N>T | p.Arg70Cys | p.R70C | Q9GZQ8 | protein_coding | deleterious(0.05) | benign(0.164) | TCGA-AX-A2HD-01 | Endometrium | uterine corpus endometrioid carcinoma | Female | >=65 | III/IV | Unknown | Unknown | SD |
| MAP1LC3B | SNV | Missense_Mutation | c.62G>A | p.Arg21Gln | p.R21Q | Q9GZQ8 | protein_coding | tolerated(0.6) | benign(0.011) | TCGA-BS-A0UV-01 | Endometrium | uterine corpus endometrioid carcinoma | Female | <65 | III/IV | Unknown | Unknown | SD | |
| MAP1LC3B | SNV | Missense_Mutation | c.112T>C | p.Tyr38His | p.Y38H | Q9GZQ8 | protein_coding | deleterious(0) | probably_damaging(0.996) | TCGA-D1-A103-01 | Endometrium | uterine corpus endometrioid carcinoma | Female | >=65 | I/II | Unknown | Unknown | SD | |
| MAP1LC3B | SNV | Missense_Mutation | novel | c.128N>G | p.Gln43Arg | p.Q43R | Q9GZQ8 | protein_coding | tolerated(0.29) | possibly_damaging(0.798) | TCGA-D1-A175-01 | Endometrium | uterine corpus endometrioid carcinoma | Female | <65 | I/II | Chemotherapy | paclitaxel | SD |
| MAP1LC3B | SNV | Missense_Mutation | rs775971070 | c.110G>A | p.Arg37Gln | p.R37Q | Q9GZQ8 | protein_coding | deleterious(0) | probably_damaging(0.965) | TCGA-44-A47A-01 | Lung | lung adenocarcinoma | Female | >=65 | I/II | Unknown | Unknown | PD |
| MAP1LC3B | insertion | Nonsense_Mutation | novel | c.367_368insATTGACAACAA | p.Leu123TyrfsTer2 | p.L123Yfs*2 | Q9GZQ8 | protein_coding | TCGA-86-8669-01 | Lung | lung adenocarcinoma | Male | <65 | I/II | Chemotherapy | cisplatin | CR | ||
| MAP1LC3B | SNV | Missense_Mutation | novel | c.166N>A | p.Asp56Asn | p.D56N | Q9GZQ8 | protein_coding | tolerated(0.08) | probably_damaging(1) | TCGA-VQ-A8P2-01 | Stomach | stomach adenocarcinoma | Male | >=65 | III/IV | Unspecific | Complete Response |
| Page: 1 2 |
Top |
Related drugs of malignant transformation related genes |
| Identification of chemicals and drugs interact with genes involved in malignant transfromation |
| (DGIdb 4.0) |
| Entrez ID | Symbol | Category | Interaction Types | Drug Claim Name | Drug Name | PMIDs |
| Page: 1 |

Copyright 2023-Present -The University of Texas Health Science Center at Houston |