| Tissue | Expression Dynamics | Abbreviation |
| Endometrium | 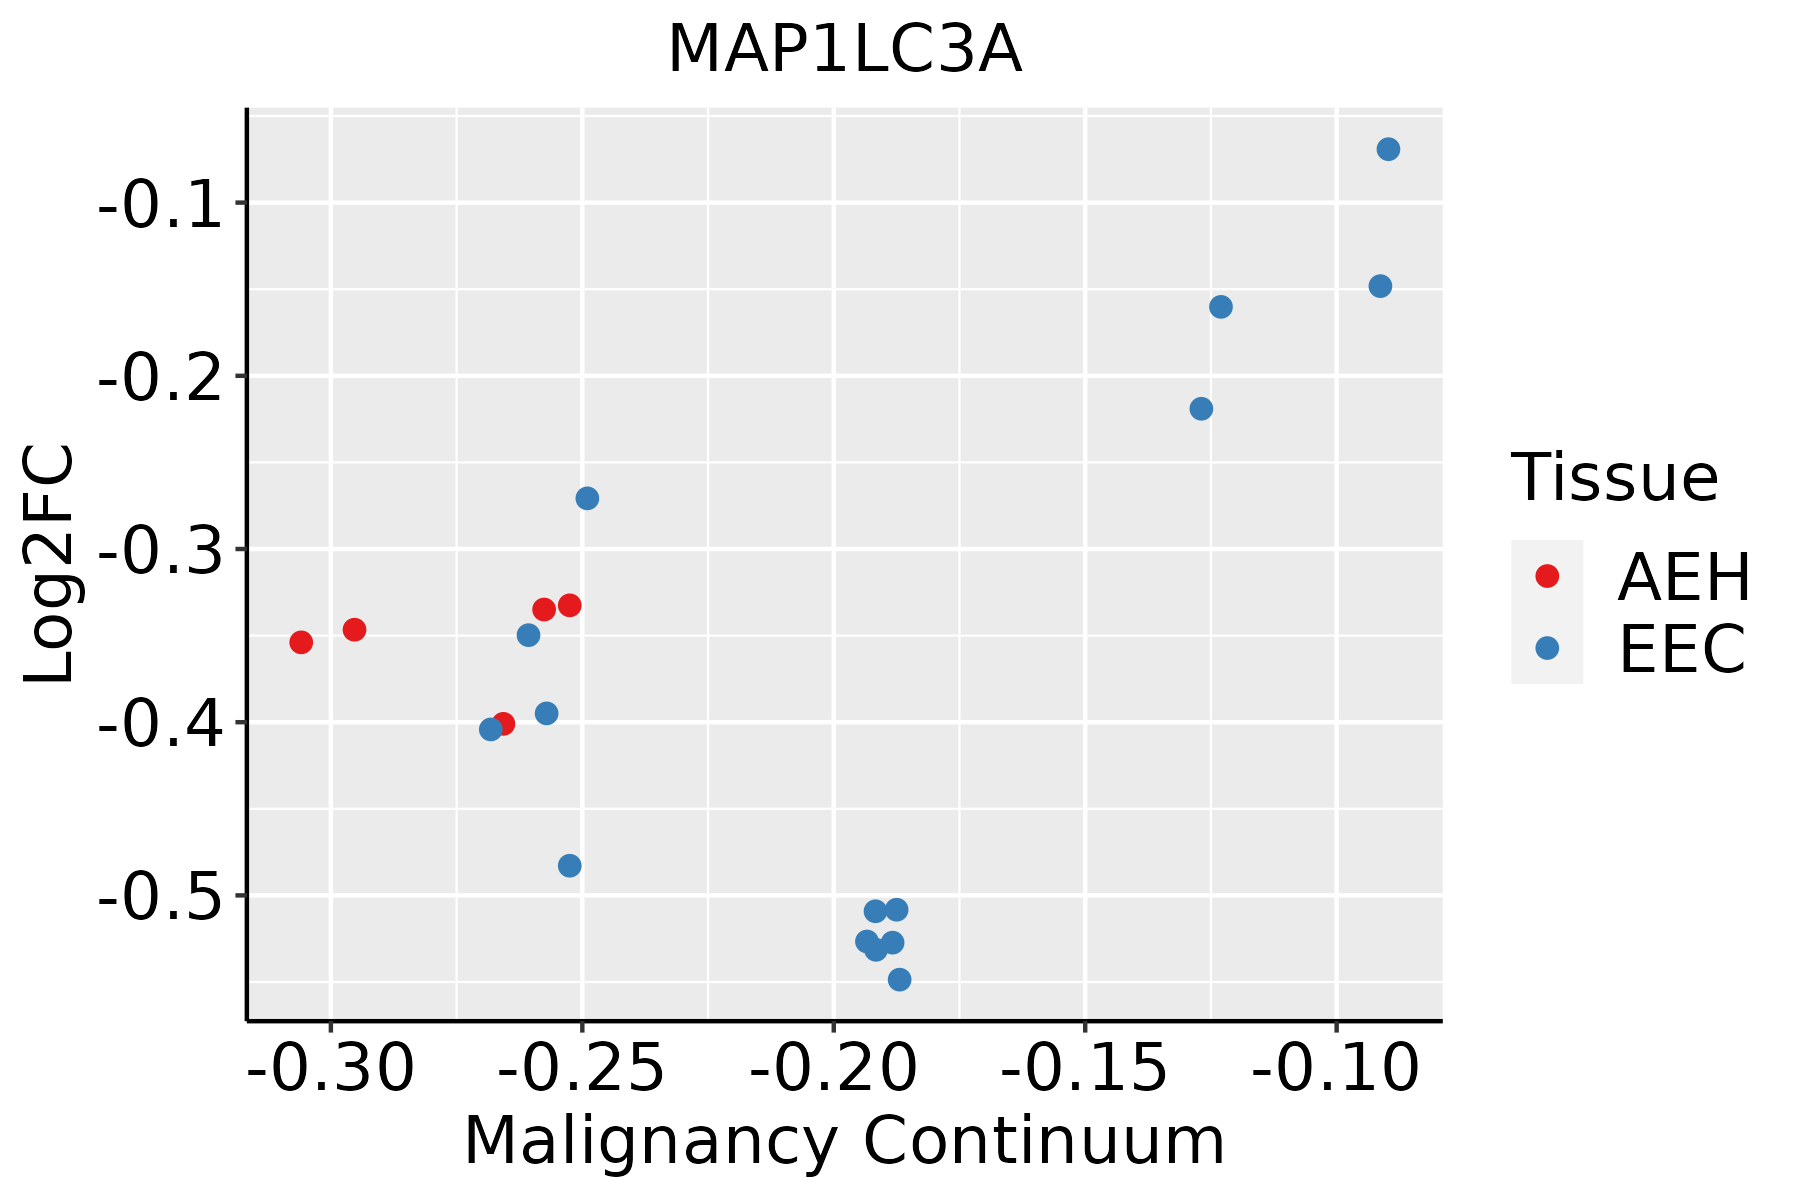 | AEH: Atypical endometrial hyperplasia |
| EEC: Endometrioid Cancer |
| Esophagus | 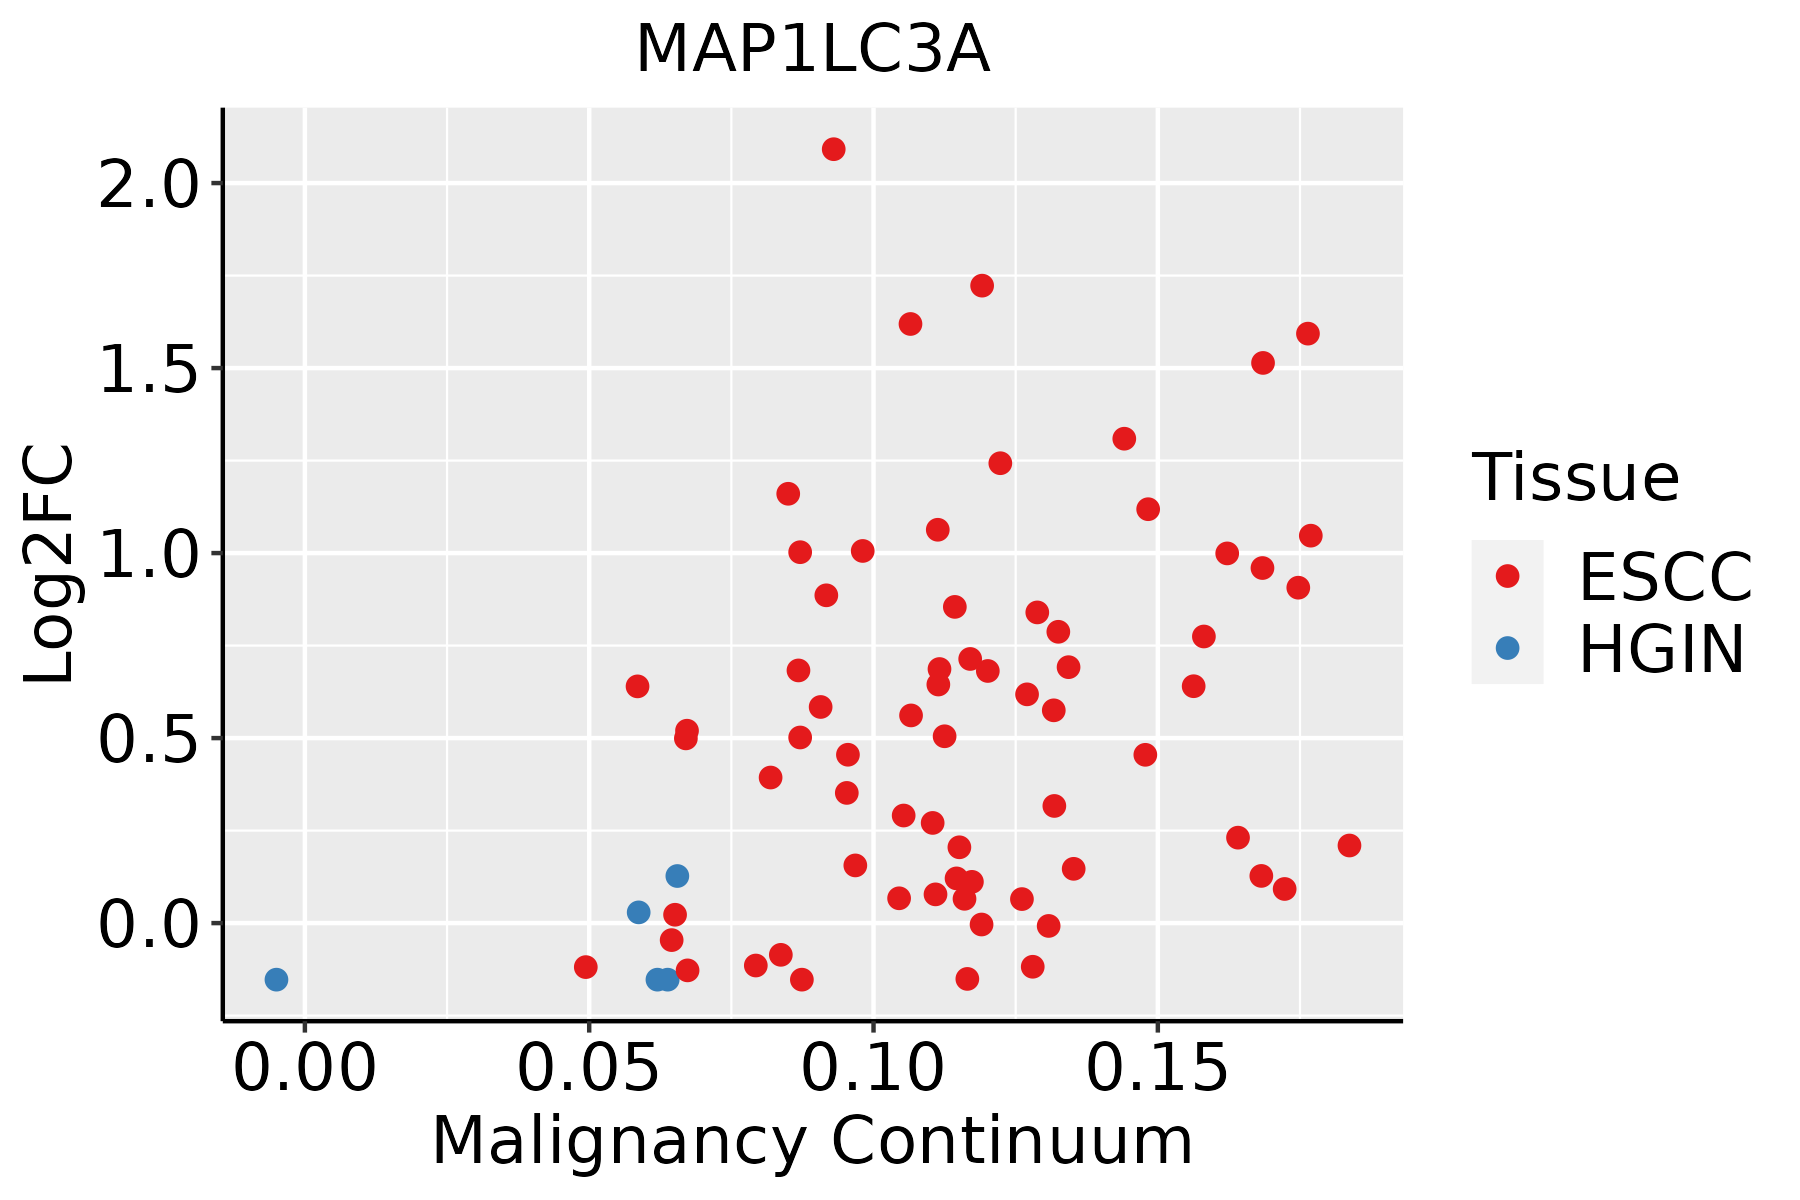 | ESCC: Esophageal squamous cell carcinoma |
| HGIN: High-grade intraepithelial neoplasias |
| LGIN: Low-grade intraepithelial neoplasias |
| Liver | 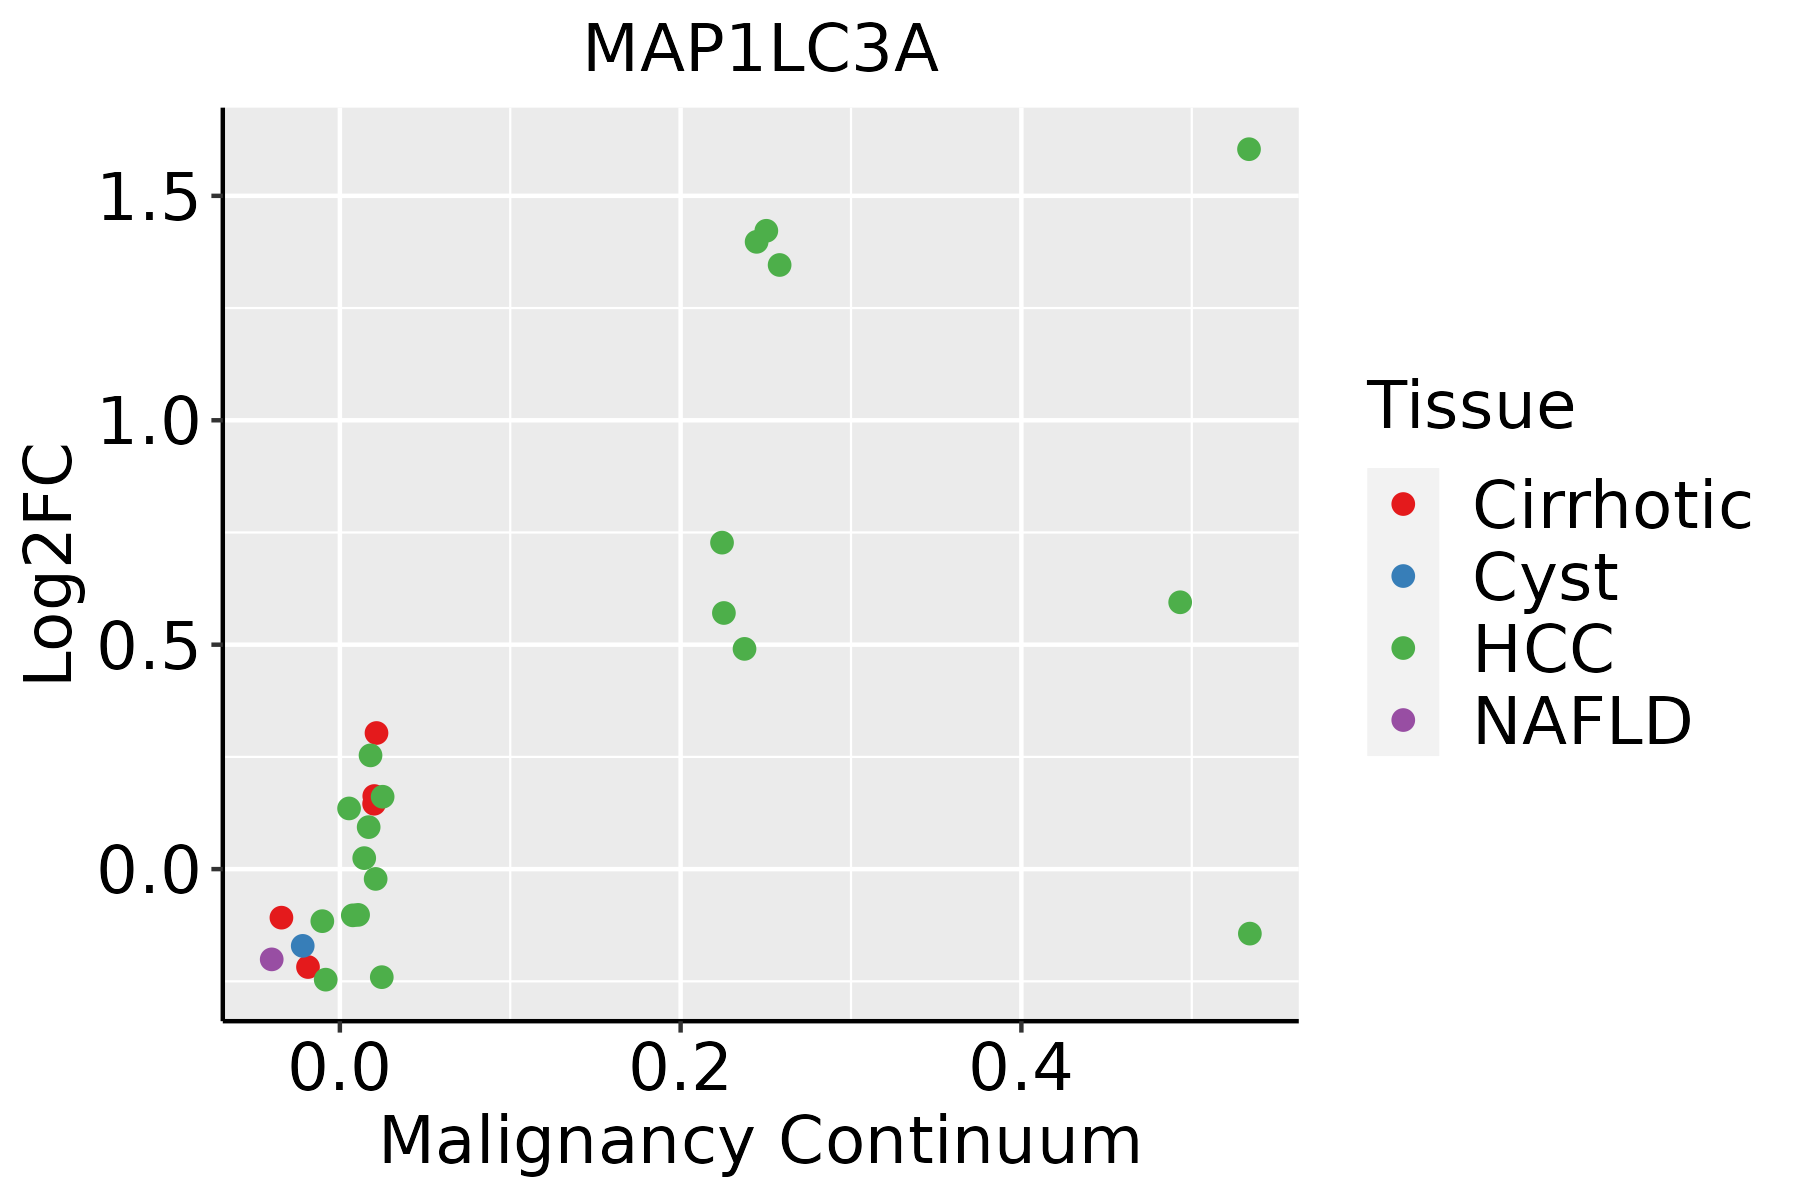 | HCC: Hepatocellular carcinoma |
| NAFLD: Non-alcoholic fatty liver disease |
| Oral Cavity | 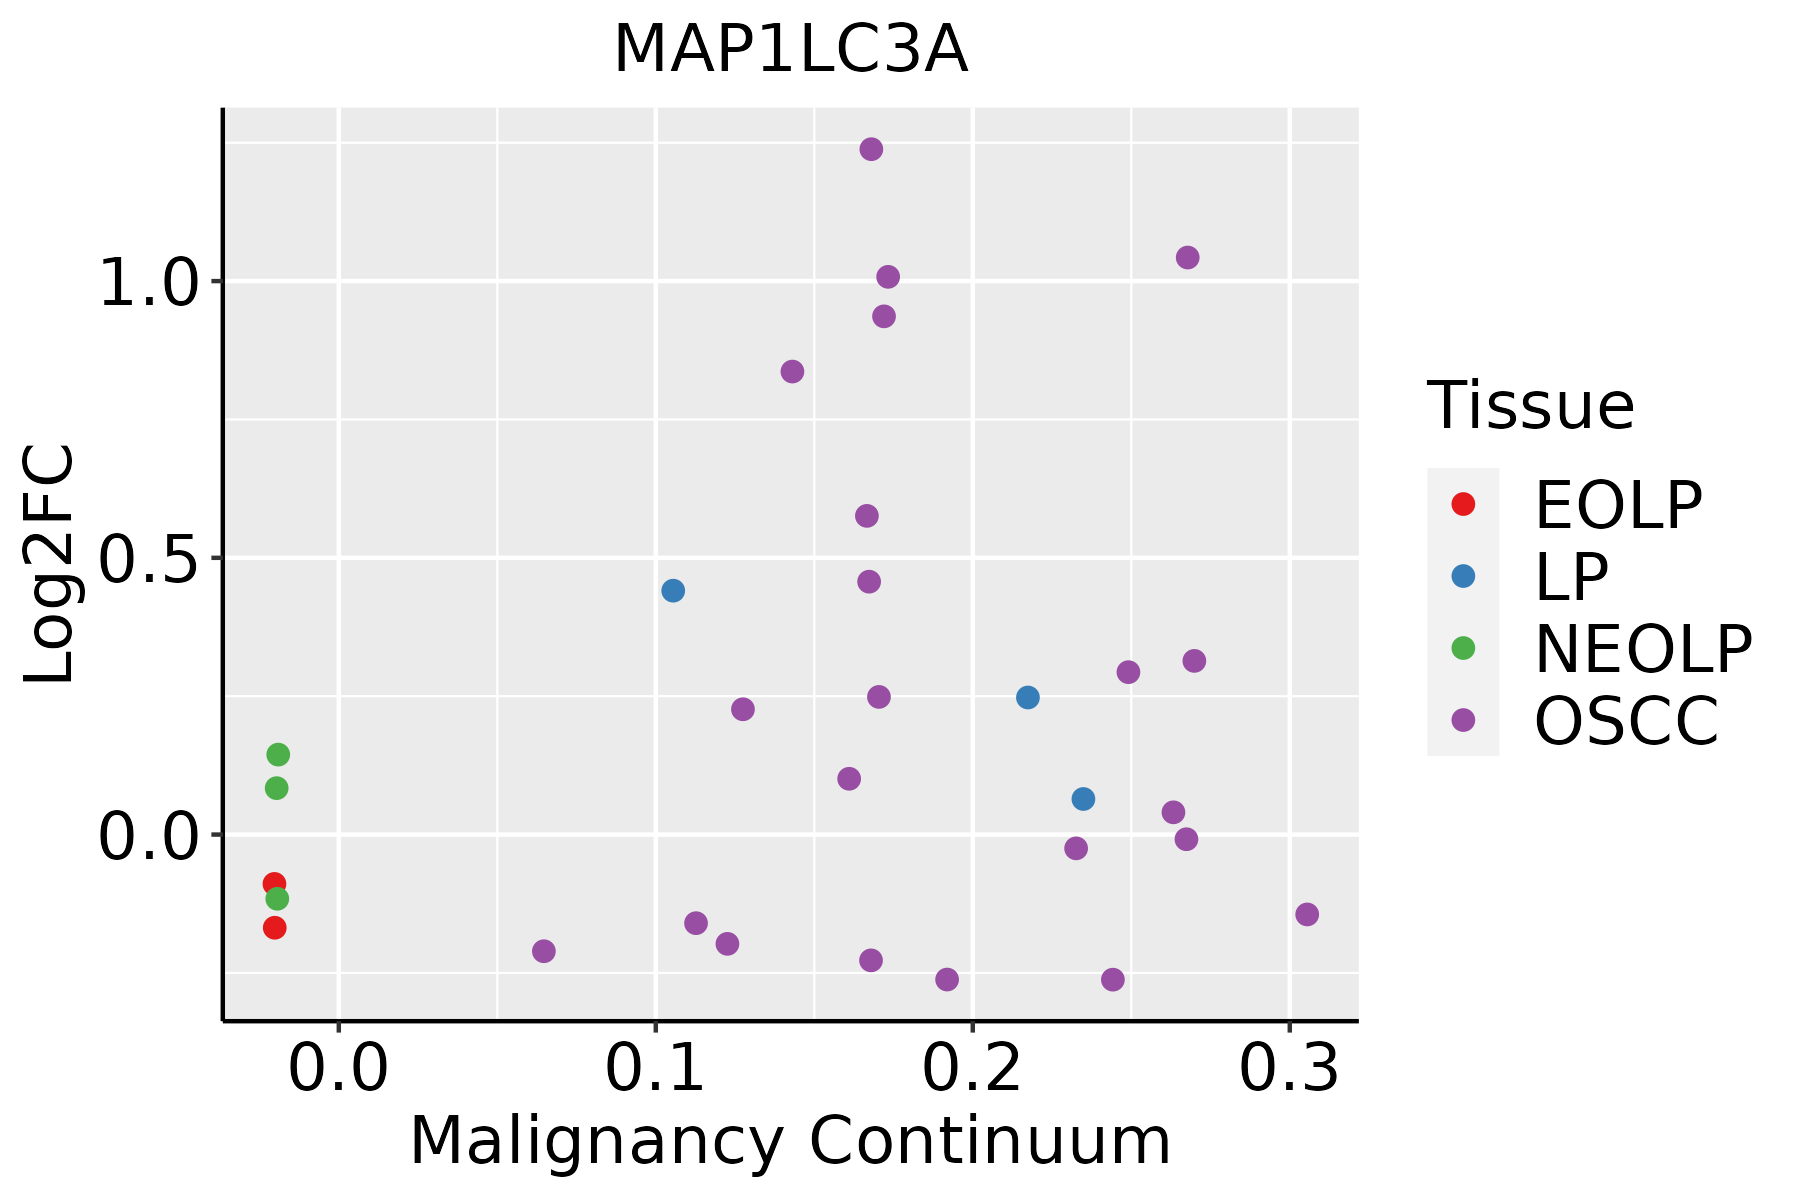 | EOLP: Erosive Oral lichen planus |
| LP: leukoplakia |
| NEOLP: Non-erosive oral lichen planus |
| OSCC: Oral squamous cell carcinoma |
| Prostate | 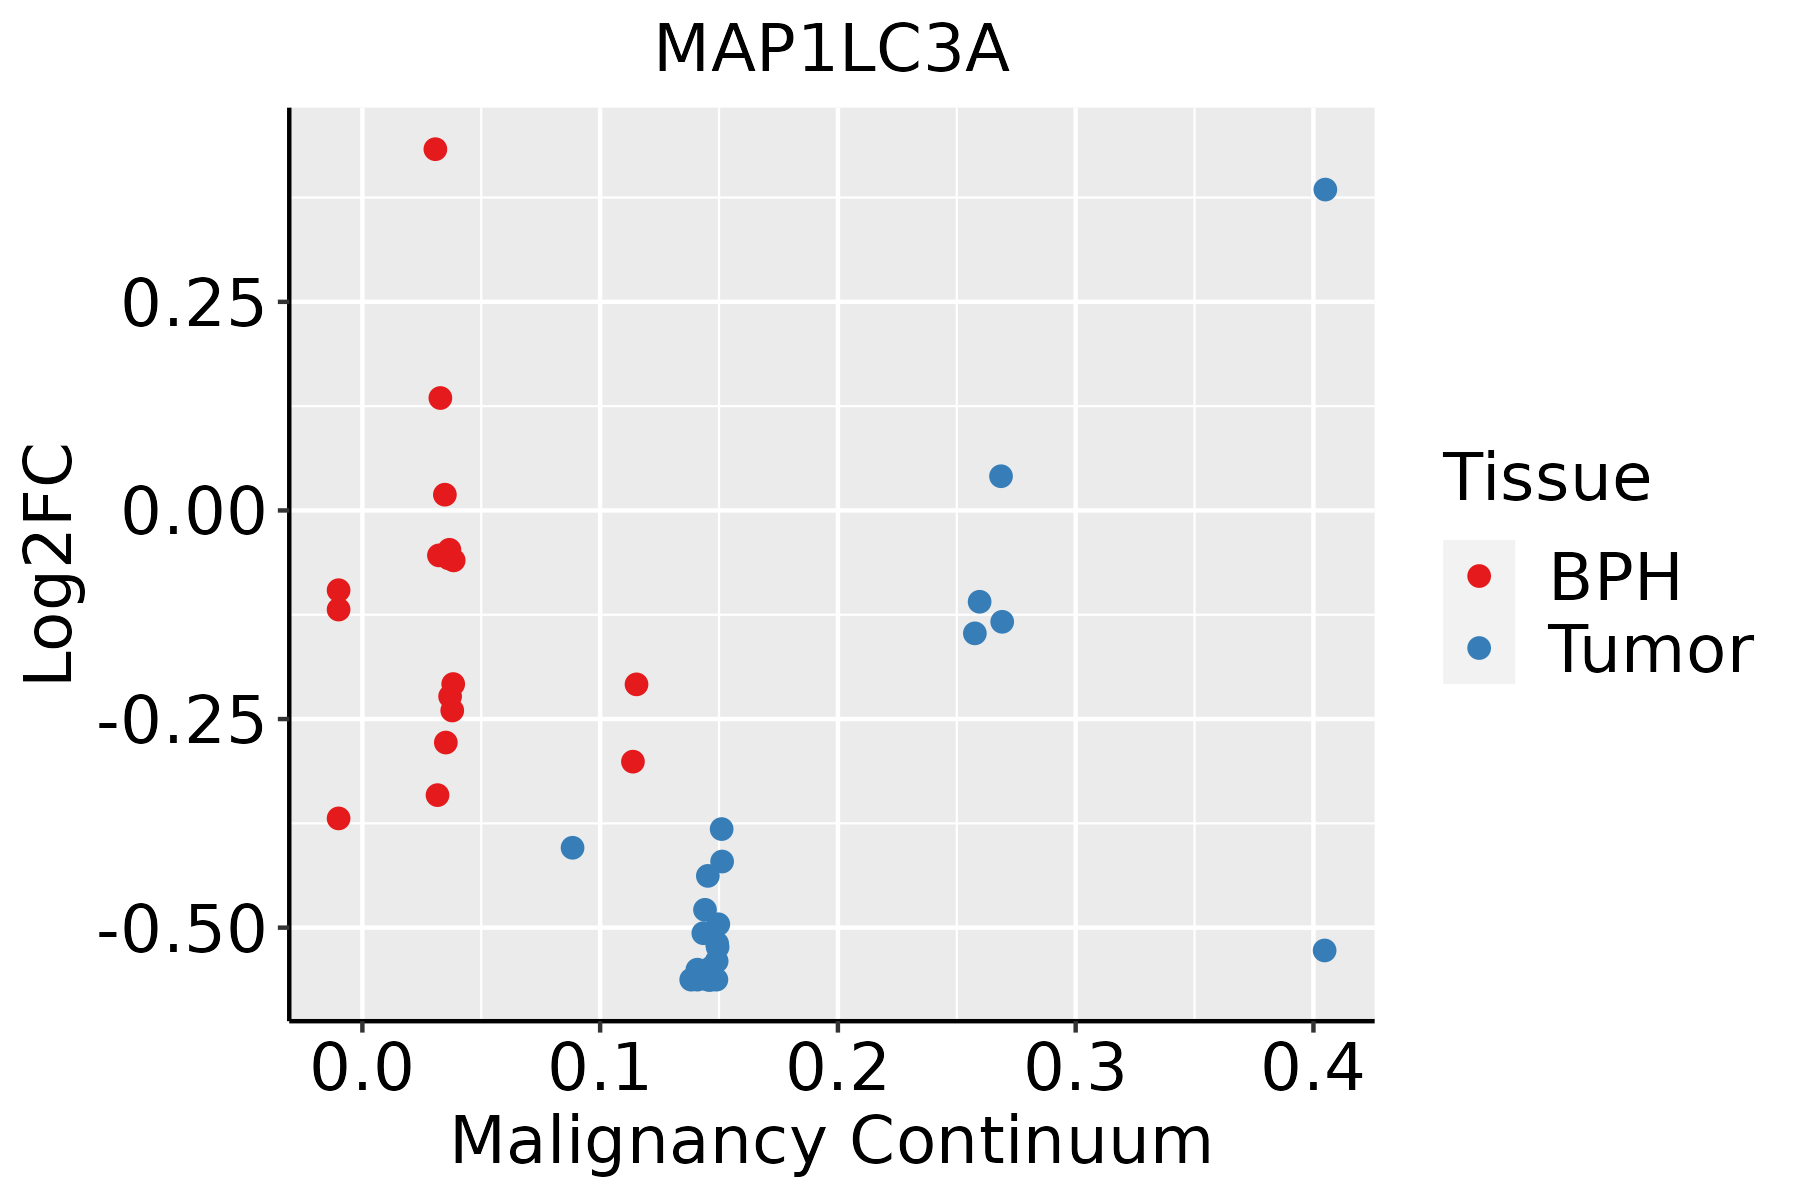 | BPH: Benign Prostatic Hyperplasia |
| Thyroid | 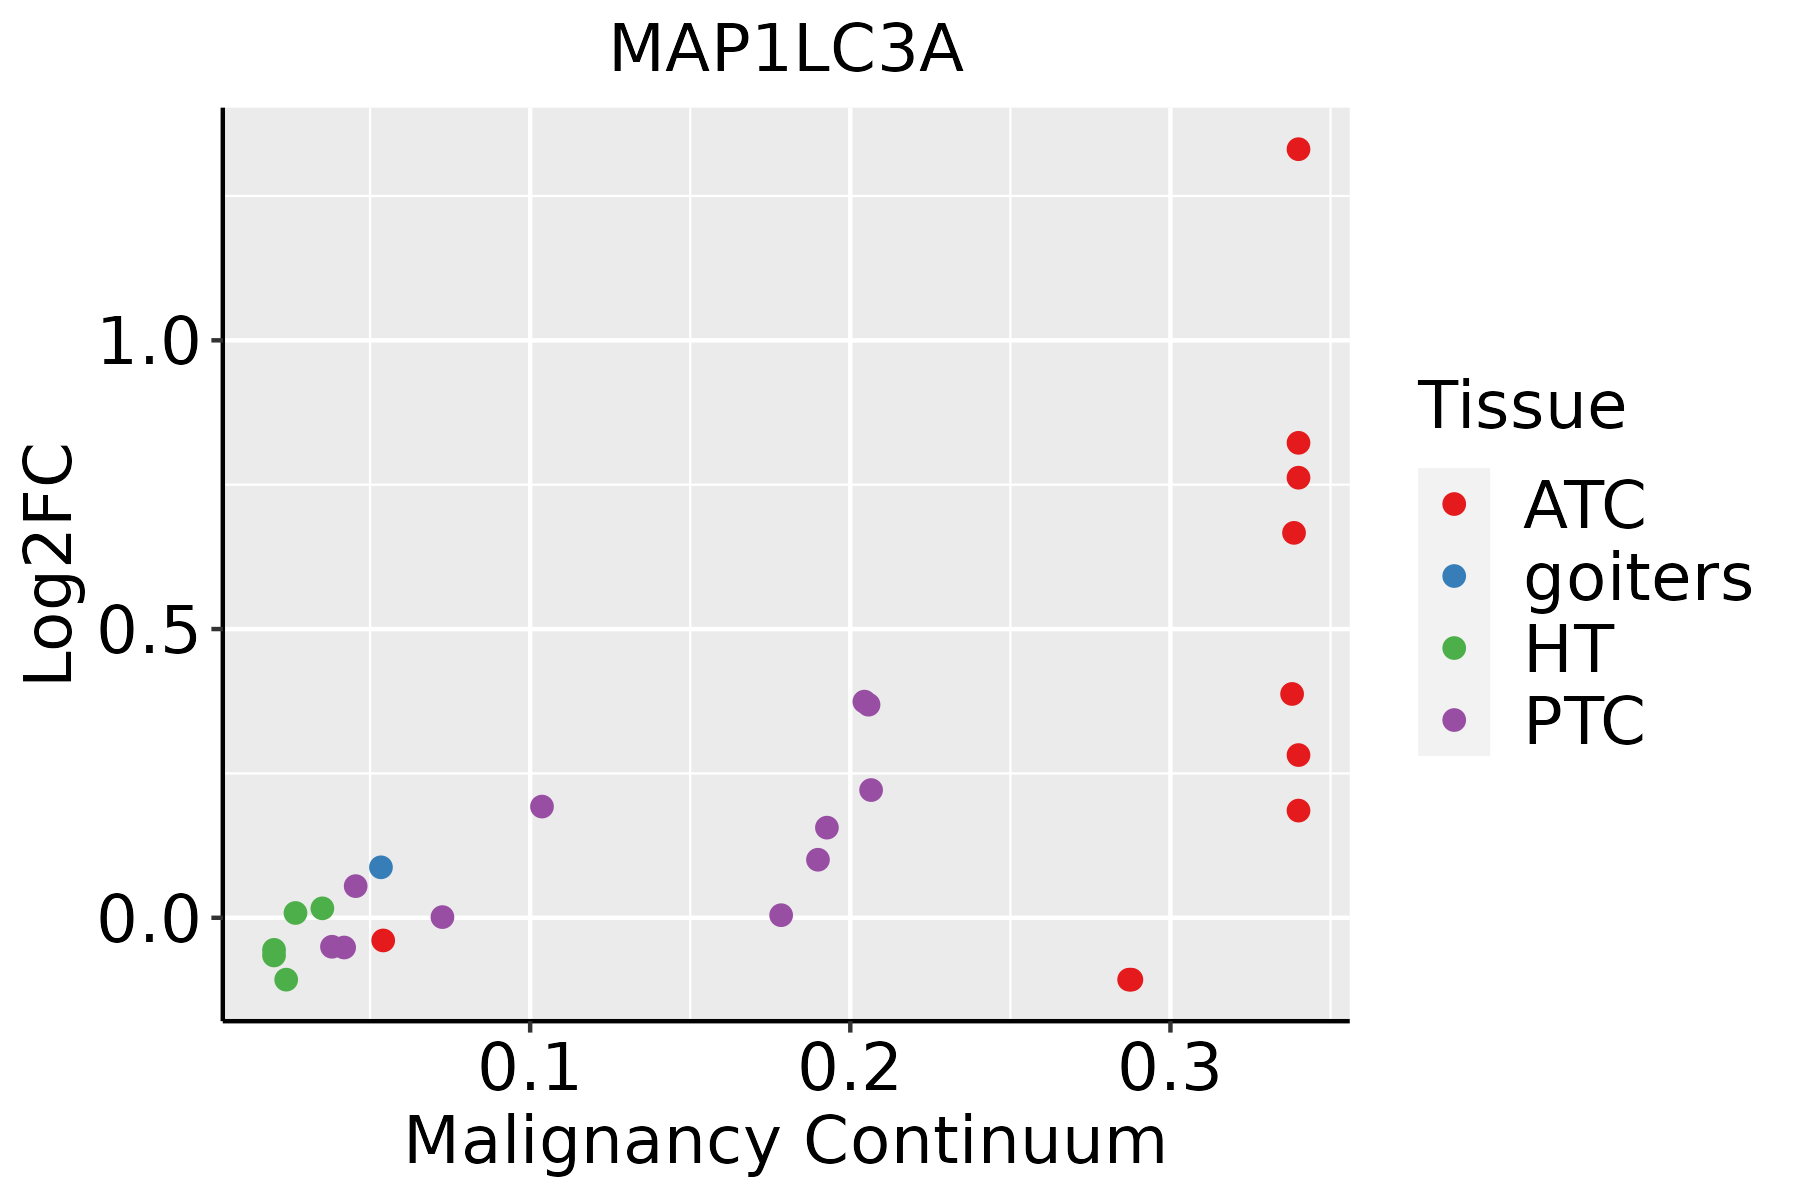 | ATC: Anaplastic thyroid cancer |
| HT: Hashimoto's thyroiditis |
| PTC: Papillary thyroid cancer |
| GO ID | Tissue | Disease Stage | Description | Gene Ratio | Bg Ratio | pvalue | p.adjust | Count |
| GO:000697916 | Endometrium | AEH | response to oxidative stress | 93/2100 | 446/18723 | 1.94e-09 | 1.64e-07 | 93 |
| GO:000030216 | Endometrium | AEH | response to reactive oxygen species | 54/2100 | 222/18723 | 2.54e-08 | 1.49e-06 | 54 |
| GO:006219716 | Endometrium | AEH | cellular response to chemical stress | 71/2100 | 337/18723 | 1.03e-07 | 5.05e-06 | 71 |
| GO:004254215 | Endometrium | AEH | response to hydrogen peroxide | 38/2100 | 146/18723 | 4.70e-07 | 1.92e-05 | 38 |
| GO:00004228 | Endometrium | AEH | autophagy of mitochondrion | 24/2100 | 81/18723 | 5.41e-06 | 1.36e-04 | 24 |
| GO:00617268 | Endometrium | AEH | mitochondrion disassembly | 24/2100 | 81/18723 | 5.41e-06 | 1.36e-04 | 24 |
| GO:003459916 | Endometrium | AEH | cellular response to oxidative stress | 58/2100 | 288/18723 | 6.49e-06 | 1.58e-04 | 58 |
| GO:002241115 | Endometrium | AEH | cellular component disassembly | 80/2100 | 443/18723 | 1.07e-05 | 2.45e-04 | 80 |
| GO:19030086 | Endometrium | AEH | organelle disassembly | 29/2100 | 114/18723 | 1.66e-05 | 3.43e-04 | 29 |
| GO:00329848 | Endometrium | AEH | protein-containing complex disassembly | 45/2100 | 224/18723 | 7.16e-05 | 1.10e-03 | 45 |
| GO:003461415 | Endometrium | AEH | cellular response to reactive oxygen species | 34/2100 | 155/18723 | 9.00e-05 | 1.30e-03 | 34 |
| GO:001003816 | Endometrium | AEH | response to metal ion | 65/2100 | 373/18723 | 2.02e-04 | 2.54e-03 | 65 |
| GO:007149616 | Endometrium | AEH | cellular response to external stimulus | 57/2100 | 320/18723 | 2.72e-04 | 3.14e-03 | 57 |
| GO:003166716 | Endometrium | AEH | response to nutrient levels | 78/2100 | 474/18723 | 3.26e-04 | 3.64e-03 | 78 |
| GO:00162368 | Endometrium | AEH | macroautophagy | 52/2100 | 291/18723 | 4.56e-04 | 4.80e-03 | 52 |
| GO:00092679 | Endometrium | AEH | cellular response to starvation | 31/2100 | 156/18723 | 1.08e-03 | 9.46e-03 | 31 |
| GO:00316699 | Endometrium | AEH | cellular response to nutrient levels | 39/2100 | 215/18723 | 1.66e-03 | 1.36e-02 | 39 |
| GO:003166810 | Endometrium | AEH | cellular response to extracellular stimulus | 43/2100 | 246/18723 | 2.10e-03 | 1.63e-02 | 43 |
| GO:00425949 | Endometrium | AEH | response to starvation | 36/2100 | 197/18723 | 2.15e-03 | 1.65e-02 | 36 |
| GO:00703015 | Endometrium | AEH | cellular response to hydrogen peroxide | 20/2100 | 98/18723 | 5.64e-03 | 3.46e-02 | 20 |
| Pathway ID | Tissue | Disease Stage | Description | Gene Ratio | Bg Ratio | pvalue | p.adjust | qvalue | Count |
| hsa0501420 | Endometrium | AEH | Amyotrophic lateral sclerosis | 123/1197 | 364/8465 | 2.17e-22 | 7.82e-21 | 5.72e-21 | 123 |
| hsa0502220 | Endometrium | AEH | Pathways of neurodegeneration - multiple diseases | 137/1197 | 476/8465 | 9.27e-18 | 2.32e-16 | 1.70e-16 | 137 |
| hsa0513126 | Endometrium | AEH | Shigellosis | 78/1197 | 247/8465 | 9.23e-13 | 2.00e-11 | 1.46e-11 | 78 |
| hsa0421616 | Endometrium | AEH | Ferroptosis | 15/1197 | 41/8465 | 2.83e-04 | 2.30e-03 | 1.68e-03 | 15 |
| hsa0413720 | Endometrium | AEH | Mitophagy - animal | 21/1197 | 72/8465 | 7.03e-04 | 4.86e-03 | 3.56e-03 | 21 |
| hsa0516725 | Endometrium | AEH | Kaposi sarcoma-associated herpesvirus infection | 44/1197 | 194/8465 | 7.97e-04 | 5.28e-03 | 3.87e-03 | 44 |
| hsa05014110 | Endometrium | AEH | Amyotrophic lateral sclerosis | 123/1197 | 364/8465 | 2.17e-22 | 7.82e-21 | 5.72e-21 | 123 |
| hsa05022110 | Endometrium | AEH | Pathways of neurodegeneration - multiple diseases | 137/1197 | 476/8465 | 9.27e-18 | 2.32e-16 | 1.70e-16 | 137 |
| hsa05131111 | Endometrium | AEH | Shigellosis | 78/1197 | 247/8465 | 9.23e-13 | 2.00e-11 | 1.46e-11 | 78 |
| hsa0421617 | Endometrium | AEH | Ferroptosis | 15/1197 | 41/8465 | 2.83e-04 | 2.30e-03 | 1.68e-03 | 15 |
| hsa04137110 | Endometrium | AEH | Mitophagy - animal | 21/1197 | 72/8465 | 7.03e-04 | 4.86e-03 | 3.56e-03 | 21 |
| hsa05167111 | Endometrium | AEH | Kaposi sarcoma-associated herpesvirus infection | 44/1197 | 194/8465 | 7.97e-04 | 5.28e-03 | 3.87e-03 | 44 |
| hsa0501425 | Endometrium | EEC | Amyotrophic lateral sclerosis | 128/1237 | 364/8465 | 9.83e-24 | 4.04e-22 | 3.01e-22 | 128 |
| hsa0502225 | Endometrium | EEC | Pathways of neurodegeneration - multiple diseases | 140/1237 | 476/8465 | 9.49e-18 | 2.60e-16 | 1.94e-16 | 140 |
| hsa0513127 | Endometrium | EEC | Shigellosis | 79/1237 | 247/8465 | 1.80e-12 | 3.95e-11 | 2.95e-11 | 79 |
| hsa0421625 | Endometrium | EEC | Ferroptosis | 16/1237 | 41/8465 | 1.09e-04 | 1.08e-03 | 8.08e-04 | 16 |
| hsa0413725 | Endometrium | EEC | Mitophagy - animal | 22/1237 | 72/8465 | 4.12e-04 | 3.30e-03 | 2.46e-03 | 22 |
| hsa0516726 | Endometrium | EEC | Kaposi sarcoma-associated herpesvirus infection | 45/1237 | 194/8465 | 8.55e-04 | 5.86e-03 | 4.37e-03 | 45 |
| hsa0501435 | Endometrium | EEC | Amyotrophic lateral sclerosis | 128/1237 | 364/8465 | 9.83e-24 | 4.04e-22 | 3.01e-22 | 128 |
| hsa0502235 | Endometrium | EEC | Pathways of neurodegeneration - multiple diseases | 140/1237 | 476/8465 | 9.49e-18 | 2.60e-16 | 1.94e-16 | 140 |
| Hugo Symbol | Variant Class | Variant Classification | dbSNP RS | HGVSc | HGVSp | HGVSp Short | SWISSPROT | BIOTYPE | SIFT | PolyPhen | Tumor Sample Barcode | Tissue | Histology | Sex | Age | Stage | Therapy Types | Drugs | Outcome |
| MAP1LC3A | SNV | Missense_Mutation | | c.218N>A | p.Arg73His | p.R73H | Q9H492 | protein_coding | deleterious(0.01) | probably_damaging(0.927) | TCGA-DR-A0ZM-01 | Cervix | cervical & endocervical cancer | Female | <65 | III/IV | Unspecific | Cisplatin | SD |
| MAP1LC3A | SNV | Missense_Mutation | novel | c.9N>A | p.Met3Ile | p.M3I | Q9H492 | protein_coding | tolerated_low_confidence(0.34) | benign(0) | TCGA-FU-A40J-01 | Cervix | cervical & endocervical cancer | Female | <65 | III/IV | Chemotherapy | carboplatin | CR |
| MAP1LC3A | SNV | Missense_Mutation | | c.218N>A | p.Arg73His | p.R73H | Q9H492 | protein_coding | deleterious(0.01) | probably_damaging(0.927) | TCGA-MA-AA41-01 | Cervix | cervical & endocervical cancer | Female | <65 | I/II | Unknown | Unknown | SD |
| MAP1LC3A | SNV | Missense_Mutation | | c.118N>A | p.Glu40Lys | p.E40K | Q9H492 | protein_coding | deleterious(0.02) | probably_damaging(0.999) | TCGA-CA-6718-01 | Colorectum | colon adenocarcinoma | Male | <65 | I/II | Unknown | Unknown | PD |
| MAP1LC3A | SNV | Missense_Mutation | | c.239N>T | p.Thr80Met | p.T80M | Q9H492 | protein_coding | deleterious(0) | possibly_damaging(0.689) | TCGA-CK-4947-01 | Colorectum | colon adenocarcinoma | Female | <65 | III/IV | Other, specify in notes | folinic | SD |
| MAP1LC3A | SNV | Missense_Mutation | rs753652508 | c.299N>T | p.Ala100Val | p.A100V | Q9H492 | protein_coding | deleterious(0.02) | benign(0.044) | TCGA-CK-5914-01 | Colorectum | colon adenocarcinoma | Male | >=65 | III/IV | Unknown | Unknown | SD |
| MAP1LC3A | SNV | Missense_Mutation | | c.196N>A | p.Glu66Lys | p.E66K | Q9H492 | protein_coding | tolerated(0.07) | probably_damaging(0.973) | TCGA-A5-A0G2-01 | Endometrium | uterine corpus endometrioid carcinoma | Female | <65 | III/IV | Unknown | Unknown | SD |
| MAP1LC3A | SNV | Missense_Mutation | novel | c.23N>A | p.Ser8Tyr | p.S8Y | Q9H492 | protein_coding | tolerated_low_confidence(0.06) | benign(0.001) | TCGA-AP-A0LM-01 | Endometrium | uterine corpus endometrioid carcinoma | Female | <65 | III/IV | Chemotherapy | cisplatin | SD |
| MAP1LC3A | SNV | Missense_Mutation | novel | c.367T>C | p.Phe123Leu | p.F123L | Q9H492 | protein_coding | tolerated(0.05) | possibly_damaging(0.631) | TCGA-AX-A1C4-01 | Endometrium | uterine corpus endometrioid carcinoma | Female | <65 | I/II | Unknown | Unknown | SD |
| MAP1LC3A | SNV | Missense_Mutation | novel | c.371G>A | p.Gly124Asp | p.G124D | Q9H492 | protein_coding | deleterious(0) | probably_damaging(1) | TCGA-AX-A1CE-01 | Endometrium | uterine corpus endometrioid carcinoma | Female | <65 | I/II | Unspecific | Paclitaxel | SD |


