
|
|||||
|
 | |
| |
| |
| |
| |
| |
|
Gene: MAP1B |
Gene summary for MAP1B |
| Gene information | Species | Human | Gene symbol | MAP1B | Gene ID | 4131 |
| Gene name | microtubule associated protein 1B | |
| Gene Alias | FUTSCH | |
| Cytomap | 5q13.2 | |
| Gene Type | protein-coding | GO ID | GO:0000226 | UniProtAcc | A2BDK6 |
Top |
Malignant transformation analysis |
| Identification of the aberrant gene expression in precancerous and cancerous lesions by comparing the gene expression of stem-like cells in diseased tissues with normal stem cells |
| Entrez ID | Symbol | Replicates | Species | Organ | Tissue | Adj P-value | Log2FC | Malignancy |
| 4131 | MAP1B | AEH-subject2 | Human | Endometrium | AEH | 1.19e-04 | 1.89e-01 | -0.2525 |
| 4131 | MAP1B | EEC-subject2 | Human | Endometrium | EEC | 2.56e-05 | 3.23e-01 | -0.2607 |
| 4131 | MAP1B | GSM5276934 | Human | Endometrium | EEC | 2.53e-08 | 3.93e-01 | -0.0913 |
| 4131 | MAP1B | GSM5276937 | Human | Endometrium | EEC | 2.57e-20 | 6.81e-01 | -0.0897 |
| 4131 | MAP1B | GSM6177620_NYU_UCEC1_lib1_lib1 | Human | Endometrium | EEC | 1.29e-09 | -2.22e-01 | -0.1869 |
| 4131 | MAP1B | GSM6177620_NYU_UCEC1_lib2_lib2 | Human | Endometrium | EEC | 6.02e-07 | -2.21e-01 | -0.1875 |
| 4131 | MAP1B | GSM6177620_NYU_UCEC1_lib3_lib3 | Human | Endometrium | EEC | 8.54e-10 | -2.55e-01 | -0.1883 |
| 4131 | MAP1B | GSM6177621_NYU_UCEC2_lib1_lib1 | Human | Endometrium | EEC | 3.00e-11 | -1.67e-01 | -0.1934 |
| 4131 | MAP1B | GSM6177622_NYU_UCEC3_lib1_lib1 | Human | Endometrium | EEC | 1.60e-10 | -2.40e-01 | -0.1917 |
| 4131 | MAP1B | GSM6177622_NYU_UCEC3_lib2_lib2 | Human | Endometrium | EEC | 3.02e-15 | -2.70e-01 | -0.1916 |
| 4131 | MAP1B | GSM6177623_NYU_UCEC3_Vis | Human | Endometrium | EEC | 5.19e-03 | -2.10e-01 | -0.1269 |
| 4131 | MAP1B | LZE4T | Human | Esophagus | ESCC | 4.01e-41 | 1.66e+00 | 0.0811 |
| 4131 | MAP1B | LZE7T | Human | Esophagus | ESCC | 1.36e-23 | 1.80e+00 | 0.0667 |
| 4131 | MAP1B | LZE21T | Human | Esophagus | ESCC | 3.61e-11 | 7.30e-01 | 0.0655 |
| 4131 | MAP1B | P2T-E | Human | Esophagus | ESCC | 5.72e-19 | 6.71e-01 | 0.1177 |
| 4131 | MAP1B | P4T-E | Human | Esophagus | ESCC | 2.15e-19 | 9.00e-01 | 0.1323 |
| 4131 | MAP1B | P5T-E | Human | Esophagus | ESCC | 1.75e-13 | 5.28e-01 | 0.1327 |
| 4131 | MAP1B | P8T-E | Human | Esophagus | ESCC | 5.23e-03 | 1.84e-01 | 0.0889 |
| 4131 | MAP1B | P9T-E | Human | Esophagus | ESCC | 7.57e-36 | 1.10e+00 | 0.1131 |
| 4131 | MAP1B | P10T-E | Human | Esophagus | ESCC | 4.01e-12 | 2.73e-01 | 0.116 |
| Page: 1 2 3 4 5 6 |
| Tissue | Expression Dynamics | Abbreviation |
| Endometrium | 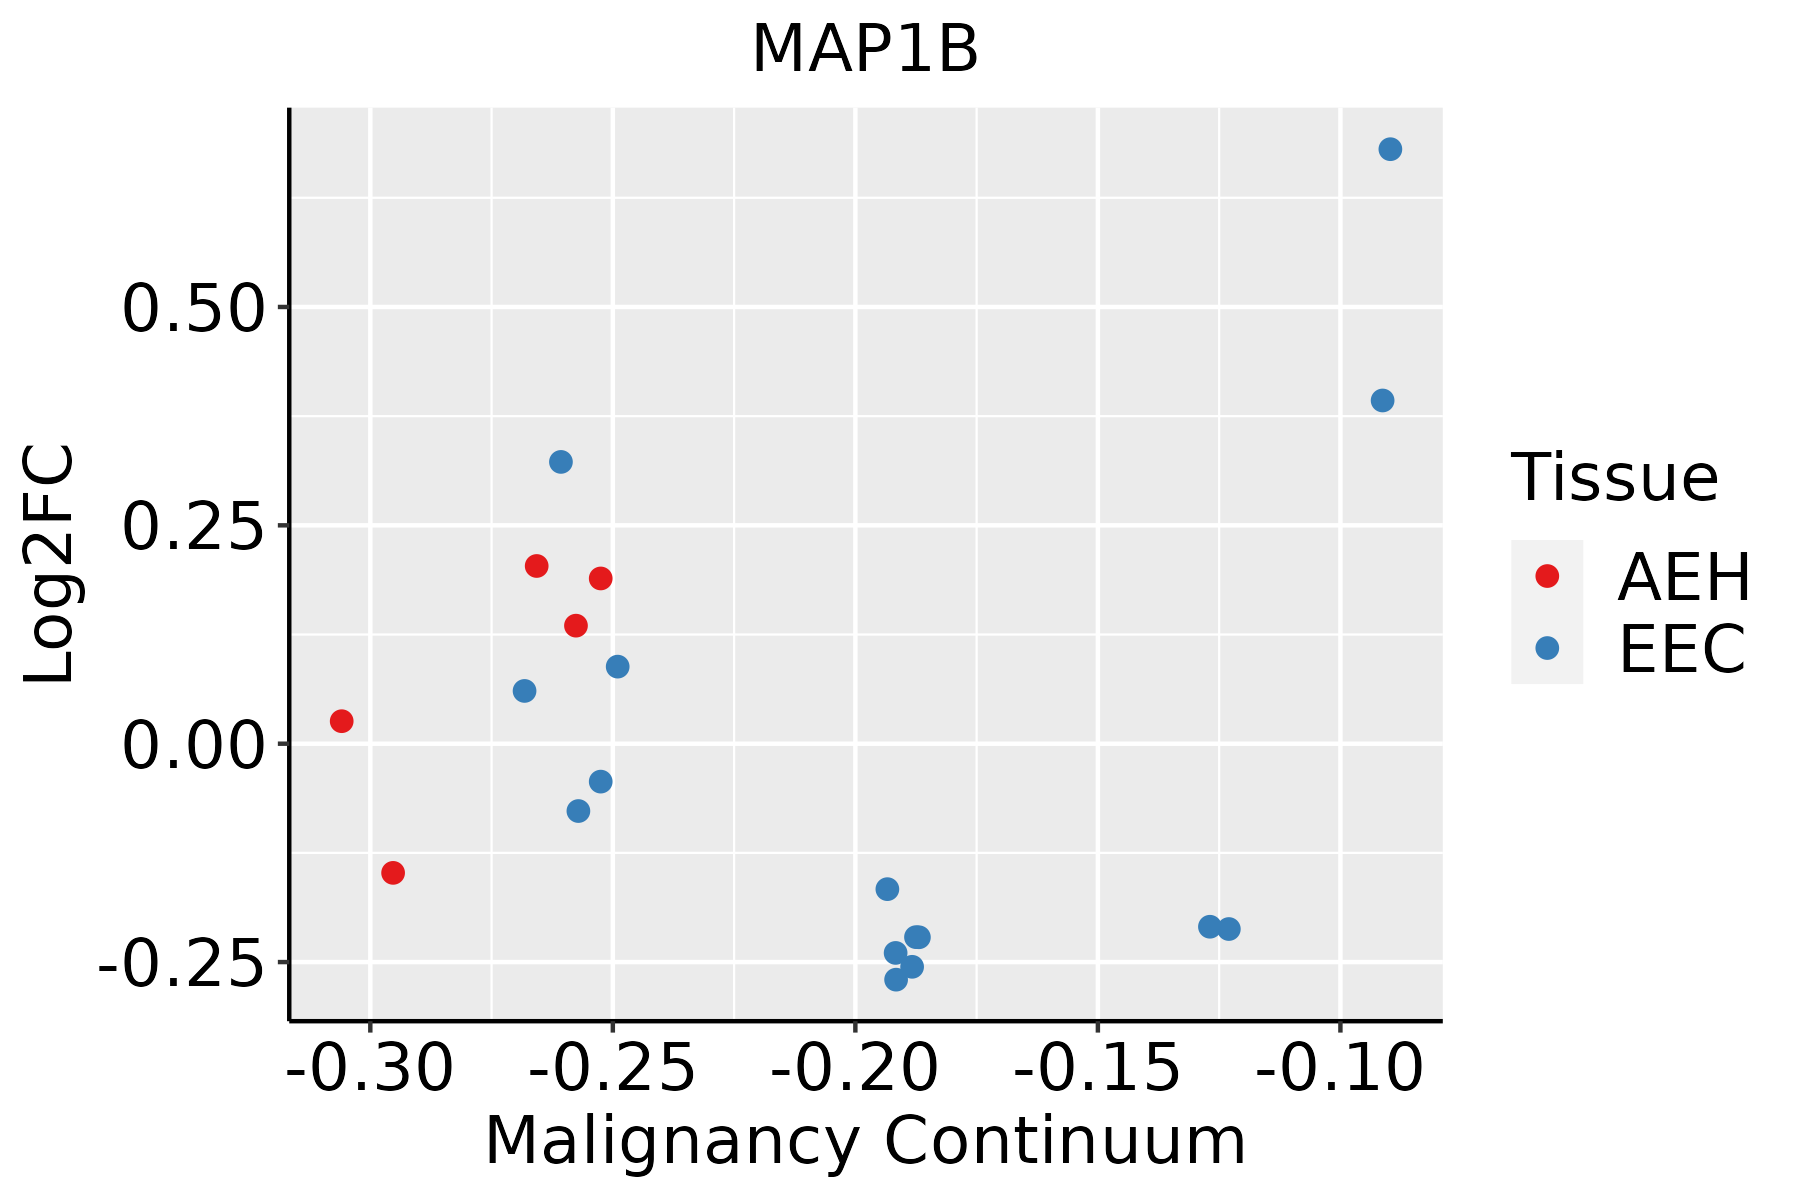 | AEH: Atypical endometrial hyperplasia |
| EEC: Endometrioid Cancer | ||
| Esophagus |  | ESCC: Esophageal squamous cell carcinoma |
| HGIN: High-grade intraepithelial neoplasias | ||
| LGIN: Low-grade intraepithelial neoplasias | ||
| Liver | 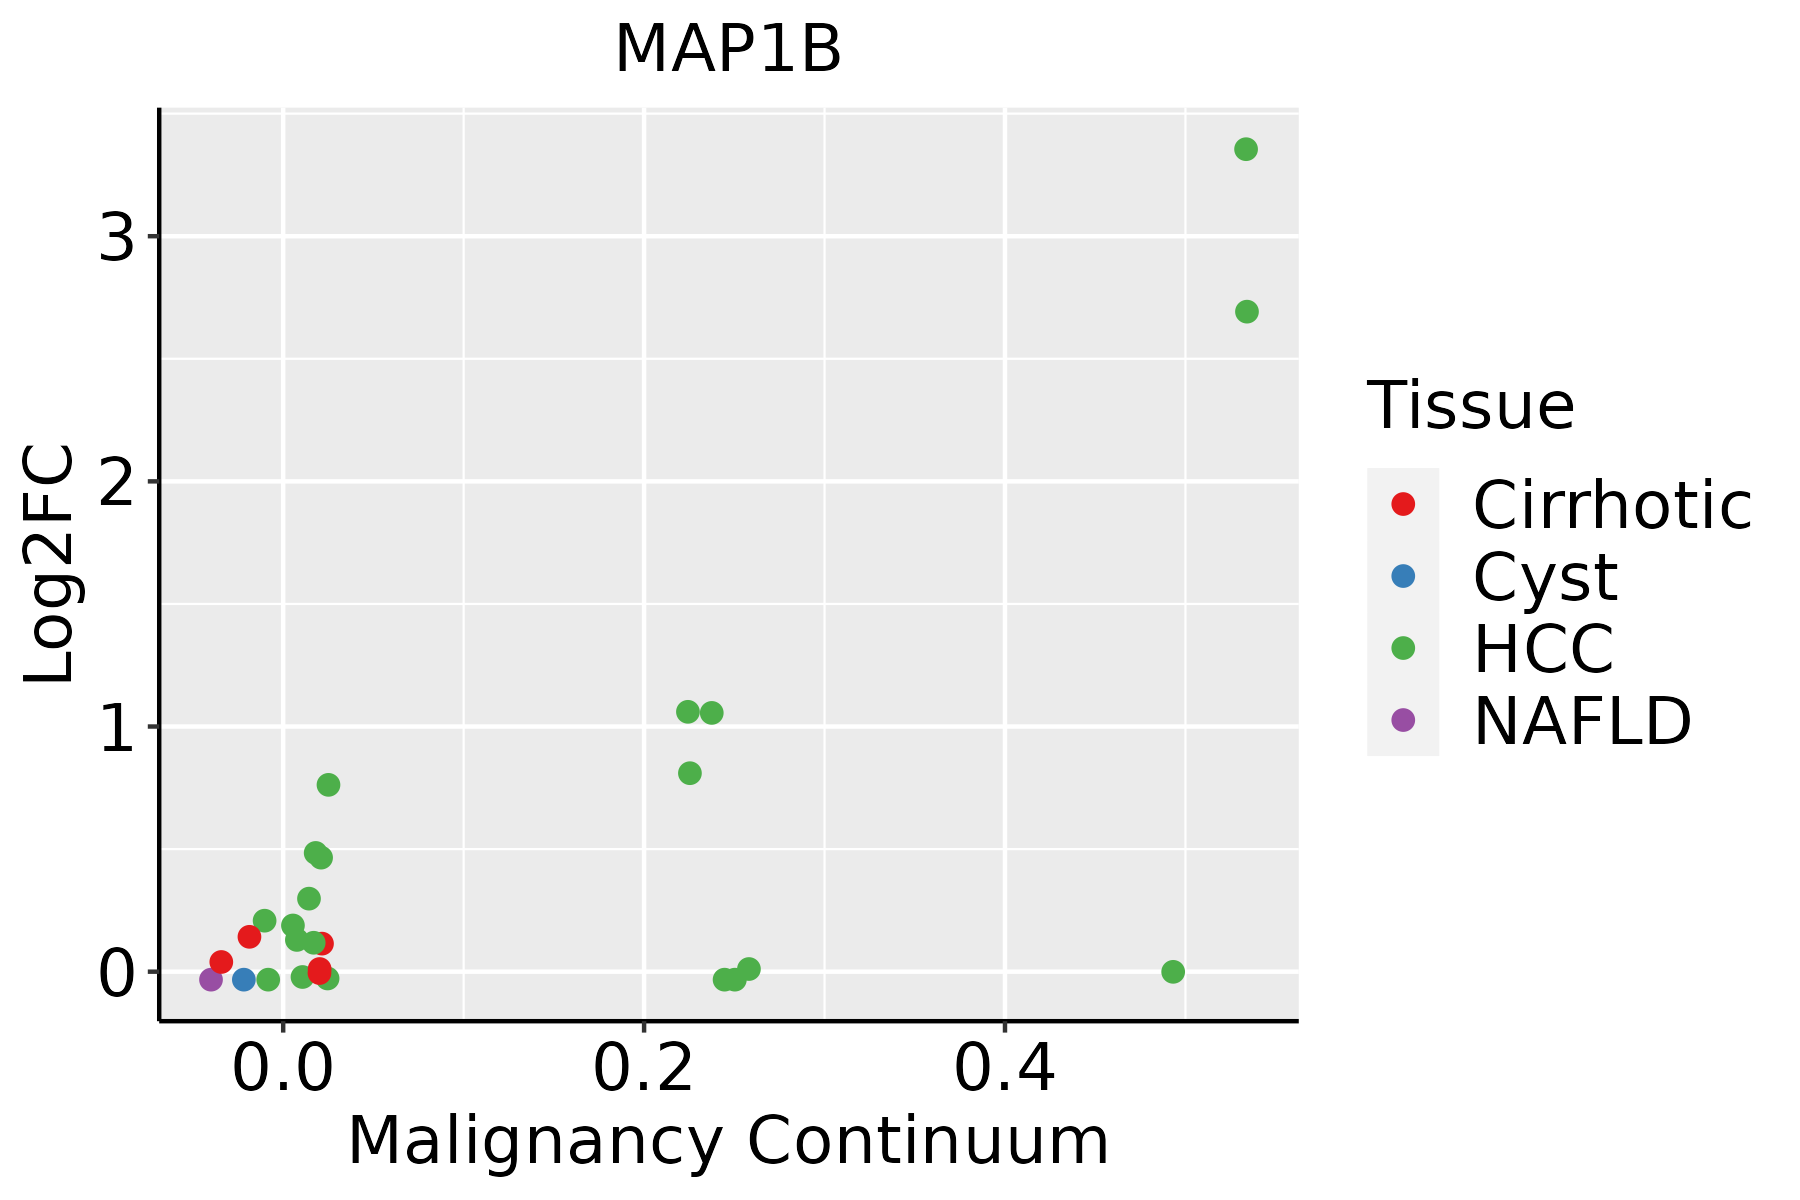 | HCC: Hepatocellular carcinoma |
| NAFLD: Non-alcoholic fatty liver disease | ||
| Oral Cavity | 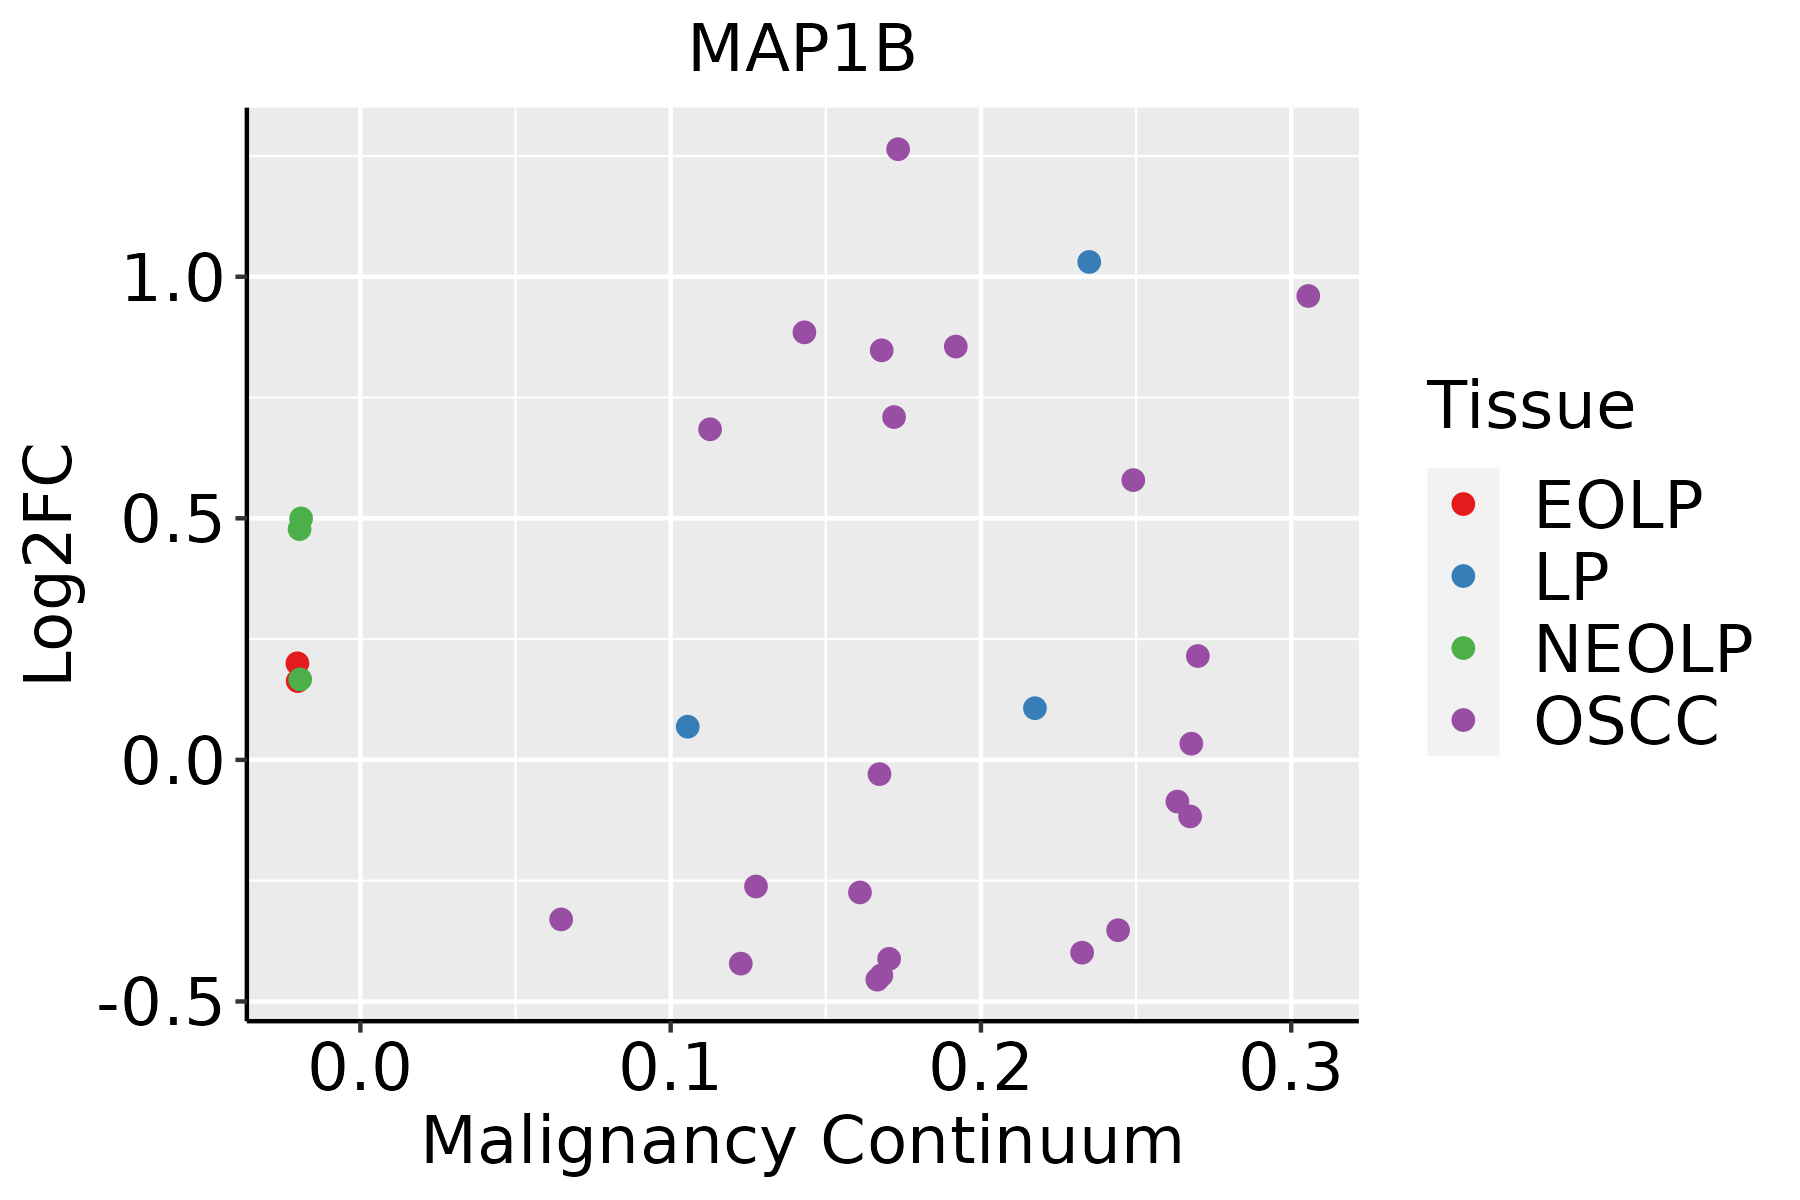 | EOLP: Erosive Oral lichen planus |
| LP: leukoplakia | ||
| NEOLP: Non-erosive oral lichen planus | ||
| OSCC: Oral squamous cell carcinoma | ||
| Prostate |  | BPH: Benign Prostatic Hyperplasia |
| Thyroid | 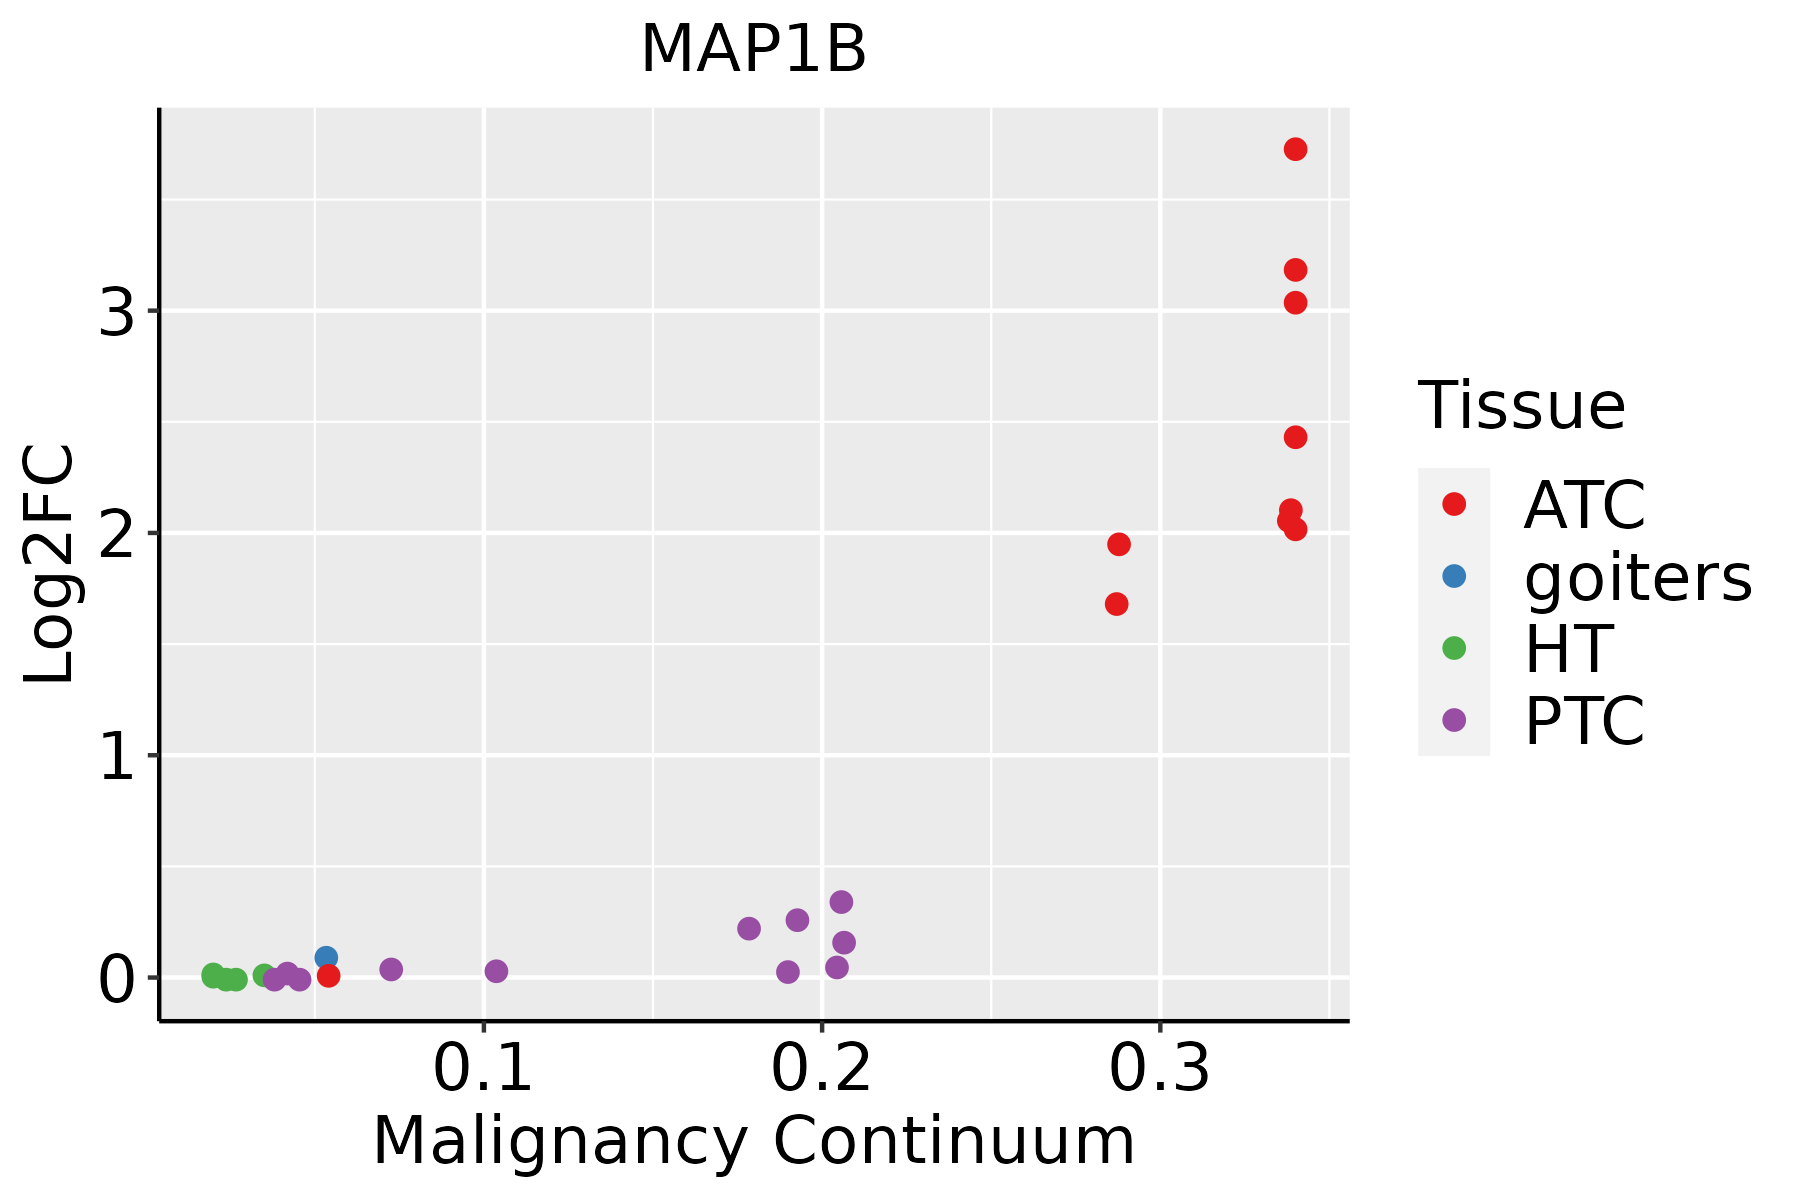 | ATC: Anaplastic thyroid cancer |
| HT: Hashimoto's thyroiditis | ||
| PTC: Papillary thyroid cancer |
| ∗log2FC in expression of this searched gene in stem-like cells from each diseased tissue sample relative to stem-like cells in normal samples in each tissue plotted against the malignancy continuum. Samples are colored based on if they are from different disease stage. |
Top |
Malignant transformation related pathway analysis |
| Find out the enriched GO biological processes and KEGG pathways involved in transition from healthy to precancer to cancer |
| Tissue | Disease Stage | Enriched GO biological Processes |
| Colorectum | AD |  |
| Colorectum | SER |  |
| Colorectum | MSS |  |
| Colorectum | MSI-H |  |
| Colorectum | FAP |  |
| ∗Top 15 enriched GO BP terms are showed in the bar plot of each disease state in each tissue. Each row represents a significant GO biological process which is colored according to the -log10(p.adjust). |
| Page: 1 2 3 4 5 6 7 8 9 |
| GO ID | Tissue | Disease Stage | Description | Gene Ratio | Bg Ratio | pvalue | p.adjust | Count |
| GO:000974316 | Endometrium | AEH | response to carbohydrate | 62/2100 | 253/18723 | 1.76e-09 | 1.51e-07 | 62 |
| GO:190290316 | Endometrium | AEH | regulation of supramolecular fiber organization | 83/2100 | 383/18723 | 2.20e-09 | 1.78e-07 | 83 |
| GO:000716310 | Endometrium | AEH | establishment or maintenance of cell polarity | 54/2100 | 218/18723 | 1.30e-08 | 8.47e-07 | 54 |
| GO:00160499 | Endometrium | AEH | cell growth | 93/2100 | 482/18723 | 1.00e-07 | 4.99e-06 | 93 |
| GO:003253510 | Endometrium | AEH | regulation of cellular component size | 78/2100 | 383/18723 | 1.10e-07 | 5.29e-06 | 78 |
| GO:004325416 | Endometrium | AEH | regulation of protein-containing complex assembly | 83/2100 | 428/18723 | 3.90e-07 | 1.63e-05 | 83 |
| GO:00605607 | Endometrium | AEH | developmental growth involved in morphogenesis | 53/2100 | 234/18723 | 4.02e-07 | 1.67e-05 | 53 |
| GO:00516568 | Endometrium | AEH | establishment of organelle localization | 77/2100 | 390/18723 | 4.89e-07 | 1.94e-05 | 77 |
| GO:00074098 | Endometrium | AEH | axonogenesis | 81/2100 | 418/18723 | 5.54e-07 | 2.12e-05 | 81 |
| GO:00615648 | Endometrium | AEH | axon development | 88/2100 | 467/18723 | 6.39e-07 | 2.38e-05 | 88 |
| GO:005125816 | Endometrium | AEH | protein polymerization | 62/2100 | 297/18723 | 9.04e-07 | 3.19e-05 | 62 |
| GO:190290516 | Endometrium | AEH | positive regulation of supramolecular fiber organization | 48/2100 | 209/18723 | 9.11e-07 | 3.20e-05 | 48 |
| GO:003133416 | Endometrium | AEH | positive regulation of protein-containing complex assembly | 52/2100 | 237/18723 | 1.43e-06 | 4.60e-05 | 52 |
| GO:00300109 | Endometrium | AEH | establishment of cell polarity | 36/2100 | 143/18723 | 2.19e-06 | 6.49e-05 | 36 |
| GO:00323869 | Endometrium | AEH | regulation of intracellular transport | 66/2100 | 337/18723 | 4.18e-06 | 1.10e-04 | 66 |
| GO:003227116 | Endometrium | AEH | regulation of protein polymerization | 50/2100 | 233/18723 | 4.43e-06 | 1.16e-04 | 50 |
| GO:00343299 | Endometrium | AEH | cell junction assembly | 78/2100 | 420/18723 | 4.80e-06 | 1.24e-04 | 78 |
| GO:19029049 | Endometrium | AEH | negative regulation of supramolecular fiber organization | 39/2100 | 167/18723 | 6.07e-06 | 1.50e-04 | 39 |
| GO:00486757 | Endometrium | AEH | axon extension | 31/2100 | 120/18723 | 6.13e-06 | 1.50e-04 | 31 |
| GO:002241115 | Endometrium | AEH | cellular component disassembly | 80/2100 | 443/18723 | 1.07e-05 | 2.45e-04 | 80 |
| Page: 1 2 3 4 5 6 7 8 9 10 11 12 13 14 15 16 17 18 19 20 21 22 23 24 25 26 27 28 29 30 31 32 33 34 35 36 37 |
| Pathway ID | Tissue | Disease Stage | Description | Gene Ratio | Bg Ratio | pvalue | p.adjust | qvalue | Count |
| hsa032509 | Esophagus | ESCC | Viral life cycle - HIV-1 | 54/4205 | 63/8465 | 2.01e-09 | 2.17e-08 | 1.11e-08 | 54 |
| hsa0325014 | Esophagus | ESCC | Viral life cycle - HIV-1 | 54/4205 | 63/8465 | 2.01e-09 | 2.17e-08 | 1.11e-08 | 54 |
| hsa0325022 | Oral cavity | LP | Viral life cycle - HIV-1 | 32/2418 | 63/8465 | 1.55e-04 | 9.08e-04 | 5.86e-04 | 32 |
| hsa0325031 | Oral cavity | LP | Viral life cycle - HIV-1 | 32/2418 | 63/8465 | 1.55e-04 | 9.08e-04 | 5.86e-04 | 32 |
| hsa032506 | Oral cavity | NEOLP | Viral life cycle - HIV-1 | 16/1112 | 63/8465 | 6.21e-03 | 2.33e-02 | 1.46e-02 | 16 |
| hsa032507 | Oral cavity | NEOLP | Viral life cycle - HIV-1 | 16/1112 | 63/8465 | 6.21e-03 | 2.33e-02 | 1.46e-02 | 16 |
| hsa032504 | Prostate | BPH | Viral life cycle - HIV-1 | 24/1718 | 63/8465 | 8.32e-04 | 3.98e-03 | 2.46e-03 | 24 |
| hsa0325012 | Prostate | BPH | Viral life cycle - HIV-1 | 24/1718 | 63/8465 | 8.32e-04 | 3.98e-03 | 2.46e-03 | 24 |
| hsa0325021 | Prostate | Tumor | Viral life cycle - HIV-1 | 25/1791 | 63/8465 | 6.13e-04 | 3.07e-03 | 1.91e-03 | 25 |
| hsa032503 | Prostate | Tumor | Viral life cycle - HIV-1 | 25/1791 | 63/8465 | 6.13e-04 | 3.07e-03 | 1.91e-03 | 25 |
| Page: 1 |
Top |
Cell-cell communication analysis |
| Identification of potential cell-cell interactions between two cell types and their ligand-receptor pairs for different disease states |
| Ligand | Receptor | LRpair | Pathway | Tissue | Disease Stage |
| Page: 1 |
Top |
Single-cell gene regulatory network inference analysis |
| Find out the significant the regulons (TFs) and the target genes of each regulon across cell types for different disease states |
| TF | Cell Type | Tissue | Disease Stage | Target Gene | RSS | Regulon Activity |
| ∗The dot plots of a searched regulon are shown for all cell subpopulations in each disease state of each tissue based on the regulon specific score inferred using pySCENIC and by calculating the average expression. |
| Page: 1 |
Top |
Somatic mutation of malignant transformation related genes |
| Annotation of somatic variants for genes involved in malignant transformation |
| Hugo Symbol | Variant Class | Variant Classification | dbSNP RS | HGVSc | HGVSp | HGVSp Short | SWISSPROT | BIOTYPE | SIFT | PolyPhen | Tumor Sample Barcode | Tissue | Histology | Sex | Age | Stage | Therapy Types | Drugs | Outcome |
| MAP1B | SNV | Missense_Mutation | c.254N>A | p.Arg85Gln | p.R85Q | P46821 | protein_coding | deleterious(0.04) | probably_damaging(0.994) | TCGA-AN-A046-01 | Breast | breast invasive carcinoma | Female | >=65 | I/II | Unknown | Unknown | SD | |
| MAP1B | SNV | Missense_Mutation | c.2220N>T | p.Lys740Asn | p.K740N | P46821 | protein_coding | deleterious(0) | possibly_damaging(0.879) | TCGA-AN-A046-01 | Breast | breast invasive carcinoma | Female | >=65 | I/II | Unknown | Unknown | SD | |
| MAP1B | SNV | Missense_Mutation | novel | c.6534N>G | p.Ile2178Met | p.I2178M | P46821 | protein_coding | tolerated(0.25) | probably_damaging(0.984) | TCGA-D8-A27V-01 | Breast | breast invasive carcinoma | Female | <65 | I/II | Hormone Therapy | tamoxiphen | SD |
| MAP1B | SNV | Missense_Mutation | rs6876207 | c.3662N>G | p.Ser1221Cys | p.S1221C | P46821 | protein_coding | deleterious(0) | probably_damaging(0.921) | TCGA-E2-A1LG-01 | Breast | breast invasive carcinoma | Female | <65 | I/II | Chemotherapy | doxorubicin | SD |
| MAP1B | insertion | Frame_Shift_Ins | novel | c.6042_6043insGGGCTTC | p.Thr2015GlyfsTer7 | p.T2015Gfs*7 | P46821 | protein_coding | TCGA-A8-A06P-01 | Breast | breast invasive carcinoma | Female | <65 | III/IV | Unspecific | SD | |||
| MAP1B | insertion | Frame_Shift_Ins | novel | c.1478_1479insGTATCTGCAGAGAATATGCTGGGTGACCCACTCATGTTTCAAT | p.Ser493ArgfsTer62 | p.S493Rfs*62 | P46821 | protein_coding | TCGA-A8-A079-01 | Breast | breast invasive carcinoma | Female | >=65 | III/IV | Chemotherapy | 5-fluorouracil | SD | ||
| MAP1B | insertion | Frame_Shift_Ins | novel | c.2748_2749insTGCATGATCCAAAATACTTTATTTCTATGGCTCATTGCCAA | p.Lys917CysfsTer18 | p.K917Cfs*18 | P46821 | protein_coding | TCGA-A8-A09D-01 | Breast | breast invasive carcinoma | Female | <65 | I/II | Chemotherapy | doxorubicin | CR | ||
| MAP1B | insertion | Frame_Shift_Ins | novel | c.4966_4967insGCAGAGGCAG | p.Gln1656ArgfsTer29 | p.Q1656Rfs*29 | P46821 | protein_coding | TCGA-AO-A0J9-01 | Breast | breast invasive carcinoma | Female | <65 | III/IV | Chemotherapy | cyclophosphamide | PD | ||
| MAP1B | insertion | Frame_Shift_Ins | novel | c.4968_4969insGTAGCCCCGGTGTCTCCTGAGGTGACCCAAGAAG | p.Ser1657ValfsTer36 | p.S1657Vfs*36 | P46821 | protein_coding | TCGA-AO-A0J9-01 | Breast | breast invasive carcinoma | Female | <65 | III/IV | Chemotherapy | cyclophosphamide | PD | ||
| MAP1B | insertion | Frame_Shift_Ins | novel | c.1503_1504insGAGATGAGGT | p.Leu502GlufsTer42 | p.L502Efs*42 | P46821 | protein_coding | TCGA-AR-A0TU-01 | Breast | breast invasive carcinoma | Female | <65 | I/II | Unspecific | Doxorubicin | SD |
| Page: 1 2 3 4 5 6 7 8 9 10 11 12 13 14 15 16 17 18 19 20 21 22 23 24 25 26 27 28 29 30 31 32 33 |
Top |
Related drugs of malignant transformation related genes |
| Identification of chemicals and drugs interact with genes involved in malignant transfromation |
| (DGIdb 4.0) |
| Entrez ID | Symbol | Category | Interaction Types | Drug Claim Name | Drug Name | PMIDs |
| Page: 1 |

Copyright 2023-Present -The University of Texas Health Science Center at Houston |