
|
|||||
|
 | |
| |
| |
| |
| |
| |
|
Gene: MAP1A |
Gene summary for MAP1A |
| Gene information | Species | Human | Gene symbol | MAP1A | Gene ID | 4130 |
| Gene name | microtubule associated protein 1A | |
| Gene Alias | MAP1L | |
| Cytomap | 15q15.3 | |
| Gene Type | protein-coding | GO ID | GO:0000226 | UniProtAcc | P78559 |
Top |
Malignant transformation analysis |
| Identification of the aberrant gene expression in precancerous and cancerous lesions by comparing the gene expression of stem-like cells in diseased tissues with normal stem cells |
| Entrez ID | Symbol | Replicates | Species | Organ | Tissue | Adj P-value | Log2FC | Malignancy |
| 4130 | MAP1A | LZE4T | Human | Esophagus | ESCC | 2.18e-06 | 2.49e-01 | 0.0811 |
| 4130 | MAP1A | LZE7T | Human | Esophagus | ESCC | 3.90e-02 | 1.46e-01 | 0.0667 |
| 4130 | MAP1A | P4T-E | Human | Esophagus | ESCC | 1.22e-08 | 2.48e-01 | 0.1323 |
| 4130 | MAP1A | P8T-E | Human | Esophagus | ESCC | 1.01e-03 | 9.80e-02 | 0.0889 |
| 4130 | MAP1A | P9T-E | Human | Esophagus | ESCC | 8.59e-07 | 2.28e-01 | 0.1131 |
| 4130 | MAP1A | P10T-E | Human | Esophagus | ESCC | 1.67e-72 | 1.44e+00 | 0.116 |
| 4130 | MAP1A | P11T-E | Human | Esophagus | ESCC | 6.08e-06 | 3.63e-01 | 0.1426 |
| 4130 | MAP1A | P12T-E | Human | Esophagus | ESCC | 4.49e-06 | 2.27e-01 | 0.1122 |
| 4130 | MAP1A | P15T-E | Human | Esophagus | ESCC | 3.16e-13 | 3.64e-01 | 0.1149 |
| 4130 | MAP1A | P22T-E | Human | Esophagus | ESCC | 1.34e-03 | 1.20e-01 | 0.1236 |
| 4130 | MAP1A | P24T-E | Human | Esophagus | ESCC | 1.44e-04 | 1.47e-01 | 0.1287 |
| 4130 | MAP1A | P26T-E | Human | Esophagus | ESCC | 4.50e-03 | 6.23e-02 | 0.1276 |
| 4130 | MAP1A | P30T-E | Human | Esophagus | ESCC | 1.56e-07 | 3.19e-01 | 0.137 |
| 4130 | MAP1A | P31T-E | Human | Esophagus | ESCC | 3.63e-03 | 1.61e-01 | 0.1251 |
| 4130 | MAP1A | P32T-E | Human | Esophagus | ESCC | 5.01e-07 | 3.05e-01 | 0.1666 |
| 4130 | MAP1A | P37T-E | Human | Esophagus | ESCC | 4.28e-02 | 1.21e-01 | 0.1371 |
| 4130 | MAP1A | P42T-E | Human | Esophagus | ESCC | 3.05e-02 | 1.05e-01 | 0.1175 |
| 4130 | MAP1A | P44T-E | Human | Esophagus | ESCC | 1.88e-05 | 1.78e-01 | 0.1096 |
| 4130 | MAP1A | P48T-E | Human | Esophagus | ESCC | 4.72e-02 | 7.79e-02 | 0.0959 |
| 4130 | MAP1A | P49T-E | Human | Esophagus | ESCC | 4.64e-06 | 5.85e-01 | 0.1768 |
| Page: 1 2 3 |
| Tissue | Expression Dynamics | Abbreviation |
| Esophagus | 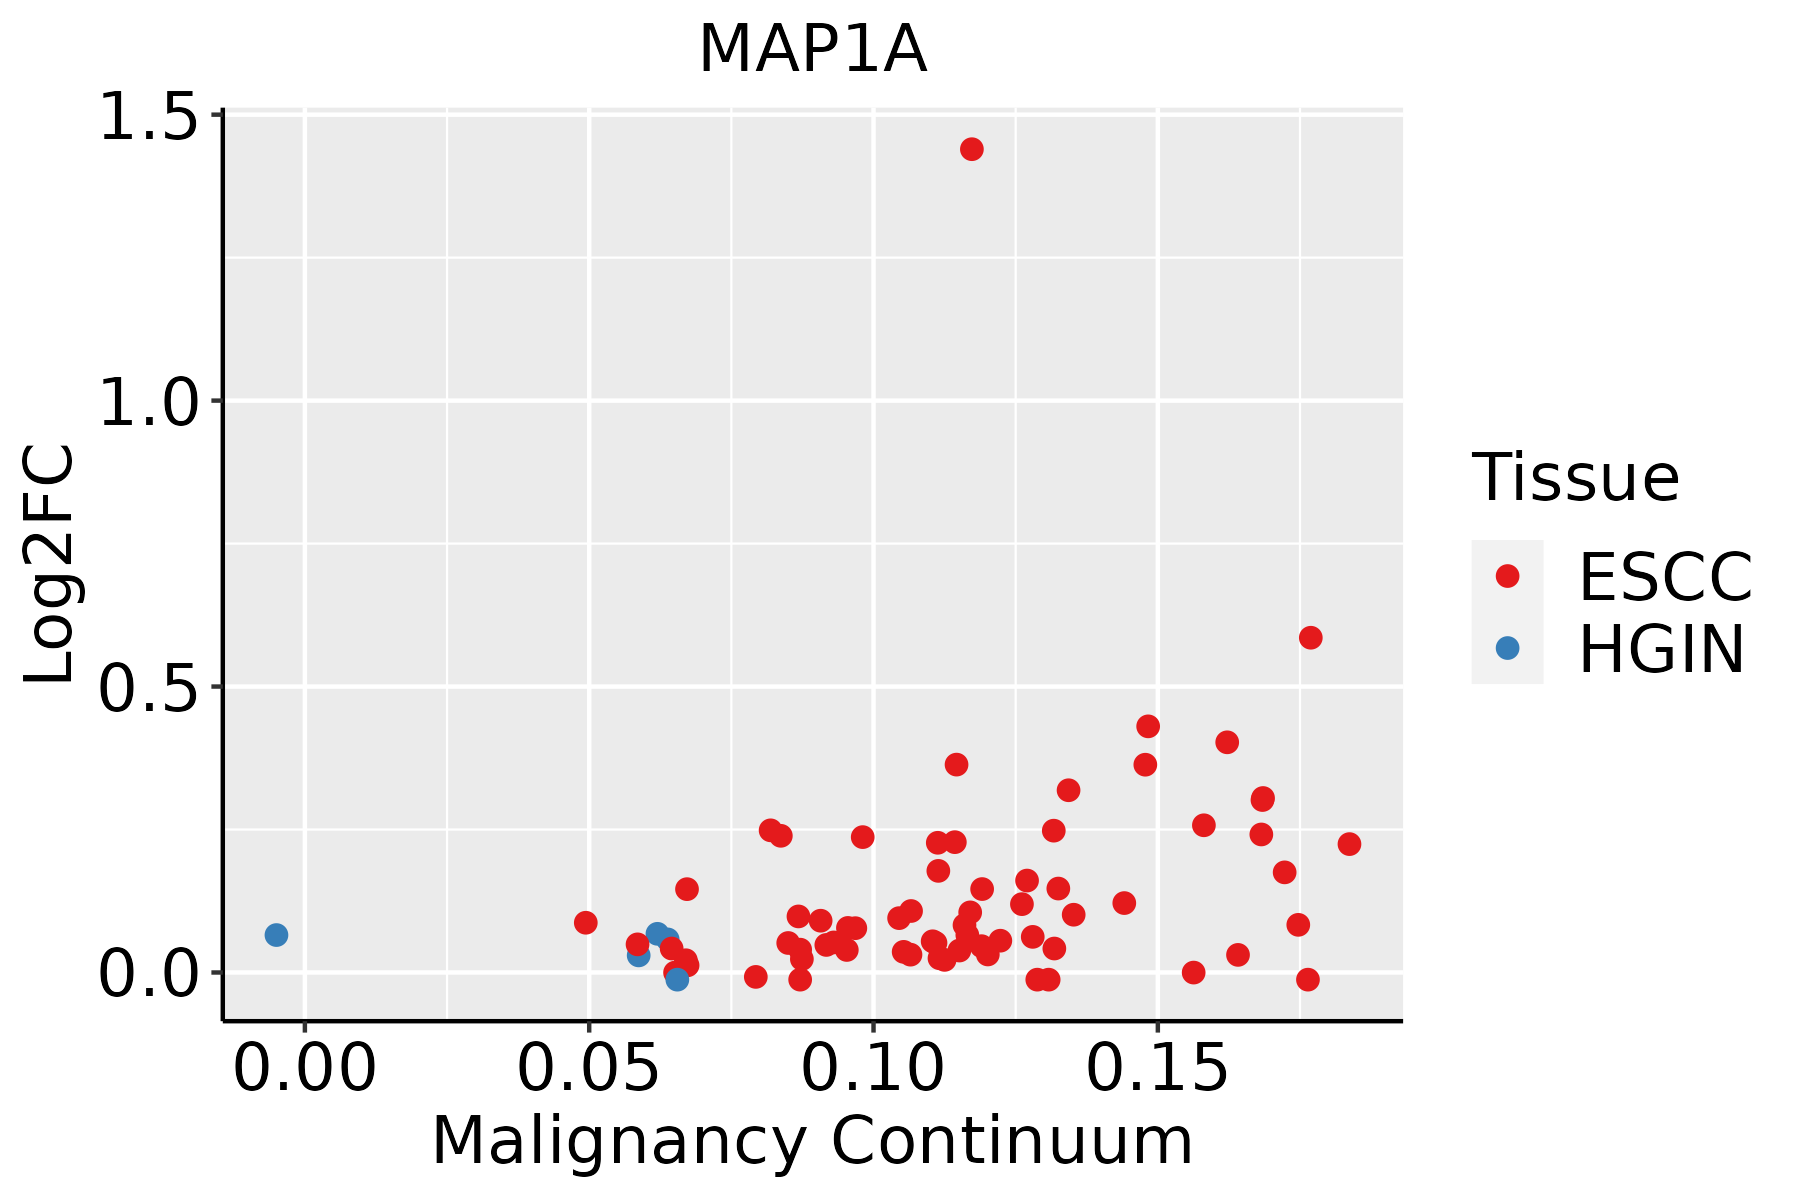 | ESCC: Esophageal squamous cell carcinoma |
| HGIN: High-grade intraepithelial neoplasias | ||
| LGIN: Low-grade intraepithelial neoplasias | ||
| Liver | 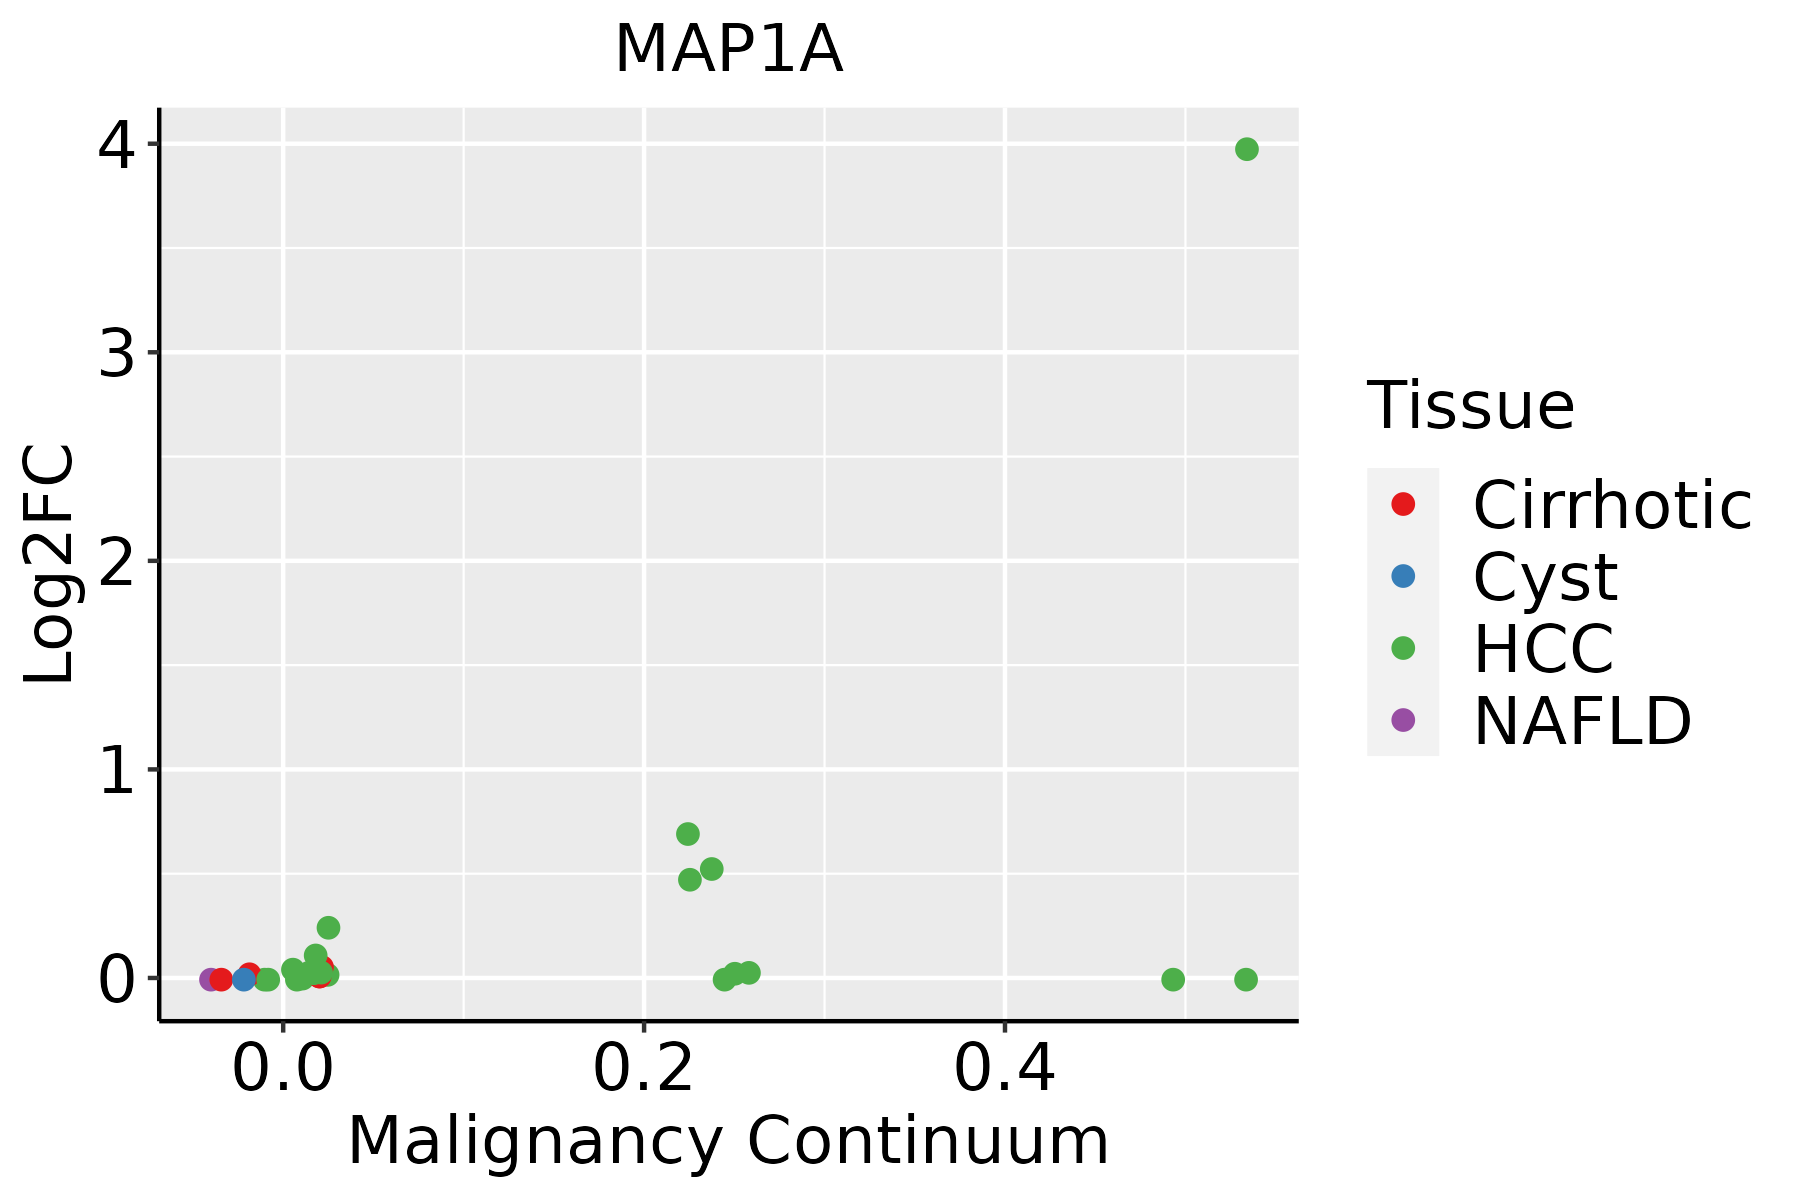 | HCC: Hepatocellular carcinoma |
| NAFLD: Non-alcoholic fatty liver disease | ||
| Thyroid | 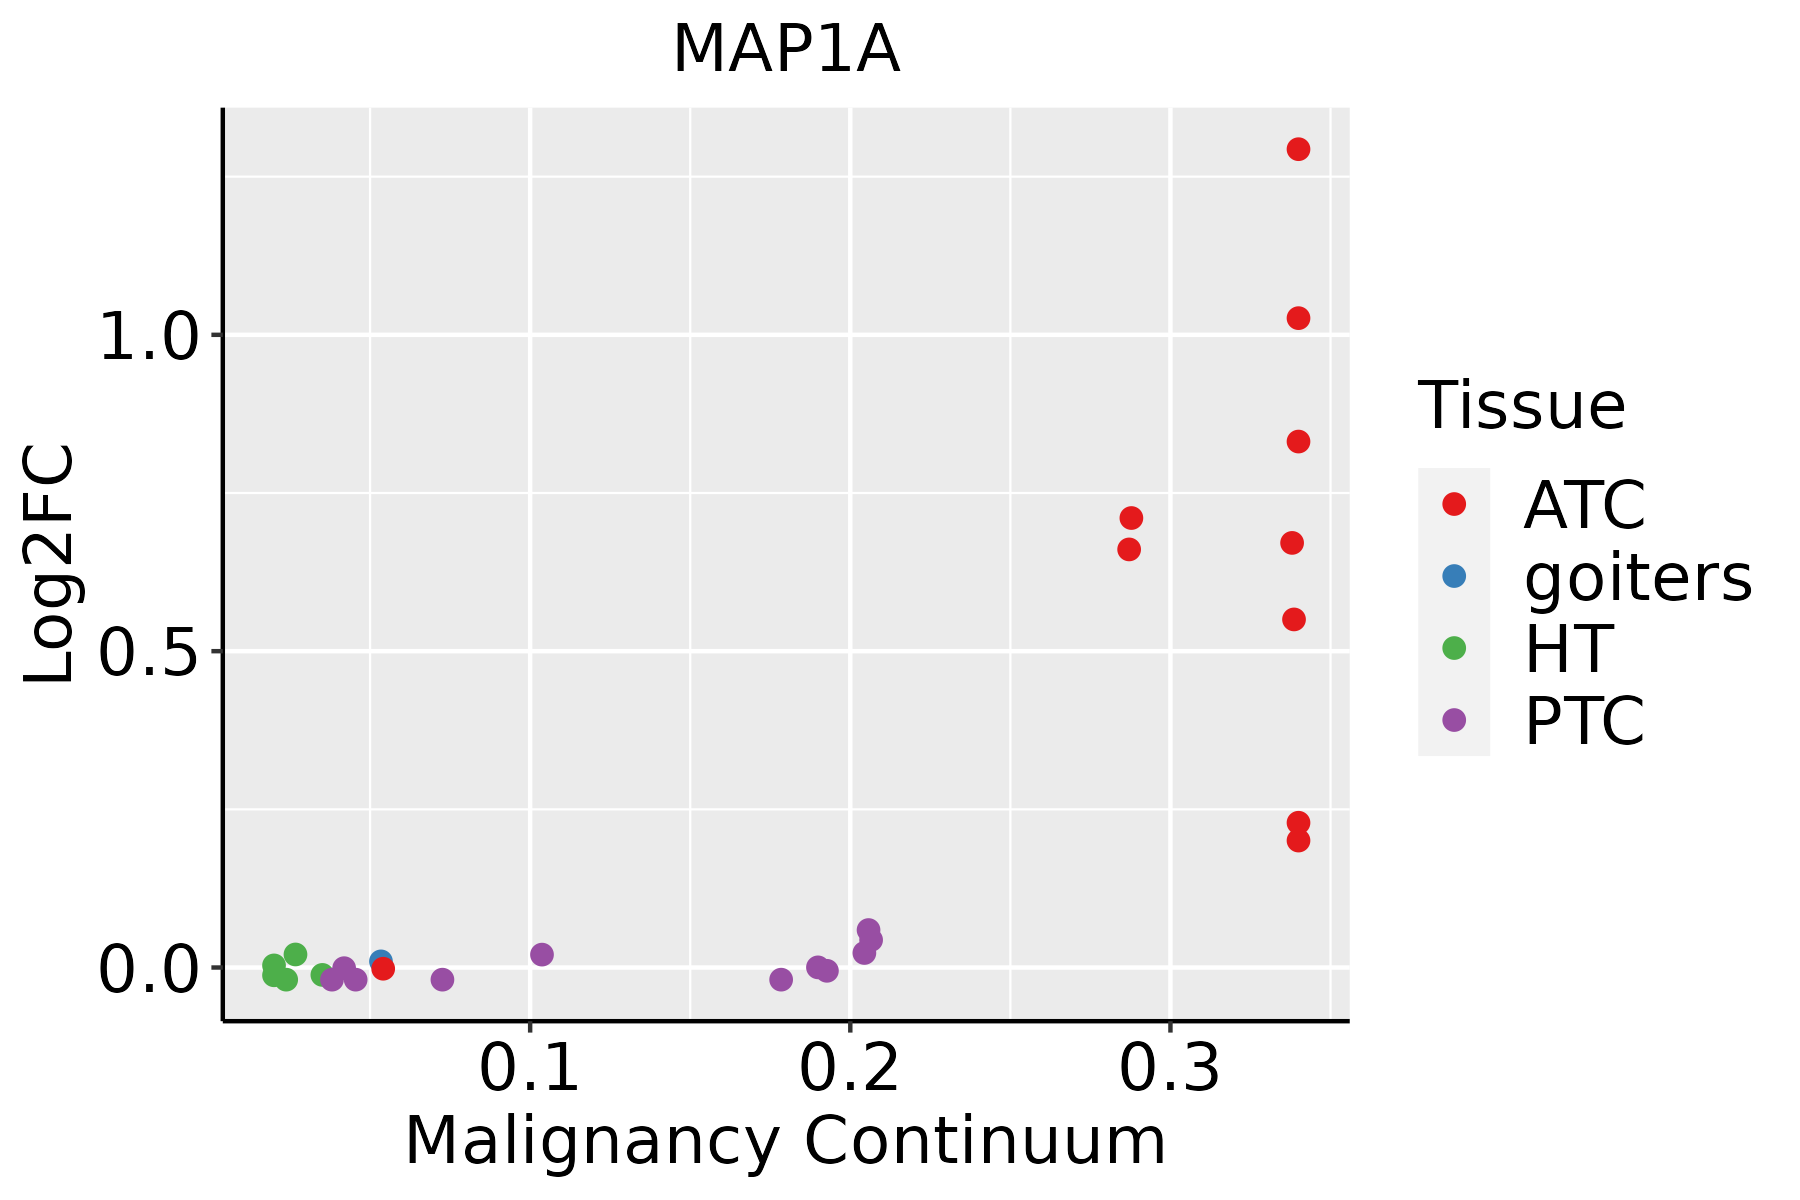 | ATC: Anaplastic thyroid cancer |
| HT: Hashimoto's thyroiditis | ||
| PTC: Papillary thyroid cancer |
| ∗log2FC in expression of this searched gene in stem-like cells from each diseased tissue sample relative to stem-like cells in normal samples in each tissue plotted against the malignancy continuum. Samples are colored based on if they are from different disease stage. |
Top |
Malignant transformation related pathway analysis |
| Find out the enriched GO biological processes and KEGG pathways involved in transition from healthy to precancer to cancer |
| Tissue | Disease Stage | Enriched GO biological Processes |
| Colorectum | AD |  |
| Colorectum | SER |  |
| Colorectum | MSS |  |
| Colorectum | MSI-H |  |
| Colorectum | FAP |  |
| ∗Top 15 enriched GO BP terms are showed in the bar plot of each disease state in each tissue. Each row represents a significant GO biological process which is colored according to the -log10(p.adjust). |
| Page: 1 2 3 4 5 6 7 8 9 |
| GO ID | Tissue | Disease Stage | Description | Gene Ratio | Bg Ratio | pvalue | p.adjust | Count |
| GO:0010498111 | Esophagus | ESCC | proteasomal protein catabolic process | 369/8552 | 490/18723 | 1.13e-41 | 1.80e-38 | 369 |
| GO:0043161111 | Esophagus | ESCC | proteasome-mediated ubiquitin-dependent protein catabolic process | 312/8552 | 412/18723 | 3.53e-36 | 4.48e-33 | 312 |
| GO:0042176111 | Esophagus | ESCC | regulation of protein catabolic process | 280/8552 | 391/18723 | 8.65e-26 | 2.39e-23 | 280 |
| GO:0022411111 | Esophagus | ESCC | cellular component disassembly | 305/8552 | 443/18723 | 1.94e-23 | 4.57e-21 | 305 |
| GO:1903362111 | Esophagus | ESCC | regulation of cellular protein catabolic process | 188/8552 | 255/18723 | 5.12e-20 | 6.62e-18 | 188 |
| GO:1903829111 | Esophagus | ESCC | positive regulation of cellular protein localization | 199/8552 | 276/18723 | 2.99e-19 | 3.45e-17 | 199 |
| GO:1903050111 | Esophagus | ESCC | regulation of proteolysis involved in cellular protein catabolic process | 163/8552 | 221/18723 | 1.44e-17 | 1.27e-15 | 163 |
| GO:0061136111 | Esophagus | ESCC | regulation of proteasomal protein catabolic process | 142/8552 | 187/18723 | 2.40e-17 | 2.00e-15 | 142 |
| GO:0032434111 | Esophagus | ESCC | regulation of proteasomal ubiquitin-dependent protein catabolic process | 107/8552 | 134/18723 | 4.06e-16 | 2.93e-14 | 107 |
| GO:2000058111 | Esophagus | ESCC | regulation of ubiquitin-dependent protein catabolic process | 125/8552 | 164/18723 | 1.17e-15 | 7.76e-14 | 125 |
| GO:003298416 | Esophagus | ESCC | protein-containing complex disassembly | 151/8552 | 224/18723 | 3.45e-11 | 1.15e-09 | 151 |
| GO:1902903111 | Esophagus | ESCC | regulation of supramolecular fiber organization | 237/8552 | 383/18723 | 9.06e-11 | 2.75e-09 | 237 |
| GO:003070518 | Esophagus | ESCC | cytoskeleton-dependent intracellular transport | 133/8552 | 195/18723 | 1.48e-10 | 4.27e-09 | 133 |
| GO:0009895111 | Esophagus | ESCC | negative regulation of catabolic process | 201/8552 | 320/18723 | 3.88e-10 | 1.05e-08 | 201 |
| GO:001097013 | Esophagus | ESCC | transport along microtubule | 107/8552 | 155/18723 | 3.17e-09 | 6.80e-08 | 107 |
| GO:0031330111 | Esophagus | ESCC | negative regulation of cellular catabolic process | 166/8552 | 262/18723 | 5.17e-09 | 1.08e-07 | 166 |
| GO:000808810 | Esophagus | ESCC | axo-dendritic transport | 58/8552 | 75/18723 | 2.09e-08 | 4.02e-07 | 58 |
| GO:0042177111 | Esophagus | ESCC | negative regulation of protein catabolic process | 84/8552 | 121/18723 | 1.03e-07 | 1.69e-06 | 84 |
| GO:00705078 | Esophagus | ESCC | regulation of microtubule cytoskeleton organization | 99/8552 | 148/18723 | 1.43e-07 | 2.29e-06 | 99 |
| GO:00726985 | Esophagus | ESCC | protein localization to microtubule cytoskeleton | 43/8552 | 54/18723 | 3.28e-07 | 4.61e-06 | 43 |
| Page: 1 2 3 4 5 6 |
| Pathway ID | Tissue | Disease Stage | Description | Gene Ratio | Bg Ratio | pvalue | p.adjust | qvalue | Count |
| hsa032509 | Esophagus | ESCC | Viral life cycle - HIV-1 | 54/4205 | 63/8465 | 2.01e-09 | 2.17e-08 | 1.11e-08 | 54 |
| hsa0325014 | Esophagus | ESCC | Viral life cycle - HIV-1 | 54/4205 | 63/8465 | 2.01e-09 | 2.17e-08 | 1.11e-08 | 54 |
| hsa032502 | Liver | HCC | Viral life cycle - HIV-1 | 46/4020 | 63/8465 | 3.25e-05 | 1.88e-04 | 1.04e-04 | 46 |
| hsa0325011 | Liver | HCC | Viral life cycle - HIV-1 | 46/4020 | 63/8465 | 3.25e-05 | 1.88e-04 | 1.04e-04 | 46 |
| Page: 1 |
Top |
Cell-cell communication analysis |
| Identification of potential cell-cell interactions between two cell types and their ligand-receptor pairs for different disease states |
| Ligand | Receptor | LRpair | Pathway | Tissue | Disease Stage |
| Page: 1 |
Top |
Single-cell gene regulatory network inference analysis |
| Find out the significant the regulons (TFs) and the target genes of each regulon across cell types for different disease states |
| TF | Cell Type | Tissue | Disease Stage | Target Gene | RSS | Regulon Activity |
| ∗The dot plots of a searched regulon are shown for all cell subpopulations in each disease state of each tissue based on the regulon specific score inferred using pySCENIC and by calculating the average expression. |
| Page: 1 |
Top |
Somatic mutation of malignant transformation related genes |
| Annotation of somatic variants for genes involved in malignant transformation |
| Hugo Symbol | Variant Class | Variant Classification | dbSNP RS | HGVSc | HGVSp | HGVSp Short | SWISSPROT | BIOTYPE | SIFT | PolyPhen | Tumor Sample Barcode | Tissue | Histology | Sex | Age | Stage | Therapy Types | Drugs | Outcome |
| MAP1A | SNV | Missense_Mutation | novel | c.1606N>C | p.Glu536Gln | p.E536Q | P78559 | protein_coding | deleterious(0) | probably_damaging(0.993) | TCGA-5L-AAT0-01 | Breast | breast invasive carcinoma | Female | <65 | I/II | Hormone Therapy | tamoxiphen | SD |
| MAP1A | SNV | Missense_Mutation | c.1580N>T | p.Ser527Leu | p.S527L | P78559 | protein_coding | deleterious(0) | probably_damaging(0.999) | TCGA-5L-AAT1-01 | Breast | breast invasive carcinoma | Female | <65 | III/IV | Hormone Therapy | letrozol | SD | |
| MAP1A | SNV | Missense_Mutation | novel | c.6992G>A | p.Gly2331Asp | p.G2331D | P78559 | protein_coding | tolerated_low_confidence(0.06) | benign(0.019) | TCGA-A7-A0DB-01 | Breast | breast invasive carcinoma | Female | <65 | I/II | Hormone Therapy | arimidex | SD |
| MAP1A | SNV | Missense_Mutation | c.375G>C | p.Lys125Asn | p.K125N | P78559 | protein_coding | deleterious(0) | probably_damaging(0.976) | TCGA-A8-A085-01 | Breast | breast invasive carcinoma | Male | <65 | I/II | Hormone Therapy | tamoxiphen | SD | |
| MAP1A | SNV | Missense_Mutation | c.3775C>A | p.His1259Asn | p.H1259N | P78559 | protein_coding | tolerated_low_confidence(0.18) | benign(0.056) | TCGA-A8-A09Z-01 | Breast | breast invasive carcinoma | Female | >=65 | I/II | Unknown | Unknown | SD | |
| MAP1A | SNV | Missense_Mutation | rs757899270 | c.3869N>T | p.Ala1290Val | p.A1290V | P78559 | protein_coding | deleterious_low_confidence(0.03) | benign(0.127) | TCGA-A8-A0A1-01 | Breast | breast invasive carcinoma | Female | >=65 | I/II | Hormone Therapy | tamoxiphen | SD |
| MAP1A | SNV | Missense_Mutation | c.8122G>A | p.Asp2708Asn | p.D2708N | P78559 | protein_coding | deleterious(0.03) | probably_damaging(1) | TCGA-AC-A23H-01 | Breast | breast invasive carcinoma | Female | >=65 | I/II | Unknown | Unknown | PD | |
| MAP1A | SNV | Missense_Mutation | novel | c.4773G>T | p.Arg1591Ser | p.R1591S | P78559 | protein_coding | tolerated_low_confidence(0.27) | benign(0.009) | TCGA-AN-A046-01 | Breast | breast invasive carcinoma | Female | >=65 | I/II | Unknown | Unknown | SD |
| MAP1A | SNV | Missense_Mutation | rs767267121 | c.6820C>T | p.Arg2274Cys | p.R2274C | P78559 | protein_coding | deleterious_low_confidence(0.04) | benign(0.311) | TCGA-AN-A046-01 | Breast | breast invasive carcinoma | Female | >=65 | I/II | Unknown | Unknown | SD |
| MAP1A | SNV | Missense_Mutation | c.131N>A | p.Pro44Gln | p.P44Q | P78559 | protein_coding | deleterious(0) | probably_damaging(1) | TCGA-AN-A0AL-01 | Breast | breast invasive carcinoma | Female | <65 | III/IV | Unknown | Unknown | SD |
| Page: 1 2 3 4 5 6 7 8 9 10 11 12 13 14 15 16 17 18 19 20 21 22 23 24 25 26 27 28 29 30 31 |
Top |
Related drugs of malignant transformation related genes |
| Identification of chemicals and drugs interact with genes involved in malignant transfromation |
| (DGIdb 4.0) |
| Entrez ID | Symbol | Category | Interaction Types | Drug Claim Name | Drug Name | PMIDs |
| Page: 1 |

Copyright 2023-Present -The University of Texas Health Science Center at Houston |