
|
|||||
|
 | |
| |
| |
| |
| |
| |
|
Gene: MAOB |
Gene summary for MAOB |
| Gene information | Species | Human | Gene symbol | MAOB | Gene ID | 4129 |
| Gene name | monoamine oxidase B | |
| Gene Alias | MAOB | |
| Cytomap | Xp11.3 | |
| Gene Type | protein-coding | GO ID | GO:0001505 | UniProtAcc | P27338 |
Top |
Malignant transformation analysis |
| Identification of the aberrant gene expression in precancerous and cancerous lesions by comparing the gene expression of stem-like cells in diseased tissues with normal stem cells |
| Entrez ID | Symbol | Replicates | Species | Organ | Tissue | Adj P-value | Log2FC | Malignancy |
| 4129 | MAOB | GSM4909281 | Human | Breast | IDC | 3.65e-12 | 3.22e-01 | 0.21 |
| 4129 | MAOB | GSM4909287 | Human | Breast | IDC | 4.39e-06 | 2.27e-01 | 0.2057 |
| 4129 | MAOB | GSM4909289 | Human | Breast | IDC | 7.21e-07 | 6.54e-01 | 0.1064 |
| 4129 | MAOB | GSM4909291 | Human | Breast | IDC | 1.52e-02 | 2.54e-01 | 0.1753 |
| 4129 | MAOB | GSM4909293 | Human | Breast | IDC | 4.08e-36 | 4.89e-01 | 0.1581 |
| 4129 | MAOB | GSM4909295 | Human | Breast | IDC | 1.26e-07 | 4.49e-01 | 0.0898 |
| 4129 | MAOB | GSM4909297 | Human | Breast | IDC | 7.71e-24 | 7.49e-01 | 0.1517 |
| 4129 | MAOB | GSM4909298 | Human | Breast | IDC | 9.01e-08 | 1.69e-01 | 0.1551 |
| 4129 | MAOB | GSM4909299 | Human | Breast | IDC | 1.85e-11 | 3.28e-01 | 0.035 |
| 4129 | MAOB | GSM4909305 | Human | Breast | IDC | 3.12e-03 | 2.54e-01 | 0.0436 |
| 4129 | MAOB | GSM4909306 | Human | Breast | IDC | 2.50e-45 | 8.22e-01 | 0.1564 |
| 4129 | MAOB | GSM4909309 | Human | Breast | IDC | 2.65e-02 | 2.69e-01 | 0.0483 |
| 4129 | MAOB | GSM4909313 | Human | Breast | IDC | 2.25e-04 | 3.11e-01 | 0.0391 |
| 4129 | MAOB | DCIS2 | Human | Breast | DCIS | 4.15e-56 | 4.76e-01 | 0.0085 |
| 4129 | MAOB | P2T-E | Human | Esophagus | ESCC | 8.44e-25 | 4.67e-01 | 0.1177 |
| 4129 | MAOB | P16T-E | Human | Esophagus | ESCC | 1.14e-24 | 5.80e-01 | 0.1153 |
| 4129 | MAOB | P20T-E | Human | Esophagus | ESCC | 1.30e-03 | 1.66e-01 | 0.1124 |
| 4129 | MAOB | P24T-E | Human | Esophagus | ESCC | 1.66e-02 | 1.21e-01 | 0.1287 |
| 4129 | MAOB | P27T-E | Human | Esophagus | ESCC | 5.79e-16 | 3.48e-01 | 0.1055 |
| 4129 | MAOB | P32T-E | Human | Esophagus | ESCC | 1.88e-04 | 1.42e-01 | 0.1666 |
| Page: 1 2 3 |
| Tissue | Expression Dynamics | Abbreviation |
| Breast | 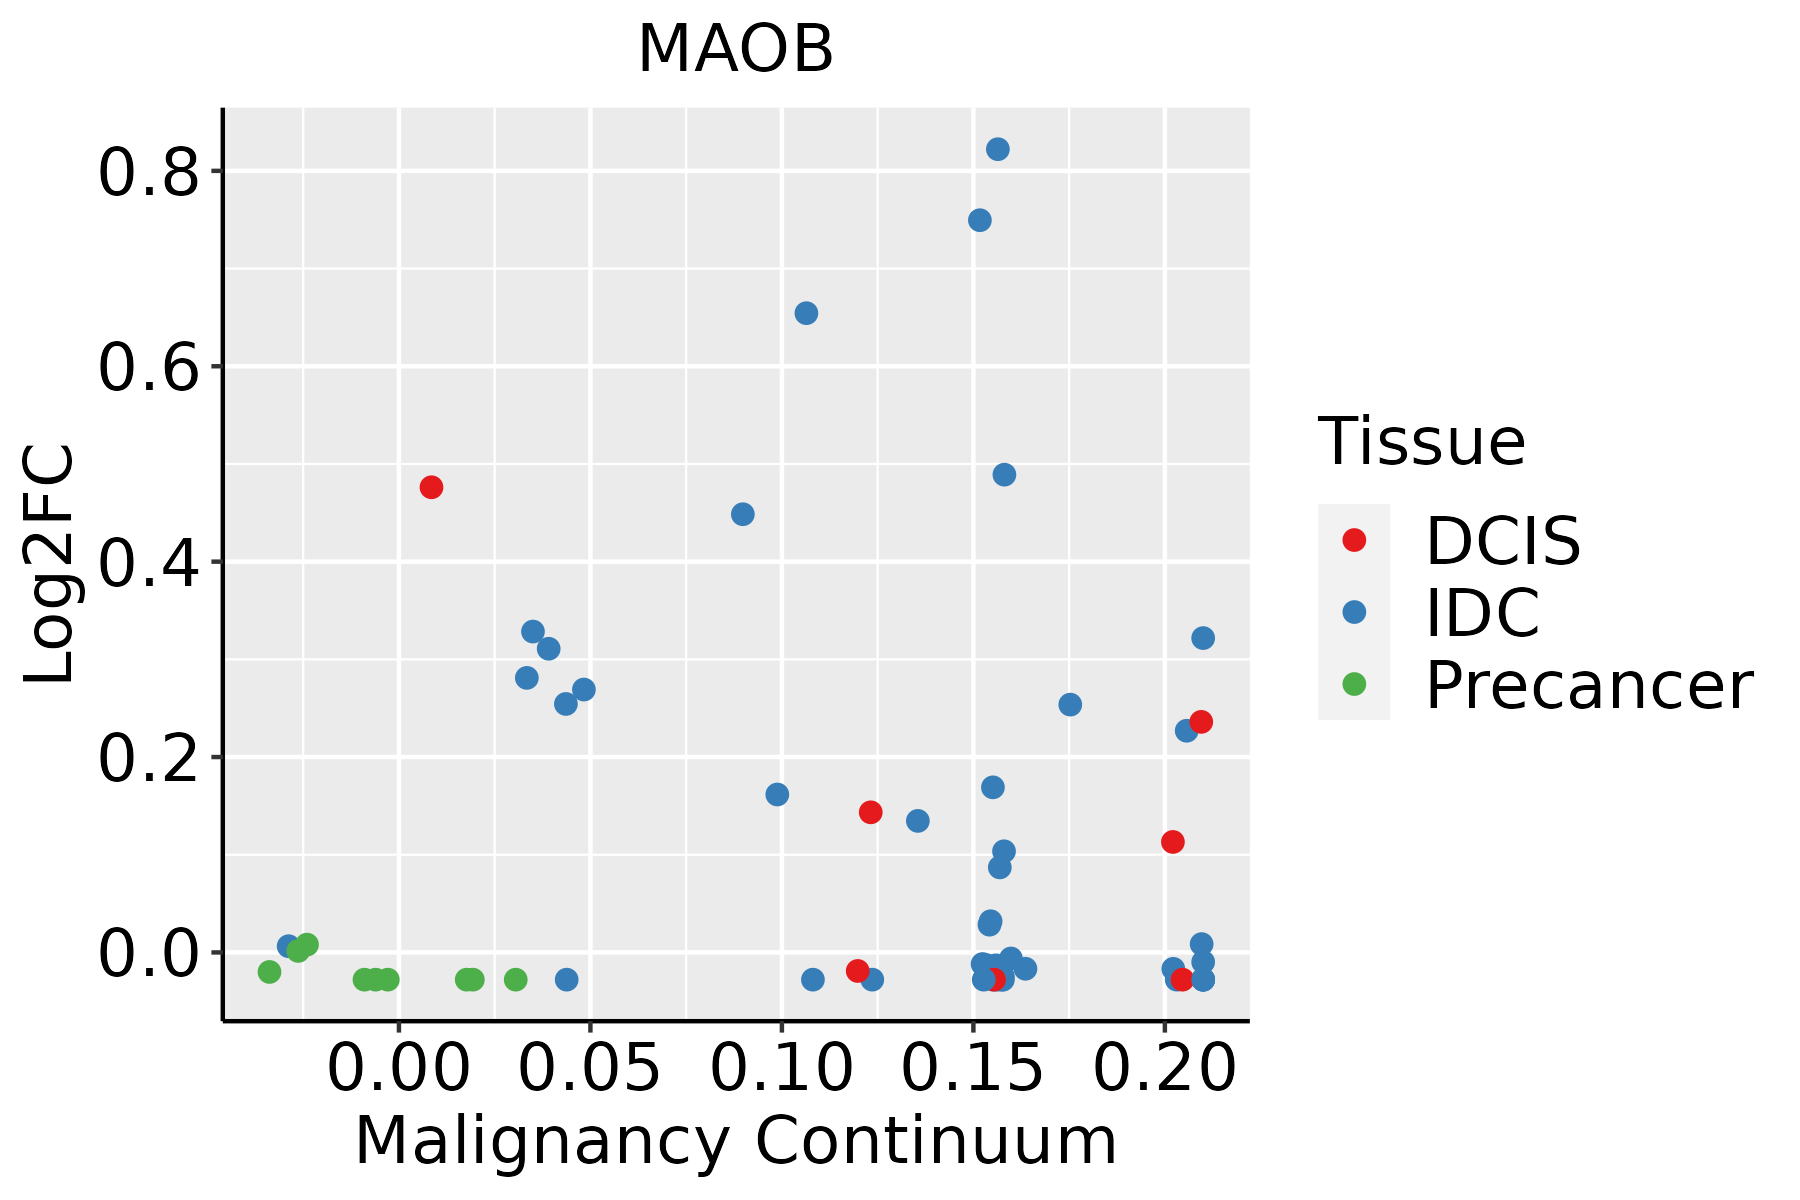 | IDC: Invasive ductal carcinoma |
| DCIS: Ductal carcinoma in situ | ||
| Precancer(BRCA1-mut): Precancerous lesion from BRCA1 mutation carriers | ||
| Esophagus | 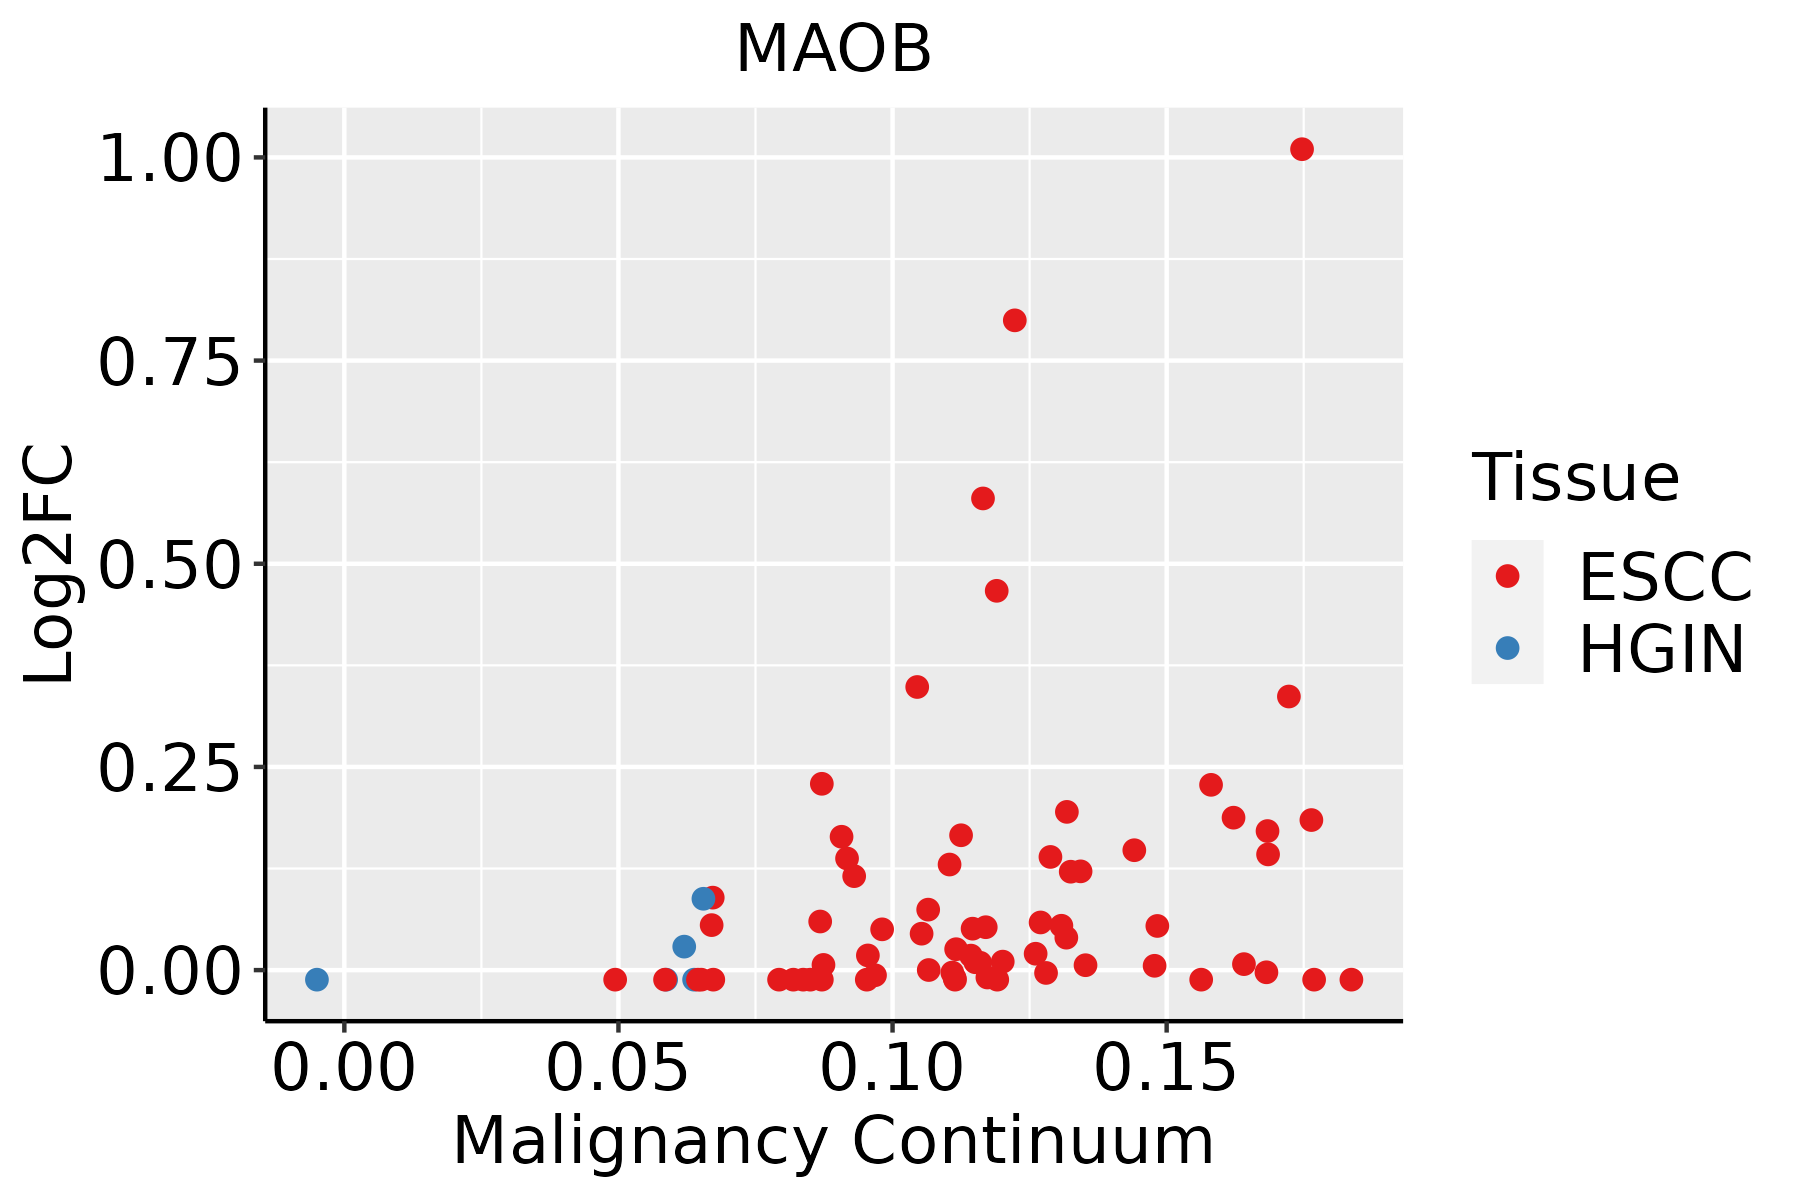 | ESCC: Esophageal squamous cell carcinoma |
| HGIN: High-grade intraepithelial neoplasias | ||
| LGIN: Low-grade intraepithelial neoplasias | ||
| Liver | 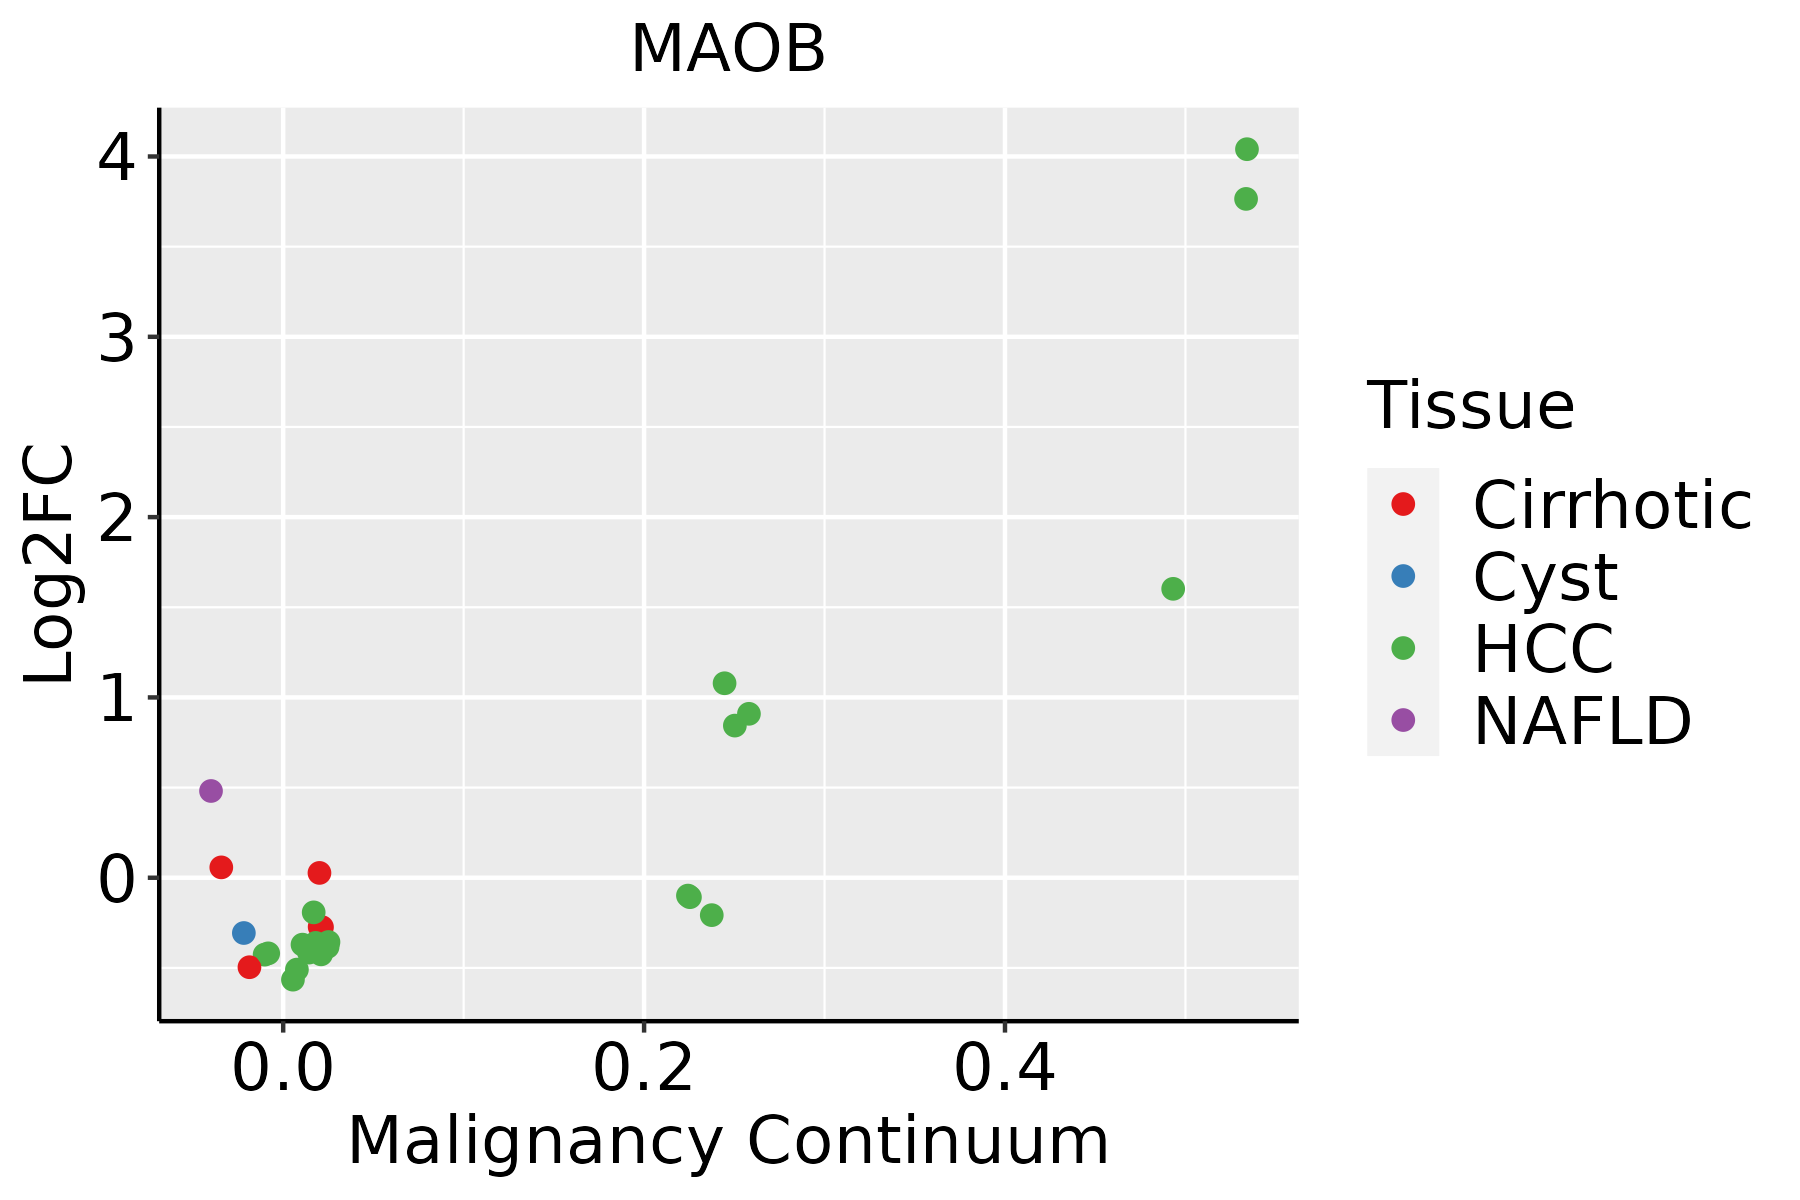 | HCC: Hepatocellular carcinoma |
| NAFLD: Non-alcoholic fatty liver disease |
| ∗log2FC in expression of this searched gene in stem-like cells from each diseased tissue sample relative to stem-like cells in normal samples in each tissue plotted against the malignancy continuum. Samples are colored based on if they are from different disease stage. |
Top |
Malignant transformation related pathway analysis |
| Find out the enriched GO biological processes and KEGG pathways involved in transition from healthy to precancer to cancer |
| Tissue | Disease Stage | Enriched GO biological Processes |
| Colorectum | AD |  |
| Colorectum | SER |  |
| Colorectum | MSS |  |
| Colorectum | MSI-H |  |
| Colorectum | FAP |  |
| ∗Top 15 enriched GO BP terms are showed in the bar plot of each disease state in each tissue. Each row represents a significant GO biological process which is colored according to the -log10(p.adjust). |
| Page: 1 2 3 4 5 6 7 8 9 |
| GO ID | Tissue | Disease Stage | Description | Gene Ratio | Bg Ratio | pvalue | p.adjust | Count |
| GO:000609113 | Breast | IDC | generation of precursor metabolites and energy | 103/1434 | 490/18723 | 1.53e-21 | 1.74e-18 | 103 |
| GO:002290013 | Breast | IDC | electron transport chain | 51/1434 | 175/18723 | 2.23e-17 | 8.43e-15 | 51 |
| GO:004854514 | Breast | IDC | response to steroid hormone | 70/1434 | 339/18723 | 1.34e-14 | 4.23e-12 | 70 |
| GO:001003814 | Breast | IDC | response to metal ion | 65/1434 | 373/18723 | 2.95e-10 | 3.42e-08 | 65 |
| GO:002176214 | Breast | IDC | substantia nigra development | 18/1434 | 44/18723 | 1.11e-09 | 1.07e-07 | 18 |
| GO:003196013 | Breast | IDC | response to corticosteroid | 37/1434 | 167/18723 | 3.10e-09 | 2.63e-07 | 37 |
| GO:004885713 | Breast | IDC | neural nucleus development | 21/1434 | 64/18723 | 5.35e-09 | 4.28e-07 | 21 |
| GO:003090112 | Breast | IDC | midbrain development | 24/1434 | 90/18723 | 4.35e-08 | 2.87e-06 | 24 |
| GO:005138413 | Breast | IDC | response to glucocorticoid | 32/1434 | 148/18723 | 6.52e-08 | 4.07e-06 | 32 |
| GO:000963613 | Breast | IDC | response to toxic substance | 44/1434 | 262/18723 | 6.33e-07 | 3.00e-05 | 44 |
| GO:000941013 | Breast | IDC | response to xenobiotic stimulus | 62/1434 | 462/18723 | 1.05e-05 | 2.88e-04 | 62 |
| GO:190165414 | Breast | IDC | response to ketone | 33/1434 | 194/18723 | 1.17e-05 | 3.13e-04 | 33 |
| GO:00102691 | Breast | IDC | response to selenium ion | 6/1434 | 11/18723 | 6.59e-05 | 1.35e-03 | 6 |
| GO:003249612 | Breast | IDC | response to lipopolysaccharide | 47/1434 | 343/18723 | 7.13e-05 | 1.43e-03 | 47 |
| GO:007259313 | Breast | IDC | reactive oxygen species metabolic process | 36/1434 | 239/18723 | 7.16e-05 | 1.43e-03 | 36 |
| GO:000223712 | Breast | IDC | response to molecule of bacterial origin | 49/1434 | 363/18723 | 7.40e-05 | 1.47e-03 | 49 |
| GO:009730514 | Breast | IDC | response to alcohol | 36/1434 | 253/18723 | 2.29e-04 | 3.64e-03 | 36 |
| GO:005138511 | Breast | IDC | response to mineralocorticoid | 10/1434 | 36/18723 | 2.70e-04 | 4.18e-03 | 10 |
| GO:005141211 | Breast | IDC | response to corticosterone | 7/1434 | 22/18723 | 9.31e-04 | 1.06e-02 | 7 |
| GO:004274311 | Breast | IDC | hydrogen peroxide metabolic process | 12/1434 | 58/18723 | 1.27e-03 | 1.35e-02 | 12 |
| Page: 1 2 3 4 5 6 7 |
| Pathway ID | Tissue | Disease Stage | Description | Gene Ratio | Bg Ratio | pvalue | p.adjust | qvalue | Count |
| hsa0501224 | Breast | IDC | Parkinson disease | 107/867 | 266/8465 | 2.57e-39 | 8.36e-37 | 6.26e-37 | 107 |
| hsa050312 | Breast | IDC | Amphetamine addiction | 18/867 | 69/8465 | 1.42e-04 | 1.36e-03 | 1.01e-03 | 18 |
| hsa0501234 | Breast | IDC | Parkinson disease | 107/867 | 266/8465 | 2.57e-39 | 8.36e-37 | 6.26e-37 | 107 |
| hsa050313 | Breast | IDC | Amphetamine addiction | 18/867 | 69/8465 | 1.42e-04 | 1.36e-03 | 1.01e-03 | 18 |
| hsa0501243 | Breast | DCIS | Parkinson disease | 106/846 | 266/8465 | 1.64e-39 | 5.29e-37 | 3.90e-37 | 106 |
| hsa0501253 | Breast | DCIS | Parkinson disease | 106/846 | 266/8465 | 1.64e-39 | 5.29e-37 | 3.90e-37 | 106 |
| hsa05012211 | Esophagus | ESCC | Parkinson disease | 201/4205 | 266/8465 | 1.56e-18 | 8.72e-17 | 4.46e-17 | 201 |
| hsa05012310 | Esophagus | ESCC | Parkinson disease | 201/4205 | 266/8465 | 1.56e-18 | 8.72e-17 | 4.46e-17 | 201 |
| hsa0501214 | Liver | Cirrhotic | Parkinson disease | 158/2530 | 266/8465 | 3.62e-24 | 6.02e-22 | 3.71e-22 | 158 |
| hsa00260 | Liver | Cirrhotic | Glycine, serine and threonine metabolism | 22/2530 | 40/8465 | 7.85e-04 | 4.51e-03 | 2.78e-03 | 22 |
| hsa003802 | Liver | Cirrhotic | Tryptophan metabolism | 22/2530 | 42/8465 | 1.85e-03 | 8.37e-03 | 5.16e-03 | 22 |
| hsa003308 | Liver | Cirrhotic | Arginine and proline metabolism | 25/2530 | 50/8465 | 2.18e-03 | 9.41e-03 | 5.80e-03 | 25 |
| hsa0501215 | Liver | Cirrhotic | Parkinson disease | 158/2530 | 266/8465 | 3.62e-24 | 6.02e-22 | 3.71e-22 | 158 |
| hsa002601 | Liver | Cirrhotic | Glycine, serine and threonine metabolism | 22/2530 | 40/8465 | 7.85e-04 | 4.51e-03 | 2.78e-03 | 22 |
| hsa0038011 | Liver | Cirrhotic | Tryptophan metabolism | 22/2530 | 42/8465 | 1.85e-03 | 8.37e-03 | 5.16e-03 | 22 |
| hsa0033011 | Liver | Cirrhotic | Arginine and proline metabolism | 25/2530 | 50/8465 | 2.18e-03 | 9.41e-03 | 5.80e-03 | 25 |
| hsa0501222 | Liver | HCC | Parkinson disease | 198/4020 | 266/8465 | 9.40e-20 | 1.58e-17 | 8.76e-18 | 198 |
| hsa002602 | Liver | HCC | Glycine, serine and threonine metabolism | 28/4020 | 40/8465 | 3.28e-03 | 1.07e-02 | 5.93e-03 | 28 |
| hsa0033021 | Liver | HCC | Arginine and proline metabolism | 33/4020 | 50/8465 | 6.28e-03 | 1.77e-02 | 9.83e-03 | 33 |
| hsa0501232 | Liver | HCC | Parkinson disease | 198/4020 | 266/8465 | 9.40e-20 | 1.58e-17 | 8.76e-18 | 198 |
| Page: 1 2 |
Top |
Cell-cell communication analysis |
| Identification of potential cell-cell interactions between two cell types and their ligand-receptor pairs for different disease states |
| Ligand | Receptor | LRpair | Pathway | Tissue | Disease Stage |
| Page: 1 |
Top |
Single-cell gene regulatory network inference analysis |
| Find out the significant the regulons (TFs) and the target genes of each regulon across cell types for different disease states |
| TF | Cell Type | Tissue | Disease Stage | Target Gene | RSS | Regulon Activity |
| ∗The dot plots of a searched regulon are shown for all cell subpopulations in each disease state of each tissue based on the regulon specific score inferred using pySCENIC and by calculating the average expression. |
| Page: 1 |
Top |
Somatic mutation of malignant transformation related genes |
| Annotation of somatic variants for genes involved in malignant transformation |
| Hugo Symbol | Variant Class | Variant Classification | dbSNP RS | HGVSc | HGVSp | HGVSp Short | SWISSPROT | BIOTYPE | SIFT | PolyPhen | Tumor Sample Barcode | Tissue | Histology | Sex | Age | Stage | Therapy Types | Drugs | Outcome |
| MAOB | SNV | Missense_Mutation | novel | c.421N>A | p.Glu141Lys | p.E141K | P27338 | protein_coding | tolerated(0.17) | benign(0.105) | TCGA-5L-AAT1-01 | Breast | breast invasive carcinoma | Female | <65 | III/IV | Hormone Therapy | letrozol | SD |
| MAOB | SNV | Missense_Mutation | c.878N>T | p.Ser293Leu | p.S293L | P27338 | protein_coding | deleterious(0) | probably_damaging(0.928) | TCGA-AC-A23H-01 | Breast | breast invasive carcinoma | Female | >=65 | I/II | Unknown | Unknown | PD | |
| MAOB | SNV | Missense_Mutation | novel | c.989A>G | p.Asp330Gly | p.D330G | P27338 | protein_coding | deleterious(0.01) | probably_damaging(0.997) | TCGA-AN-A046-01 | Breast | breast invasive carcinoma | Female | >=65 | I/II | Unknown | Unknown | SD |
| MAOB | SNV | Missense_Mutation | c.215N>A | p.Ala72Asp | p.A72D | P27338 | protein_coding | deleterious(0) | probably_damaging(0.978) | TCGA-AR-A1AK-01 | Breast | breast invasive carcinoma | Female | >=65 | I/II | Hormone Therapy | anastrozole | SD | |
| MAOB | SNV | Missense_Mutation | c.614N>T | p.Gly205Val | p.G205V | P27338 | protein_coding | deleterious(0) | probably_damaging(0.999) | TCGA-B6-A400-01 | Breast | breast invasive carcinoma | Female | <65 | III/IV | Unknown | Unknown | SD | |
| MAOB | SNV | Missense_Mutation | c.207N>C | p.Leu69Phe | p.L69F | P27338 | protein_coding | tolerated(0.09) | possibly_damaging(0.716) | TCGA-IR-A3LK-01 | Cervix | cervical & endocervical cancer | Female | >=65 | I/II | Chemotherapy | cisplatin | PD | |
| MAOB | SNV | Missense_Mutation | c.256N>A | p.Glu86Lys | p.E86K | P27338 | protein_coding | tolerated(0.19) | possibly_damaging(0.806) | TCGA-LP-A5U2-01 | Cervix | cervical & endocervical cancer | Female | <65 | III/IV | Unknown | Unknown | SD | |
| MAOB | SNV | Missense_Mutation | novel | c.593N>C | p.Ile198Thr | p.I198T | P27338 | protein_coding | deleterious(0) | probably_damaging(0.995) | TCGA-ZJ-AAXI-01 | Cervix | cervical & endocervical cancer | Female | >=65 | I/II | Unknown | Unknown | SD |
| MAOB | SNV | Missense_Mutation | novel | c.1195A>T | p.Thr399Ser | p.T399S | P27338 | protein_coding | tolerated(0.05) | possibly_damaging(0.833) | TCGA-AA-3950-01 | Colorectum | colon adenocarcinoma | Female | >=65 | I/II | Unknown | Unknown | SD |
| MAOB | SNV | Missense_Mutation | c.510C>G | p.Asn170Lys | p.N170K | P27338 | protein_coding | tolerated(0.08) | possibly_damaging(0.618) | TCGA-AY-6197-01 | Colorectum | colon adenocarcinoma | Male | <65 | I/II | Unknown | Unknown | SD |
| Page: 1 2 3 4 5 6 |
Top |
Related drugs of malignant transformation related genes |
| Identification of chemicals and drugs interact with genes involved in malignant transfromation |
| (DGIdb 4.0) |
| Entrez ID | Symbol | Category | Interaction Types | Drug Claim Name | Drug Name | PMIDs |
| 4129 | MAOB | DRUGGABLE GENOME, ENZYME | PHENELZINE | PHENELZINE | ||
| 4129 | MAOB | DRUGGABLE GENOME, ENZYME | Phenelzine | PHENELZINE | ||
| 4129 | MAOB | DRUGGABLE GENOME, ENZYME | METHAMPHETAMINE | METHAMPHETAMINE | ||
| 4129 | MAOB | DRUGGABLE GENOME, ENZYME | inhibitor | CHEMBL2218887 | ||
| 4129 | MAOB | DRUGGABLE GENOME, ENZYME | 4-hydroxybenzaldehyde | 4-HYDROXYBENZALDEHYDE | ||
| 4129 | MAOB | DRUGGABLE GENOME, ENZYME | PMID25399762-Compound-Table1-C5 | |||
| 4129 | MAOB | DRUGGABLE GENOME, ENZYME | Coumaricacid | |||
| 4129 | MAOB | DRUGGABLE GENOME, ENZYME | Ethylvanillin | |||
| 4129 | MAOB | DRUGGABLE GENOME, ENZYME | P2B-001 | |||
| 4129 | MAOB | DRUGGABLE GENOME, ENZYME | 4-Hydroxybenzylalcohol |
| Page: 1 2 3 4 5 6 7 8 9 10 11 12 13 14 15 |

Copyright 2023-Present -The University of Texas Health Science Center at Houston |