
|
|||||
|
 | |
| |
| |
| |
| |
| |
|
Gene: MAOA |
Gene summary for MAOA |
| Gene information | Species | Human | Gene symbol | MAOA | Gene ID | 4128 |
| Gene name | monoamine oxidase A | |
| Gene Alias | BRNRS | |
| Cytomap | Xp11.3 | |
| Gene Type | protein-coding | GO ID | GO:0001505 | UniProtAcc | P21397 |
Top |
Malignant transformation analysis |
| Identification of the aberrant gene expression in precancerous and cancerous lesions by comparing the gene expression of stem-like cells in diseased tissues with normal stem cells |
| Entrez ID | Symbol | Replicates | Species | Organ | Tissue | Adj P-value | Log2FC | Malignancy |
| 4128 | MAOA | HTA11_3410_2000001011 | Human | Colorectum | AD | 1.98e-17 | -6.92e-01 | 0.0155 |
| 4128 | MAOA | HTA11_2951_2000001011 | Human | Colorectum | AD | 1.33e-02 | -7.88e-01 | 0.0216 |
| 4128 | MAOA | HTA11_347_2000001011 | Human | Colorectum | AD | 3.00e-12 | 7.22e-01 | -0.1954 |
| 4128 | MAOA | HTA11_2992_2000001011 | Human | Colorectum | SER | 1.01e-03 | 7.24e-01 | -0.1706 |
| 4128 | MAOA | HTA11_866_3004761011 | Human | Colorectum | AD | 1.18e-07 | -5.41e-01 | 0.096 |
| 4128 | MAOA | HTA11_9408_2000001011 | Human | Colorectum | AD | 2.09e-02 | -8.98e-01 | 0.0451 |
| 4128 | MAOA | HTA11_10711_2000001011 | Human | Colorectum | AD | 2.88e-04 | -6.18e-01 | 0.0338 |
| 4128 | MAOA | HTA11_7696_3000711011 | Human | Colorectum | AD | 3.51e-23 | -5.66e-01 | 0.0674 |
| 4128 | MAOA | HTA11_6818_2000001021 | Human | Colorectum | AD | 4.63e-09 | -7.98e-01 | 0.0588 |
| 4128 | MAOA | HTA11_99999970781_79442 | Human | Colorectum | MSS | 7.12e-12 | -5.28e-01 | 0.294 |
| 4128 | MAOA | HTA11_99999971662_82457 | Human | Colorectum | MSS | 2.14e-15 | -6.57e-01 | 0.3859 |
| 4128 | MAOA | HTA11_99999973899_84307 | Human | Colorectum | MSS | 4.77e-11 | -9.01e-01 | 0.2585 |
| 4128 | MAOA | HTA11_99999974143_84620 | Human | Colorectum | MSS | 4.58e-39 | -8.97e-01 | 0.3005 |
| 4128 | MAOA | F007 | Human | Colorectum | FAP | 6.22e-17 | -8.92e-01 | 0.1176 |
| 4128 | MAOA | A002-C-010 | Human | Colorectum | FAP | 1.71e-10 | -6.50e-01 | 0.242 |
| 4128 | MAOA | A001-C-207 | Human | Colorectum | FAP | 3.00e-12 | -6.78e-01 | 0.1278 |
| 4128 | MAOA | A015-C-203 | Human | Colorectum | FAP | 6.94e-39 | -7.59e-01 | -0.1294 |
| 4128 | MAOA | A015-C-204 | Human | Colorectum | FAP | 4.58e-11 | -6.47e-01 | -0.0228 |
| 4128 | MAOA | A014-C-040 | Human | Colorectum | FAP | 8.01e-10 | -8.97e-01 | -0.1184 |
| 4128 | MAOA | A002-C-201 | Human | Colorectum | FAP | 1.51e-23 | -7.46e-01 | 0.0324 |
| Page: 1 2 3 4 5 6 7 8 |
| Tissue | Expression Dynamics | Abbreviation |
| Colorectum (GSE201348) |  | FAP: Familial adenomatous polyposis |
| CRC: Colorectal cancer | ||
| Colorectum (HTA11) |  | AD: Adenomas |
| SER: Sessile serrated lesions | ||
| MSI-H: Microsatellite-high colorectal cancer | ||
| MSS: Microsatellite stable colorectal cancer | ||
| Esophagus |  | ESCC: Esophageal squamous cell carcinoma |
| HGIN: High-grade intraepithelial neoplasias | ||
| LGIN: Low-grade intraepithelial neoplasias | ||
| Liver |  | HCC: Hepatocellular carcinoma |
| NAFLD: Non-alcoholic fatty liver disease | ||
| Oral Cavity | 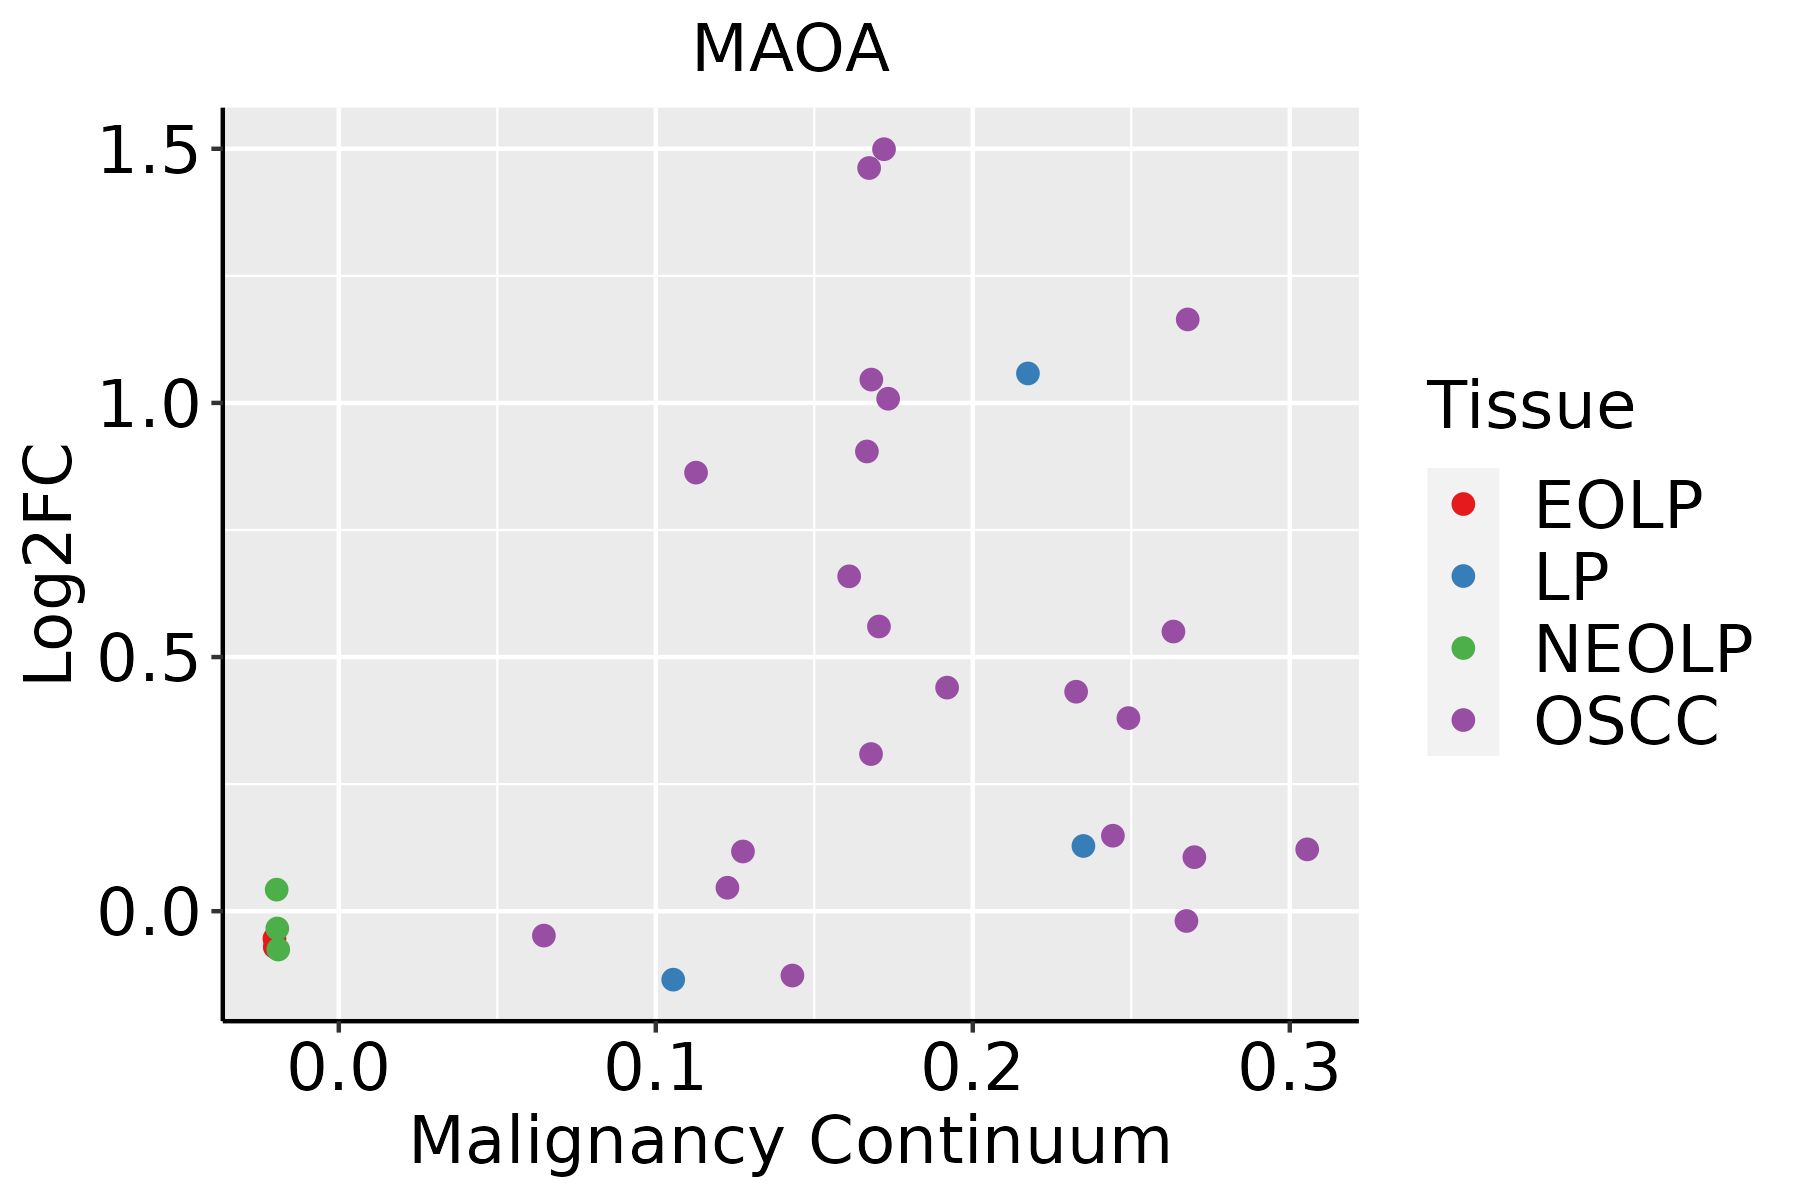 | EOLP: Erosive Oral lichen planus |
| LP: leukoplakia | ||
| NEOLP: Non-erosive oral lichen planus | ||
| OSCC: Oral squamous cell carcinoma | ||
| Prostate | 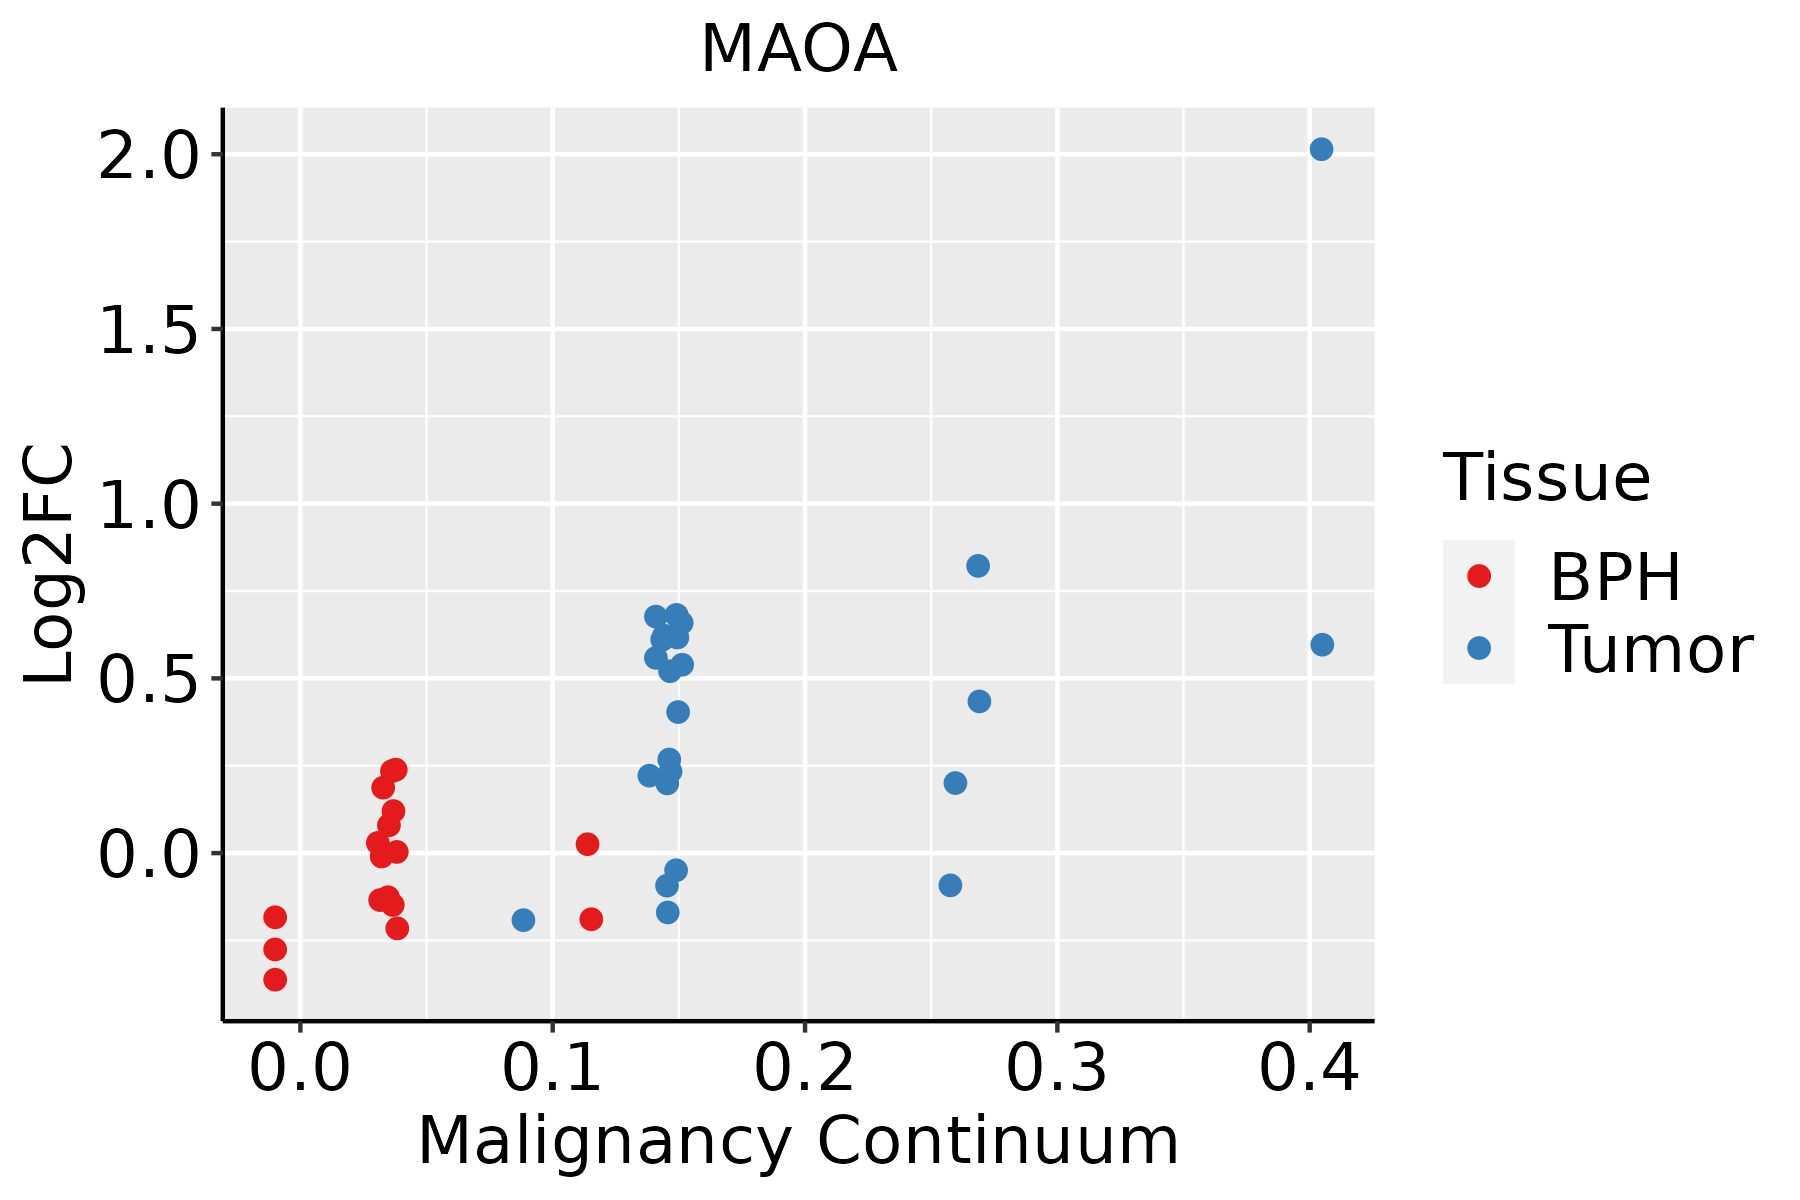 | BPH: Benign Prostatic Hyperplasia |
| Thyroid | 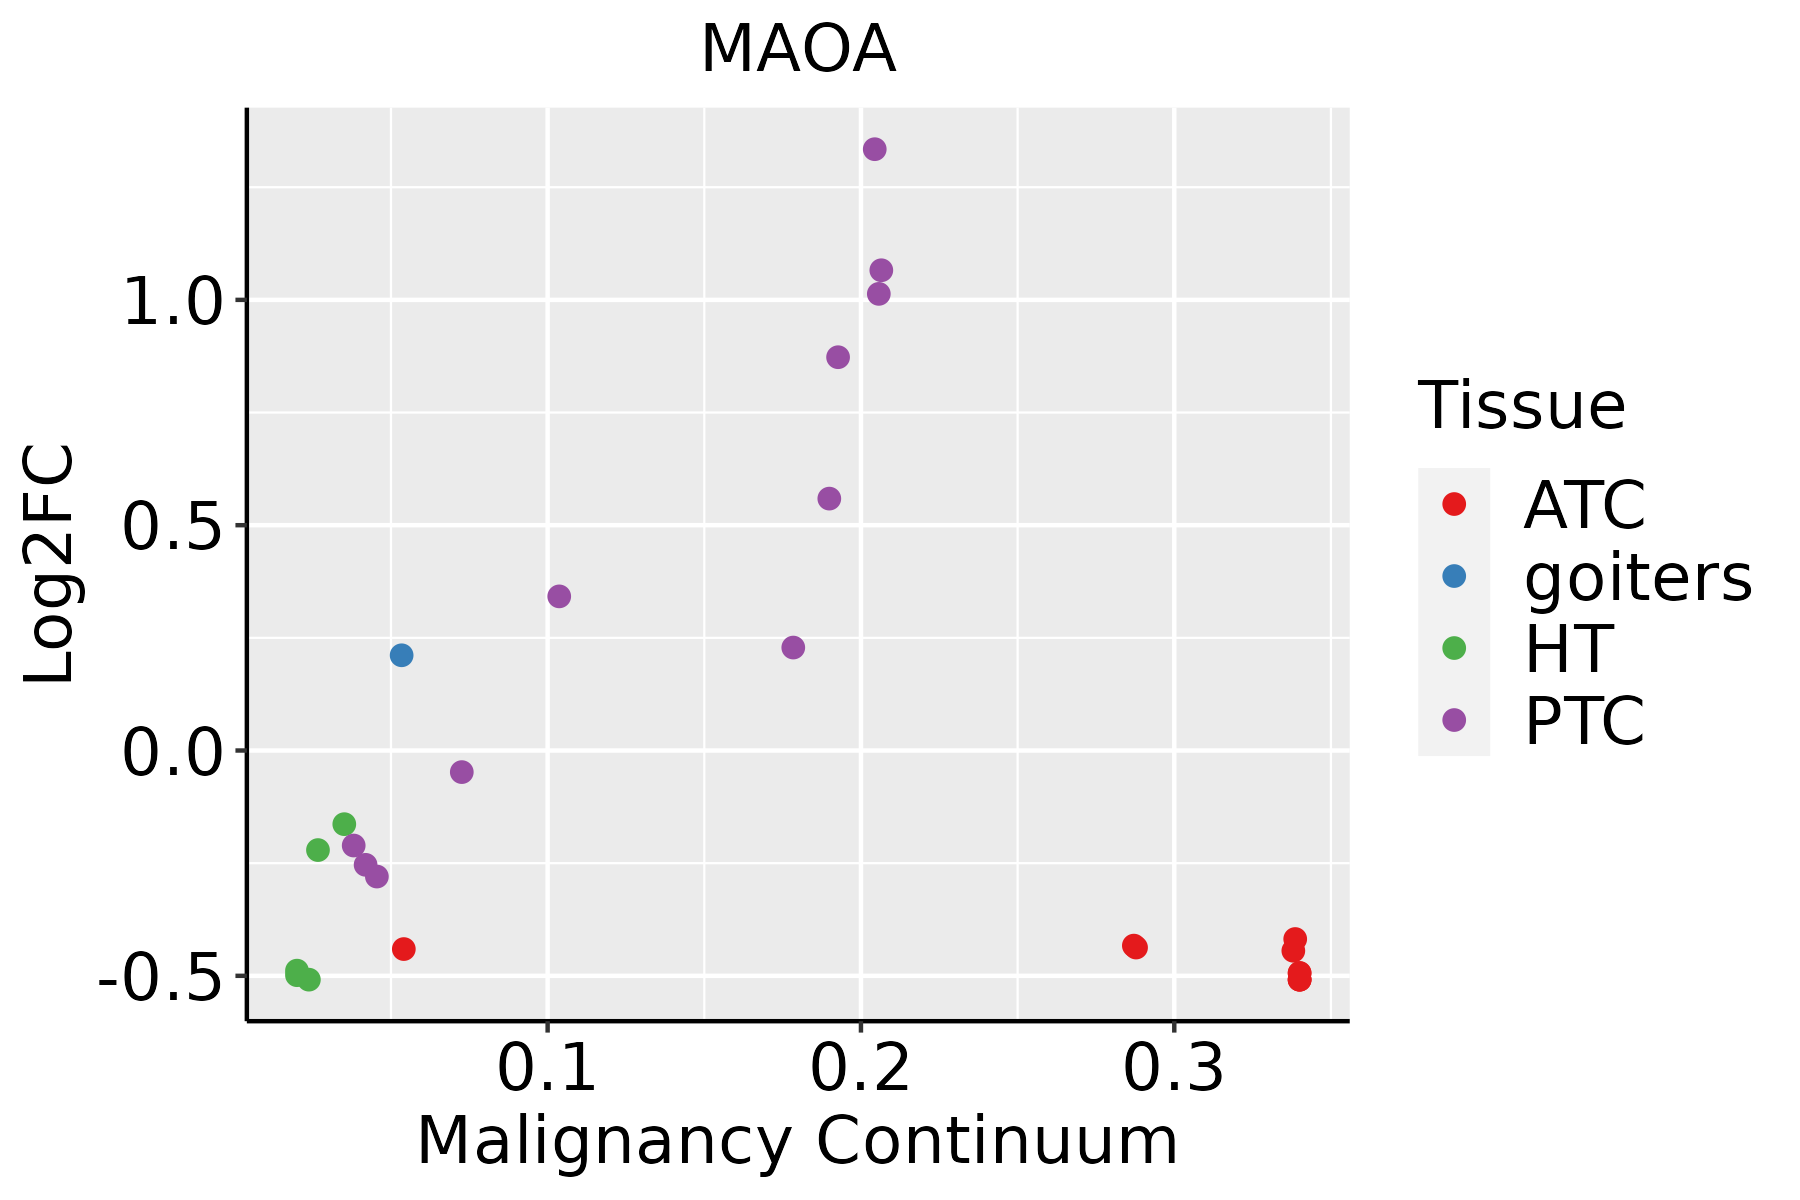 | ATC: Anaplastic thyroid cancer |
| HT: Hashimoto's thyroiditis | ||
| PTC: Papillary thyroid cancer |
| ∗log2FC in expression of this searched gene in stem-like cells from each diseased tissue sample relative to stem-like cells in normal samples in each tissue plotted against the malignancy continuum. Samples are colored based on if they are from different disease stage. |
Top |
Malignant transformation related pathway analysis |
| Find out the enriched GO biological processes and KEGG pathways involved in transition from healthy to precancer to cancer |
| Tissue | Disease Stage | Enriched GO biological Processes |
| Colorectum | AD |  |
| Colorectum | SER |  |
| Colorectum | MSS |  |
| Colorectum | MSI-H |  |
| Colorectum | FAP |  |
| ∗Top 15 enriched GO BP terms are showed in the bar plot of each disease state in each tissue. Each row represents a significant GO biological process which is colored according to the -log10(p.adjust). |
| Page: 1 2 3 4 5 6 7 8 9 |
| GO ID | Tissue | Disease Stage | Description | Gene Ratio | Bg Ratio | pvalue | p.adjust | Count |
| GO:0019439 | Colorectum | AD | aromatic compound catabolic process | 146/3918 | 467/18723 | 7.48e-08 | 3.84e-06 | 146 |
| GO:1901361 | Colorectum | AD | organic cyclic compound catabolic process | 153/3918 | 495/18723 | 8.23e-08 | 4.18e-06 | 153 |
| GO:19013611 | Colorectum | SER | organic cyclic compound catabolic process | 104/2897 | 495/18723 | 5.46e-04 | 7.63e-03 | 104 |
| GO:00194391 | Colorectum | SER | aromatic compound catabolic process | 98/2897 | 467/18723 | 8.09e-04 | 1.01e-02 | 98 |
| GO:19013612 | Colorectum | MSS | organic cyclic compound catabolic process | 148/3467 | 495/18723 | 3.47e-10 | 3.18e-08 | 148 |
| GO:00194392 | Colorectum | MSS | aromatic compound catabolic process | 140/3467 | 467/18723 | 8.56e-10 | 6.85e-08 | 140 |
| GO:00194394 | Colorectum | FAP | aromatic compound catabolic process | 100/2622 | 467/18723 | 6.75e-06 | 2.08e-04 | 100 |
| GO:19013614 | Colorectum | FAP | organic cyclic compound catabolic process | 101/2622 | 495/18723 | 4.87e-05 | 9.93e-04 | 101 |
| GO:00194395 | Colorectum | CRC | aromatic compound catabolic process | 77/2078 | 467/18723 | 2.42e-04 | 4.00e-03 | 77 |
| GO:19013615 | Colorectum | CRC | organic cyclic compound catabolic process | 80/2078 | 495/18723 | 3.52e-04 | 5.34e-03 | 80 |
| GO:001943917 | Esophagus | HGIN | aromatic compound catabolic process | 105/2587 | 467/18723 | 1.89e-07 | 9.31e-06 | 105 |
| GO:190136117 | Esophagus | HGIN | organic cyclic compound catabolic process | 106/2587 | 495/18723 | 1.94e-06 | 7.13e-05 | 106 |
| GO:001943918 | Esophagus | ESCC | aromatic compound catabolic process | 295/8552 | 467/18723 | 1.09e-14 | 5.98e-13 | 295 |
| GO:190136118 | Esophagus | ESCC | organic cyclic compound catabolic process | 307/8552 | 495/18723 | 9.99e-14 | 4.80e-12 | 307 |
| GO:190136111 | Liver | Cirrhotic | organic cyclic compound catabolic process | 213/4634 | 495/18723 | 1.58e-19 | 3.67e-17 | 213 |
| GO:001943911 | Liver | Cirrhotic | aromatic compound catabolic process | 202/4634 | 467/18723 | 6.93e-19 | 1.28e-16 | 202 |
| GO:00424021 | Liver | Cirrhotic | cellular biogenic amine catabolic process | 15/4634 | 27/18723 | 5.96e-04 | 4.63e-03 | 15 |
| GO:0044106 | Liver | Cirrhotic | cellular amine metabolic process | 43/4634 | 113/18723 | 1.15e-03 | 7.83e-03 | 43 |
| GO:00093101 | Liver | Cirrhotic | amine catabolic process | 15/4634 | 29/18723 | 1.59e-03 | 1.03e-02 | 15 |
| GO:0006576 | Liver | Cirrhotic | cellular biogenic amine metabolic process | 38/4634 | 101/18723 | 2.72e-03 | 1.59e-02 | 38 |
| Page: 1 2 |
| Pathway ID | Tissue | Disease Stage | Description | Gene Ratio | Bg Ratio | pvalue | p.adjust | qvalue | Count |
| hsa05012 | Colorectum | AD | Parkinson disease | 147/2092 | 266/8465 | 2.53e-27 | 8.48e-25 | 5.41e-25 | 147 |
| hsa00330 | Colorectum | AD | Arginine and proline metabolism | 23/2092 | 50/8465 | 8.27e-04 | 5.90e-03 | 3.76e-03 | 23 |
| hsa04728 | Colorectum | AD | Dopaminergic synapse | 46/2092 | 132/8465 | 5.55e-03 | 2.48e-02 | 1.58e-02 | 46 |
| hsa050121 | Colorectum | AD | Parkinson disease | 147/2092 | 266/8465 | 2.53e-27 | 8.48e-25 | 5.41e-25 | 147 |
| hsa003301 | Colorectum | AD | Arginine and proline metabolism | 23/2092 | 50/8465 | 8.27e-04 | 5.90e-03 | 3.76e-03 | 23 |
| hsa047281 | Colorectum | AD | Dopaminergic synapse | 46/2092 | 132/8465 | 5.55e-03 | 2.48e-02 | 1.58e-02 | 46 |
| hsa050122 | Colorectum | SER | Parkinson disease | 132/1580 | 266/8465 | 2.72e-31 | 9.03e-29 | 6.55e-29 | 132 |
| hsa047282 | Colorectum | SER | Dopaminergic synapse | 37/1580 | 132/8465 | 5.27e-03 | 3.28e-02 | 2.38e-02 | 37 |
| hsa003302 | Colorectum | SER | Arginine and proline metabolism | 17/1580 | 50/8465 | 7.12e-03 | 3.77e-02 | 2.74e-02 | 17 |
| hsa050123 | Colorectum | SER | Parkinson disease | 132/1580 | 266/8465 | 2.72e-31 | 9.03e-29 | 6.55e-29 | 132 |
| hsa047283 | Colorectum | SER | Dopaminergic synapse | 37/1580 | 132/8465 | 5.27e-03 | 3.28e-02 | 2.38e-02 | 37 |
| hsa003303 | Colorectum | SER | Arginine and proline metabolism | 17/1580 | 50/8465 | 7.12e-03 | 3.77e-02 | 2.74e-02 | 17 |
| hsa050124 | Colorectum | MSS | Parkinson disease | 140/1875 | 266/8465 | 2.32e-28 | 7.79e-26 | 4.77e-26 | 140 |
| hsa003304 | Colorectum | MSS | Arginine and proline metabolism | 23/1875 | 50/8465 | 1.52e-04 | 1.24e-03 | 7.61e-04 | 23 |
| hsa047284 | Colorectum | MSS | Dopaminergic synapse | 45/1875 | 132/8465 | 1.02e-03 | 5.94e-03 | 3.64e-03 | 45 |
| hsa050125 | Colorectum | MSS | Parkinson disease | 140/1875 | 266/8465 | 2.32e-28 | 7.79e-26 | 4.77e-26 | 140 |
| hsa003305 | Colorectum | MSS | Arginine and proline metabolism | 23/1875 | 50/8465 | 1.52e-04 | 1.24e-03 | 7.61e-04 | 23 |
| hsa047285 | Colorectum | MSS | Dopaminergic synapse | 45/1875 | 132/8465 | 1.02e-03 | 5.94e-03 | 3.64e-03 | 45 |
| hsa050128 | Colorectum | FAP | Parkinson disease | 80/1404 | 266/8465 | 2.04e-08 | 6.20e-07 | 3.77e-07 | 80 |
| hsa047286 | Colorectum | FAP | Dopaminergic synapse | 34/1404 | 132/8465 | 4.59e-03 | 1.89e-02 | 1.15e-02 | 34 |
| Page: 1 2 3 4 |
Top |
Cell-cell communication analysis |
| Identification of potential cell-cell interactions between two cell types and their ligand-receptor pairs for different disease states |
| Ligand | Receptor | LRpair | Pathway | Tissue | Disease Stage |
| Page: 1 |
Top |
Single-cell gene regulatory network inference analysis |
| Find out the significant the regulons (TFs) and the target genes of each regulon across cell types for different disease states |
| TF | Cell Type | Tissue | Disease Stage | Target Gene | RSS | Regulon Activity |
| ∗The dot plots of a searched regulon are shown for all cell subpopulations in each disease state of each tissue based on the regulon specific score inferred using pySCENIC and by calculating the average expression. |
| Page: 1 |
Top |
Somatic mutation of malignant transformation related genes |
| Annotation of somatic variants for genes involved in malignant transformation |
| Hugo Symbol | Variant Class | Variant Classification | dbSNP RS | HGVSc | HGVSp | HGVSp Short | SWISSPROT | BIOTYPE | SIFT | PolyPhen | Tumor Sample Barcode | Tissue | Histology | Sex | Age | Stage | Therapy Types | Drugs | Outcome |
| MAOA | SNV | Missense_Mutation | novel | c.458A>C | p.Asp153Ala | p.D153A | P21397 | protein_coding | deleterious(0.02) | probably_damaging(0.967) | TCGA-A7-A0CJ-01 | Breast | breast invasive carcinoma | Female | <65 | I/II | Chemotherapy | cytoxan | SD |
| MAOA | SNV | Missense_Mutation | rs772520550 | c.760N>G | p.Ile254Val | p.I254V | P21397 | protein_coding | tolerated(1) | benign(0) | TCGA-AR-A1AK-01 | Breast | breast invasive carcinoma | Female | >=65 | I/II | Hormone Therapy | anastrozole | SD |
| MAOA | insertion | Nonsense_Mutation | novel | c.456_457insATTCTTTACATCAGGCATAGTCTGTAGTCTA | p.Asp153IlefsTer9 | p.D153Ifs*9 | P21397 | protein_coding | TCGA-A7-A0CJ-01 | Breast | breast invasive carcinoma | Female | <65 | I/II | Chemotherapy | cytoxan | SD | ||
| MAOA | insertion | Nonsense_Mutation | novel | c.381_382insATGGGTCTCTTCTTAGATGATTTTAAAATTTAAAGCA | p.Trp128MetfsTer11 | p.W128Mfs*11 | P21397 | protein_coding | TCGA-B6-A0I5-01 | Breast | breast invasive carcinoma | Female | <65 | I/II | Unknown | Unknown | SD | ||
| MAOA | insertion | Frame_Shift_Ins | novel | c.1267_1268insT | p.Arg424SerfsTer27 | p.R424Sfs*27 | P21397 | protein_coding | TCGA-BH-A0H9-01 | Breast | breast invasive carcinoma | Female | >=65 | I/II | Hormone Therapy | arimidex | SD | ||
| MAOA | SNV | Missense_Mutation | c.59N>A | p.Gly20Glu | p.G20E | P21397 | protein_coding | deleterious(0) | probably_damaging(0.998) | TCGA-DR-A0ZM-01 | Cervix | cervical & endocervical cancer | Female | <65 | III/IV | Unspecific | Cisplatin | SD | |
| MAOA | SNV | Missense_Mutation | novel | c.1018N>C | p.Thr340Pro | p.T340P | P21397 | protein_coding | deleterious(0) | probably_damaging(0.946) | TCGA-ZJ-AAXU-01 | Cervix | cervical & endocervical cancer | Female | <65 | I/II | Unknown | Unknown | SD |
| MAOA | SNV | Missense_Mutation | c.572N>T | p.Ala191Val | p.A191V | P21397 | protein_coding | tolerated(0.36) | benign(0.003) | TCGA-AA-A02R-01 | Colorectum | colon adenocarcinoma | Female | >=65 | I/II | Unknown | Unknown | PD | |
| MAOA | deletion | Frame_Shift_Del | c.1210delN | p.Gly405AlafsTer12 | p.G405Afs*12 | P21397 | protein_coding | TCGA-AA-3672-01 | Colorectum | colon adenocarcinoma | Female | >=65 | III/IV | Unknown | Unknown | SD | |||
| MAOA | insertion | In_Frame_Ins | novel | c.1194_1195insGAG | p.Glu400dup | p.E400dup | P21397 | protein_coding | TCGA-AG-3742-01 | Colorectum | rectum adenocarcinoma | Female | >=65 | I/II | Unknown | Unknown | SD |
| Page: 1 2 3 4 5 |
Top |
Related drugs of malignant transformation related genes |
| Identification of chemicals and drugs interact with genes involved in malignant transfromation |
| (DGIdb 4.0) |
| Entrez ID | Symbol | Category | Interaction Types | Drug Claim Name | Drug Name | PMIDs |
| 4128 | MAOA | DRUGGABLE GENOME, ENZYME | Cyclic peptide derivative 1 | |||
| 4128 | MAOA | DRUGGABLE GENOME, ENZYME | inhibitor | CHEMBL1200895 | PHENELZINE SULFATE | |
| 4128 | MAOA | DRUGGABLE GENOME, ENZYME | Tarnylcypromine derivative 3 | |||
| 4128 | MAOA | DRUGGABLE GENOME, ENZYME | PMID25399762-Compound-Figure3-Lycojaponicumin C | |||
| 4128 | MAOA | DRUGGABLE GENOME, ENZYME | METHAMPHETAMINE | METHAMPHETAMINE | ||
| 4128 | MAOA | DRUGGABLE GENOME, ENZYME | Heteroaryl-cyclopropylamine derivative 1 | |||
| 4128 | MAOA | DRUGGABLE GENOME, ENZYME | Psoralen | PSORALEN | ||
| 4128 | MAOA | DRUGGABLE GENOME, ENZYME | 8-{[(4-BROMOPHENYL)METHYL]SULFANYL}CAFFEINE | CHEMBL1927670 | 22055712 | |
| 4128 | MAOA | DRUGGABLE GENOME, ENZYME | IncarviatoneA | |||
| 4128 | MAOA | DRUGGABLE GENOME, ENZYME | Tetra-hydro-isoquinoline derivative 3 |
| Page: 1 2 3 4 5 6 7 8 9 |

Copyright 2023-Present -The University of Texas Health Science Center at Houston |