
|
|||||
|
 | |
| |
| |
| |
| |
| |
|
Gene: MANF |
Gene summary for MANF |
| Gene information | Species | Human | Gene symbol | MANF | Gene ID | 7873 |
| Gene name | mesencephalic astrocyte derived neurotrophic factor | |
| Gene Alias | ARMET | |
| Cytomap | 3p21.2 | |
| Gene Type | protein-coding | GO ID | GO:0006950 | UniProtAcc | A8K878 |
Top |
Malignant transformation analysis |
| Identification of the aberrant gene expression in precancerous and cancerous lesions by comparing the gene expression of stem-like cells in diseased tissues with normal stem cells |
| Entrez ID | Symbol | Replicates | Species | Organ | Tissue | Adj P-value | Log2FC | Malignancy |
| 7873 | MANF | GSM4909281 | Human | Breast | IDC | 6.59e-30 | 7.53e-01 | 0.21 |
| 7873 | MANF | GSM4909293 | Human | Breast | IDC | 9.98e-03 | -1.88e-01 | 0.1581 |
| 7873 | MANF | GSM4909294 | Human | Breast | IDC | 2.02e-02 | -2.44e-01 | 0.2022 |
| 7873 | MANF | GSM4909296 | Human | Breast | IDC | 8.44e-07 | -9.67e-02 | 0.1524 |
| 7873 | MANF | GSM4909297 | Human | Breast | IDC | 1.09e-06 | -6.39e-02 | 0.1517 |
| 7873 | MANF | GSM4909311 | Human | Breast | IDC | 1.00e-18 | -2.67e-01 | 0.1534 |
| 7873 | MANF | GSM4909312 | Human | Breast | IDC | 1.41e-06 | -9.44e-02 | 0.1552 |
| 7873 | MANF | GSM4909315 | Human | Breast | IDC | 1.56e-02 | -2.30e-01 | 0.21 |
| 7873 | MANF | GSM4909319 | Human | Breast | IDC | 1.38e-25 | -1.37e-01 | 0.1563 |
| 7873 | MANF | GSM4909320 | Human | Breast | IDC | 6.45e-03 | 2.65e-02 | 0.1575 |
| 7873 | MANF | GSM4909321 | Human | Breast | IDC | 3.20e-08 | 1.94e-02 | 0.1559 |
| 7873 | MANF | brca1 | Human | Breast | Precancer | 3.42e-04 | 4.35e-01 | -0.0338 |
| 7873 | MANF | brca2 | Human | Breast | Precancer | 9.60e-06 | 3.62e-01 | -0.024 |
| 7873 | MANF | brca3 | Human | Breast | Precancer | 1.20e-02 | 2.94e-01 | -0.0263 |
| 7873 | MANF | NCCBC14 | Human | Breast | DCIS | 1.86e-10 | -1.94e-01 | 0.2021 |
| 7873 | MANF | NCCBC5 | Human | Breast | DCIS | 1.83e-05 | -1.95e-01 | 0.2046 |
| 7873 | MANF | P1 | Human | Breast | IDC | 1.17e-07 | -3.15e-01 | 0.1527 |
| 7873 | MANF | DCIS2 | Human | Breast | DCIS | 8.43e-49 | 1.90e-01 | 0.0085 |
| 7873 | MANF | CA_HPV_1 | Human | Cervix | CC | 6.81e-03 | -1.37e-01 | 0.0264 |
| 7873 | MANF | CCI_1 | Human | Cervix | CC | 8.24e-06 | -5.45e-01 | 0.528 |
| Page: 1 2 3 4 5 6 7 8 9 10 11 |
| Tissue | Expression Dynamics | Abbreviation |
| Breast |  | IDC: Invasive ductal carcinoma |
| DCIS: Ductal carcinoma in situ | ||
| Precancer(BRCA1-mut): Precancerous lesion from BRCA1 mutation carriers | ||
| Cervix |  | CC: Cervix cancer |
| HSIL_HPV: HPV-infected high-grade squamous intraepithelial lesions | ||
| N_HPV: HPV-infected normal cervix | ||
| Colorectum (GSE201348) |  | FAP: Familial adenomatous polyposis |
| CRC: Colorectal cancer | ||
| Colorectum (HTA11) |  | AD: Adenomas |
| SER: Sessile serrated lesions | ||
| MSI-H: Microsatellite-high colorectal cancer | ||
| MSS: Microsatellite stable colorectal cancer | ||
| Endometrium |  | AEH: Atypical endometrial hyperplasia |
| EEC: Endometrioid Cancer | ||
| Esophagus |  | ESCC: Esophageal squamous cell carcinoma |
| HGIN: High-grade intraepithelial neoplasias | ||
| LGIN: Low-grade intraepithelial neoplasias | ||
| Liver |  | HCC: Hepatocellular carcinoma |
| NAFLD: Non-alcoholic fatty liver disease | ||
| Oral Cavity | 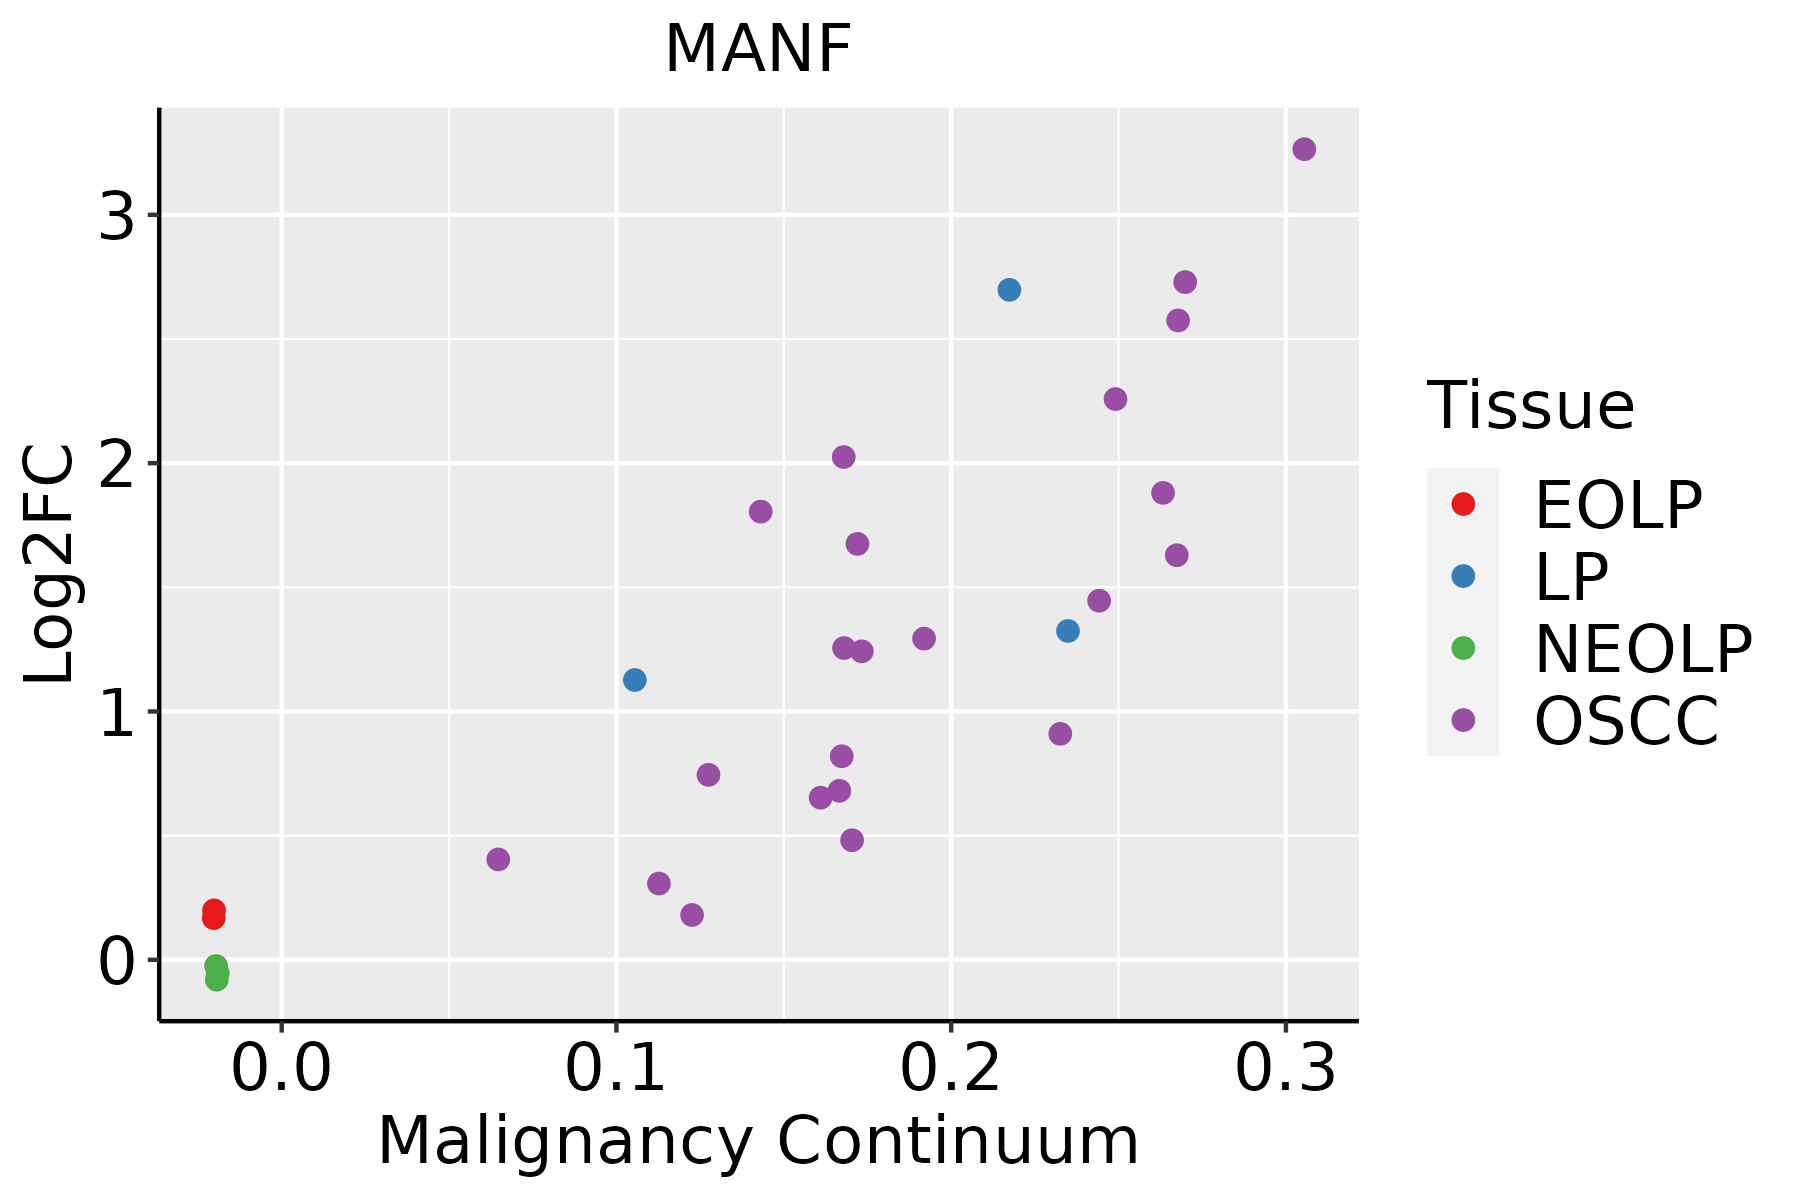 | EOLP: Erosive Oral lichen planus |
| LP: leukoplakia | ||
| NEOLP: Non-erosive oral lichen planus | ||
| OSCC: Oral squamous cell carcinoma | ||
| Prostate | 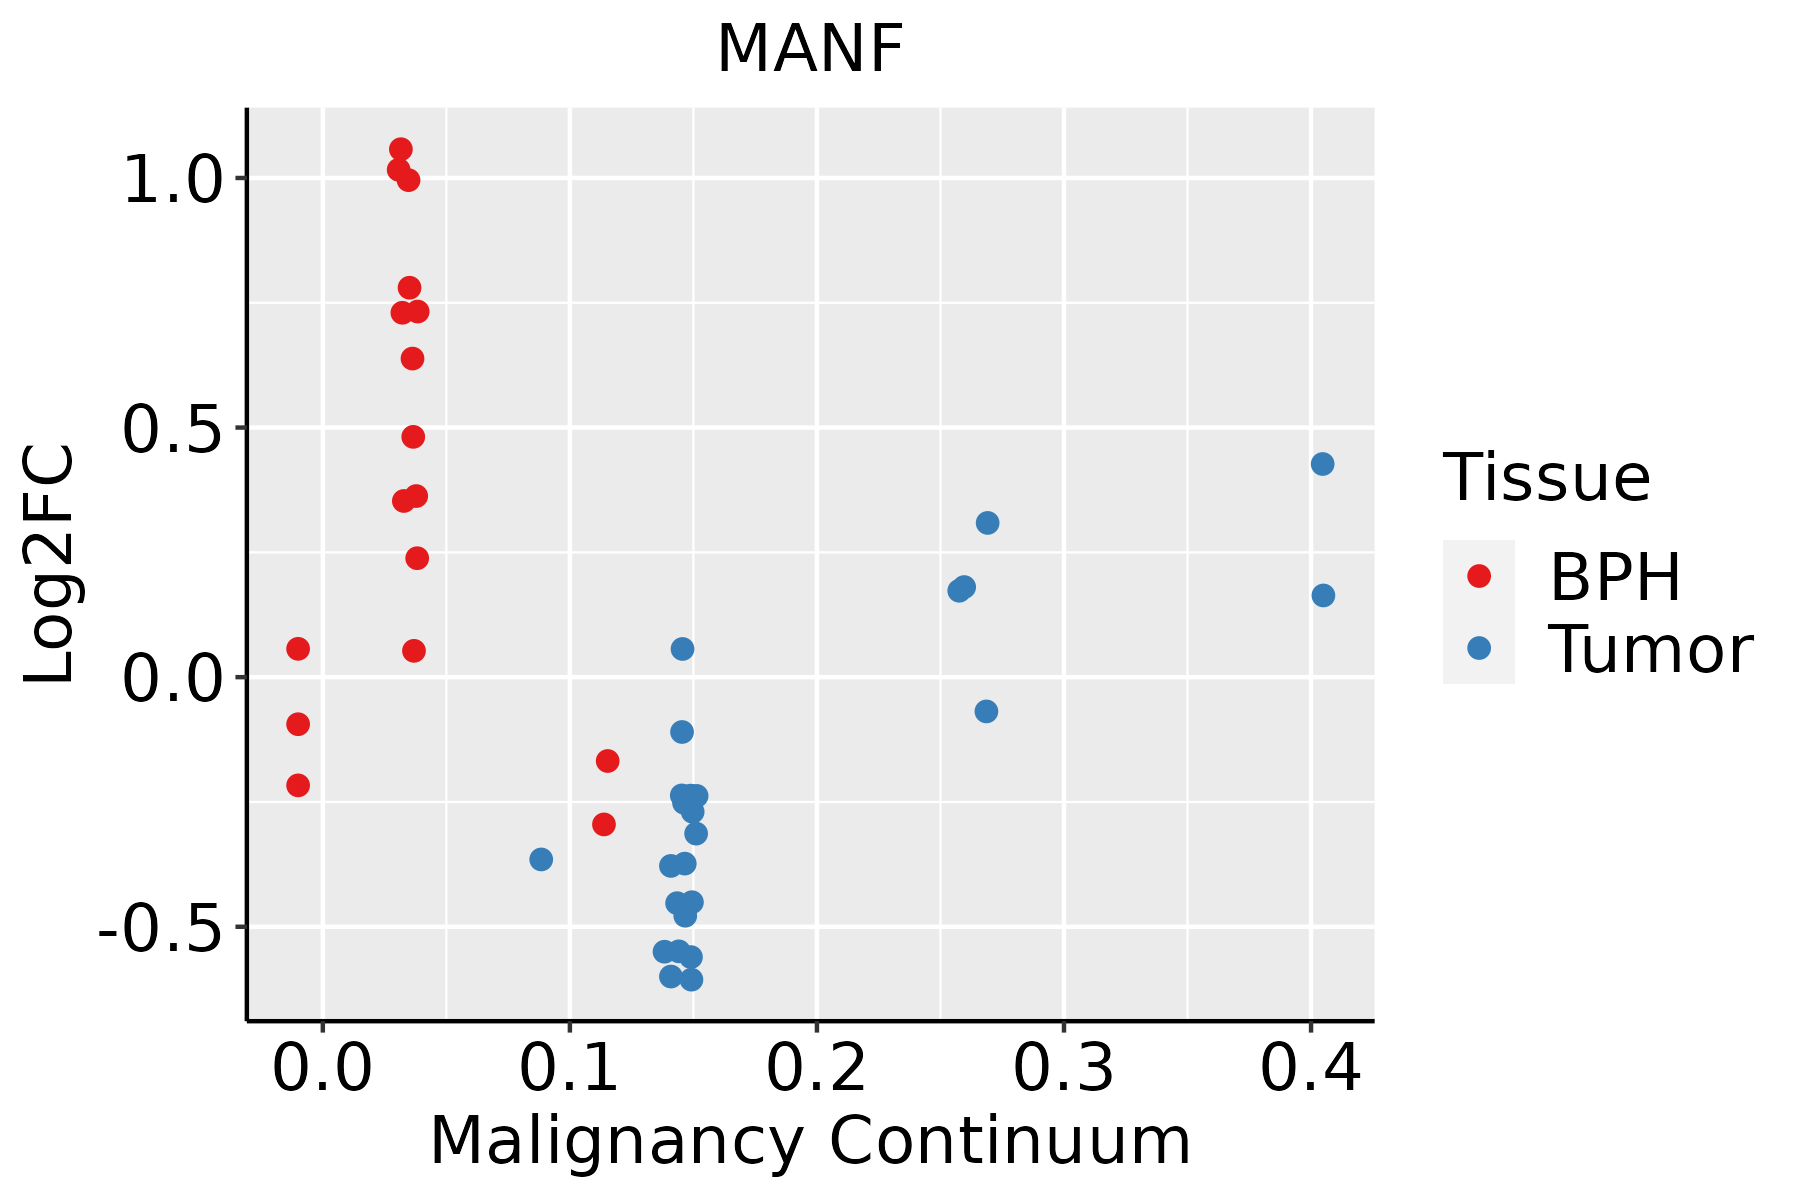 | BPH: Benign Prostatic Hyperplasia |
| Skin | 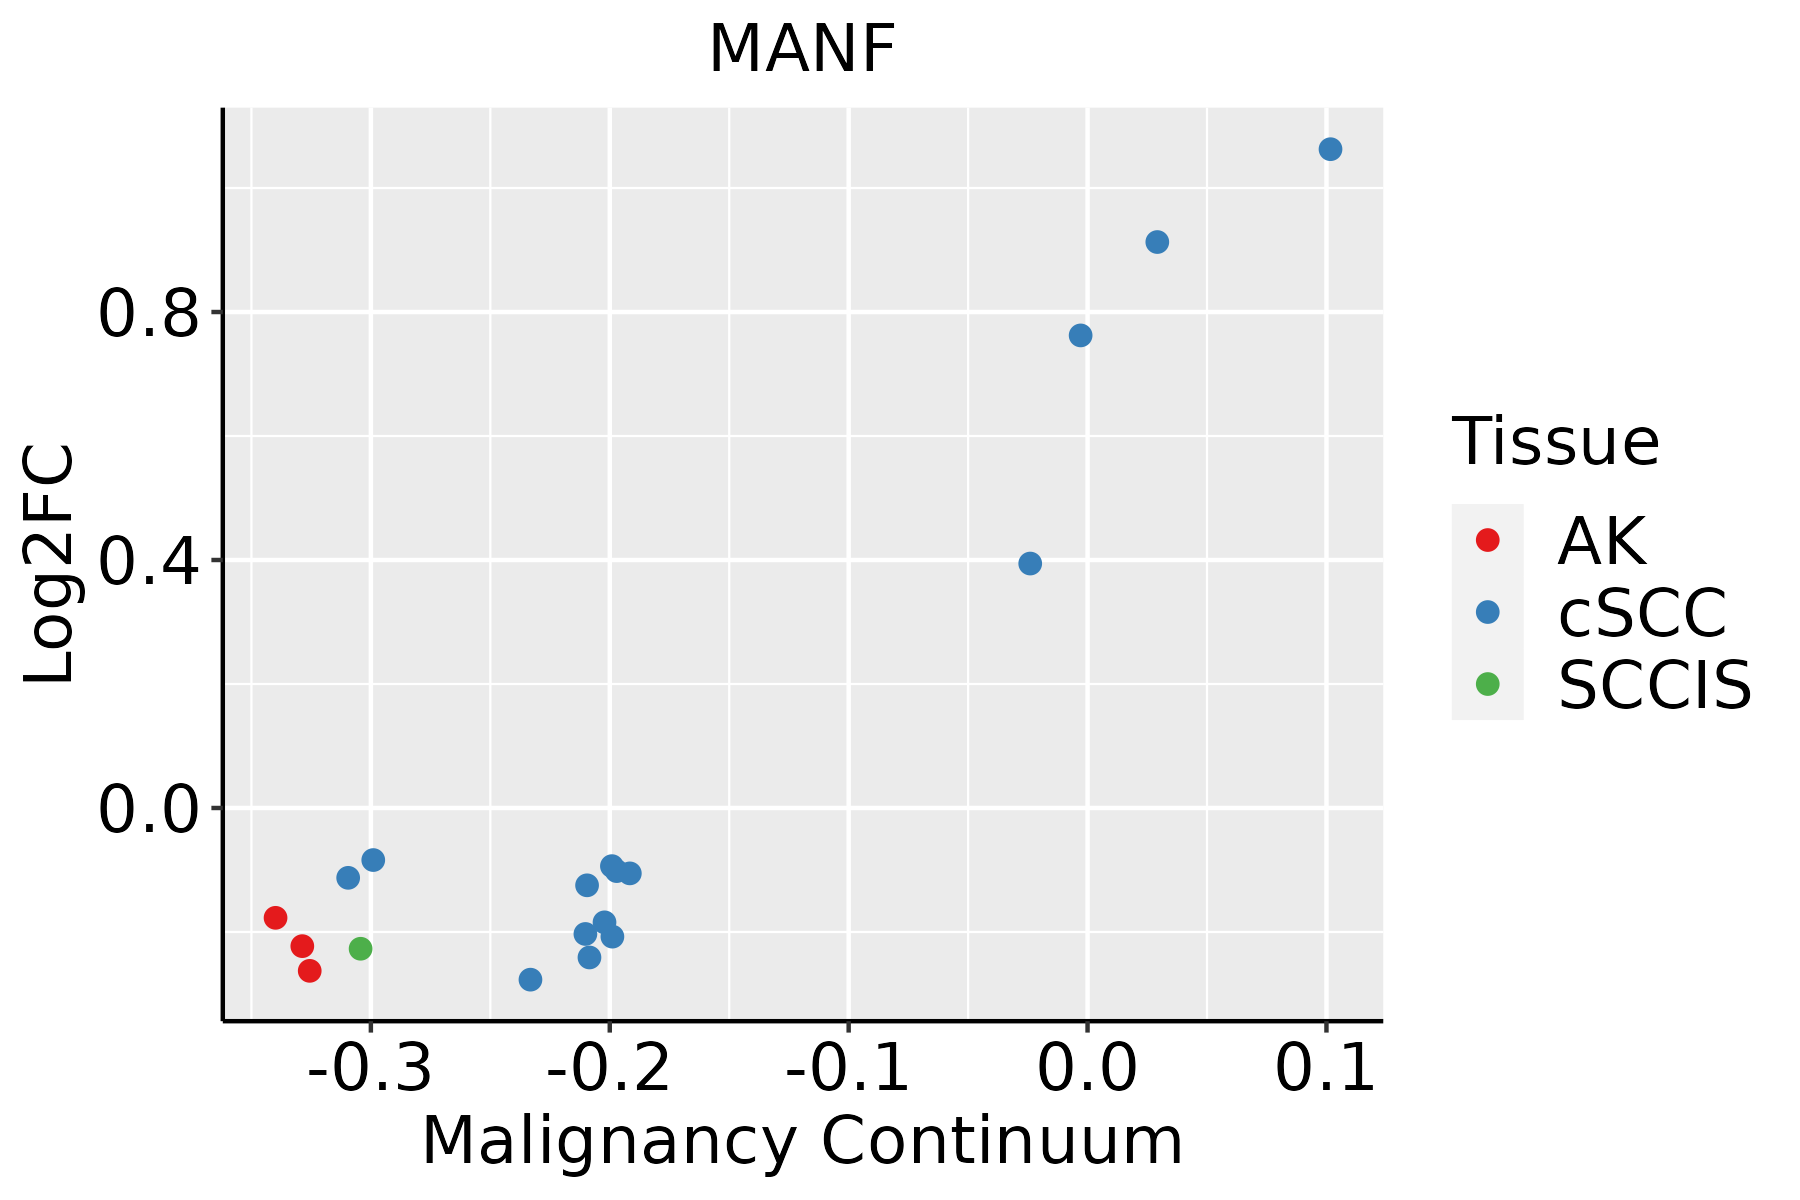 | AK: Actinic keratosis |
| cSCC: Cutaneous squamous cell carcinoma | ||
| SCCIS:squamous cell carcinoma in situ | ||
| Thyroid |  | ATC: Anaplastic thyroid cancer |
| HT: Hashimoto's thyroiditis | ||
| PTC: Papillary thyroid cancer |
| ∗log2FC in expression of this searched gene in stem-like cells from each diseased tissue sample relative to stem-like cells in normal samples in each tissue plotted against the malignancy continuum. Samples are colored based on if they are from different disease stage. |
Top |
Malignant transformation related pathway analysis |
| Find out the enriched GO biological processes and KEGG pathways involved in transition from healthy to precancer to cancer |
| Tissue | Disease Stage | Enriched GO biological Processes |
| Colorectum | AD |  |
| Colorectum | SER |  |
| Colorectum | MSS |  |
| Colorectum | MSI-H |  |
| Colorectum | FAP |  |
| ∗Top 15 enriched GO BP terms are showed in the bar plot of each disease state in each tissue. Each row represents a significant GO biological process which is colored according to the -log10(p.adjust). |
| Page: 1 2 3 4 5 6 7 8 9 |
| GO ID | Tissue | Disease Stage | Description | Gene Ratio | Bg Ratio | pvalue | p.adjust | Count |
| GO:00069869 | Breast | Precancer | response to unfolded protein | 28/1080 | 137/18723 | 3.81e-09 | 3.00e-07 | 28 |
| GO:00359669 | Breast | Precancer | response to topologically incorrect protein | 29/1080 | 159/18723 | 3.00e-08 | 1.89e-06 | 29 |
| GO:00349769 | Breast | Precancer | response to endoplasmic reticulum stress | 38/1080 | 256/18723 | 7.89e-08 | 4.60e-06 | 38 |
| GO:19058979 | Breast | Precancer | regulation of response to endoplasmic reticulum stress | 16/1080 | 82/18723 | 1.53e-05 | 3.75e-04 | 16 |
| GO:000698614 | Breast | IDC | response to unfolded protein | 30/1434 | 137/18723 | 1.24e-07 | 7.03e-06 | 30 |
| GO:003596614 | Breast | IDC | response to topologically incorrect protein | 32/1434 | 159/18723 | 3.71e-07 | 1.85e-05 | 32 |
| GO:003497614 | Breast | IDC | response to endoplasmic reticulum stress | 43/1434 | 256/18723 | 8.42e-07 | 3.82e-05 | 43 |
| GO:190589714 | Breast | IDC | regulation of response to endoplasmic reticulum stress | 19/1434 | 82/18723 | 1.04e-05 | 2.87e-04 | 19 |
| GO:000698622 | Breast | DCIS | response to unfolded protein | 30/1390 | 137/18723 | 6.24e-08 | 3.72e-06 | 30 |
| GO:003596622 | Breast | DCIS | response to topologically incorrect protein | 32/1390 | 159/18723 | 1.84e-07 | 9.15e-06 | 32 |
| GO:003497622 | Breast | DCIS | response to endoplasmic reticulum stress | 43/1390 | 256/18723 | 3.65e-07 | 1.71e-05 | 43 |
| GO:190589722 | Breast | DCIS | regulation of response to endoplasmic reticulum stress | 19/1390 | 82/18723 | 6.65e-06 | 1.86e-04 | 19 |
| GO:190589710 | Cervix | CC | regulation of response to endoplasmic reticulum stress | 27/2311 | 82/18723 | 9.24e-07 | 3.25e-05 | 27 |
| GO:003497610 | Cervix | CC | response to endoplasmic reticulum stress | 57/2311 | 256/18723 | 5.81e-06 | 1.42e-04 | 57 |
| GO:000698610 | Cervix | CC | response to unfolded protein | 36/2311 | 137/18723 | 6.83e-06 | 1.63e-04 | 36 |
| GO:003596610 | Cervix | CC | response to topologically incorrect protein | 39/2311 | 159/18723 | 1.68e-05 | 3.22e-04 | 39 |
| GO:0034976 | Colorectum | AD | response to endoplasmic reticulum stress | 90/3918 | 256/18723 | 8.48e-08 | 4.28e-06 | 90 |
| GO:0035966 | Colorectum | AD | response to topologically incorrect protein | 54/3918 | 159/18723 | 8.85e-05 | 1.36e-03 | 54 |
| GO:1905897 | Colorectum | AD | regulation of response to endoplasmic reticulum stress | 32/3918 | 82/18723 | 1.37e-04 | 1.95e-03 | 32 |
| GO:0006986 | Colorectum | AD | response to unfolded protein | 45/3918 | 137/18723 | 7.43e-04 | 7.48e-03 | 45 |
| Page: 1 2 3 4 5 |
| Pathway ID | Tissue | Disease Stage | Description | Gene Ratio | Bg Ratio | pvalue | p.adjust | qvalue | Count |
| Page: 1 |
Top |
Cell-cell communication analysis |
| Identification of potential cell-cell interactions between two cell types and their ligand-receptor pairs for different disease states |
| Ligand | Receptor | LRpair | Pathway | Tissue | Disease Stage |
| Page: 1 |
Top |
Single-cell gene regulatory network inference analysis |
| Find out the significant the regulons (TFs) and the target genes of each regulon across cell types for different disease states |
| TF | Cell Type | Tissue | Disease Stage | Target Gene | RSS | Regulon Activity |
| ∗The dot plots of a searched regulon are shown for all cell subpopulations in each disease state of each tissue based on the regulon specific score inferred using pySCENIC and by calculating the average expression. |
| Page: 1 |
Top |
Somatic mutation of malignant transformation related genes |
| Annotation of somatic variants for genes involved in malignant transformation |
| Hugo Symbol | Variant Class | Variant Classification | dbSNP RS | HGVSc | HGVSp | HGVSp Short | SWISSPROT | BIOTYPE | SIFT | PolyPhen | Tumor Sample Barcode | Tissue | Histology | Sex | Age | Stage | Therapy Types | Drugs | Outcome |
| MANF | SNV | Missense_Mutation | c.184G>C | p.Glu62Gln | p.E62Q | protein_coding | tolerated(0.06) | possibly_damaging(0.849) | TCGA-IR-A3LA-01 | Cervix | cervical & endocervical cancer | Female | <65 | I/II | Chemotherapy | cisplatin | CR | ||
| MANF | SNV | Missense_Mutation | c.365N>C | p.Leu122Pro | p.L122P | protein_coding | deleterious(0) | probably_damaging(1) | TCGA-AY-6197-01 | Colorectum | colon adenocarcinoma | Male | <65 | I/II | Unknown | Unknown | SD | ||
| MANF | deletion | Frame_Shift_Del | c.454delG | p.Glu152ArgfsTer16 | p.E152Rfs*16 | protein_coding | TCGA-AA-3949-01 | Colorectum | colon adenocarcinoma | Female | >=65 | III/IV | Unknown | Unknown | SD | ||||
| MANF | SNV | Missense_Mutation | novel | c.416N>A | p.Arg139Gln | p.R139Q | protein_coding | deleterious(0) | benign(0.003) | TCGA-A5-A0GG-01 | Endometrium | uterine corpus endometrioid carcinoma | Female | >=65 | I/II | Unknown | Unknown | SD | |
| MANF | SNV | Missense_Mutation | novel | c.520N>C | p.Tyr174His | p.Y174H | protein_coding | tolerated(0.23) | probably_damaging(0.998) | TCGA-B5-A3FA-01 | Endometrium | uterine corpus endometrioid carcinoma | Female | >=65 | I/II | Unknown | Unknown | SD | |
| MANF | SNV | Missense_Mutation | novel | c.552N>G | p.Asp184Glu | p.D184E | protein_coding | tolerated(0.79) | benign(0.005) | TCGA-EO-A3B0-01 | Endometrium | uterine corpus endometrioid carcinoma | Female | <65 | III/IV | Unknown | Unknown | SD | |
| MANF | insertion | Frame_Shift_Ins | novel | c.523_524insC | p.Lys177GlnfsTer35 | p.K177Qfs*35 | protein_coding | TCGA-DF-A2KY-01 | Endometrium | uterine corpus endometrioid carcinoma | Female | <65 | III/IV | Chemotherapy | carboplatin | SD | |||
| MANF | SNV | Missense_Mutation | c.541N>A | p.Ala181Thr | p.A181T | protein_coding | tolerated(0.18) | benign(0.067) | TCGA-G3-A3CK-01 | Liver | liver hepatocellular carcinoma | Male | <65 | I/II | Unknown | Unknown | SD | ||
| MANF | SNV | Missense_Mutation | novel | c.551N>C | p.Asp184Ala | p.D184A | protein_coding | deleterious(0.01) | benign(0.207) | TCGA-37-4132-01 | Lung | lung squamous cell carcinoma | Female | <65 | III/IV | Unknown | Unknown | SD | |
| MANF | SNV | Missense_Mutation | novel | c.274N>G | p.Ile92Val | p.I92V | protein_coding | tolerated(0.14) | benign(0.005) | TCGA-68-7755-01 | Lung | lung squamous cell carcinoma | Female | <65 | I/II | Unspecific | SD |
| Page: 1 2 |
Top |
Related drugs of malignant transformation related genes |
| Identification of chemicals and drugs interact with genes involved in malignant transfromation |
| (DGIdb 4.0) |
| Entrez ID | Symbol | Category | Interaction Types | Drug Claim Name | Drug Name | PMIDs |
| Page: 1 |

Copyright 2023-Present -The University of Texas Health Science Center at Houston |