
|
|||||
|
 | |
| |
| |
| |
| |
| |
|
Gene: MANBA |
Gene summary for MANBA |
| Gene information | Species | Human | Gene symbol | MANBA | Gene ID | 4126 |
| Gene name | mannosidase beta | |
| Gene Alias | MANB1 | |
| Cytomap | 4q24 | |
| Gene Type | protein-coding | GO ID | GO:0005975 | UniProtAcc | O00462 |
Top |
Malignant transformation analysis |
| Identification of the aberrant gene expression in precancerous and cancerous lesions by comparing the gene expression of stem-like cells in diseased tissues with normal stem cells |
| Entrez ID | Symbol | Replicates | Species | Organ | Tissue | Adj P-value | Log2FC | Malignancy |
| 4126 | MANBA | LZE7T | Human | Esophagus | ESCC | 7.20e-05 | 2.44e-01 | 0.0667 |
| 4126 | MANBA | LZE24T | Human | Esophagus | ESCC | 1.03e-12 | 3.76e-01 | 0.0596 |
| 4126 | MANBA | P1T-E | Human | Esophagus | ESCC | 6.78e-03 | 1.65e-01 | 0.0875 |
| 4126 | MANBA | P2T-E | Human | Esophagus | ESCC | 2.36e-07 | 1.45e-01 | 0.1177 |
| 4126 | MANBA | P4T-E | Human | Esophagus | ESCC | 2.45e-14 | 3.97e-01 | 0.1323 |
| 4126 | MANBA | P5T-E | Human | Esophagus | ESCC | 1.04e-02 | 1.28e-01 | 0.1327 |
| 4126 | MANBA | P8T-E | Human | Esophagus | ESCC | 9.22e-15 | 2.74e-01 | 0.0889 |
| 4126 | MANBA | P9T-E | Human | Esophagus | ESCC | 3.46e-10 | 2.09e-01 | 0.1131 |
| 4126 | MANBA | P10T-E | Human | Esophagus | ESCC | 1.99e-20 | 1.81e-01 | 0.116 |
| 4126 | MANBA | P11T-E | Human | Esophagus | ESCC | 2.59e-07 | 2.65e-01 | 0.1426 |
| 4126 | MANBA | P12T-E | Human | Esophagus | ESCC | 2.23e-08 | 1.70e-01 | 0.1122 |
| 4126 | MANBA | P15T-E | Human | Esophagus | ESCC | 1.48e-15 | 3.24e-01 | 0.1149 |
| 4126 | MANBA | P16T-E | Human | Esophagus | ESCC | 7.11e-10 | 1.78e-01 | 0.1153 |
| 4126 | MANBA | P20T-E | Human | Esophagus | ESCC | 3.31e-09 | 1.21e-01 | 0.1124 |
| 4126 | MANBA | P21T-E | Human | Esophagus | ESCC | 1.57e-02 | 1.54e-02 | 0.1617 |
| 4126 | MANBA | P22T-E | Human | Esophagus | ESCC | 1.65e-24 | 3.88e-01 | 0.1236 |
| 4126 | MANBA | P23T-E | Human | Esophagus | ESCC | 9.60e-07 | 2.67e-01 | 0.108 |
| 4126 | MANBA | P24T-E | Human | Esophagus | ESCC | 6.86e-16 | 8.26e-02 | 0.1287 |
| 4126 | MANBA | P26T-E | Human | Esophagus | ESCC | 1.10e-16 | 3.00e-01 | 0.1276 |
| 4126 | MANBA | P27T-E | Human | Esophagus | ESCC | 2.38e-17 | 3.31e-01 | 0.1055 |
| Page: 1 2 3 4 |
| Tissue | Expression Dynamics | Abbreviation |
| Esophagus | 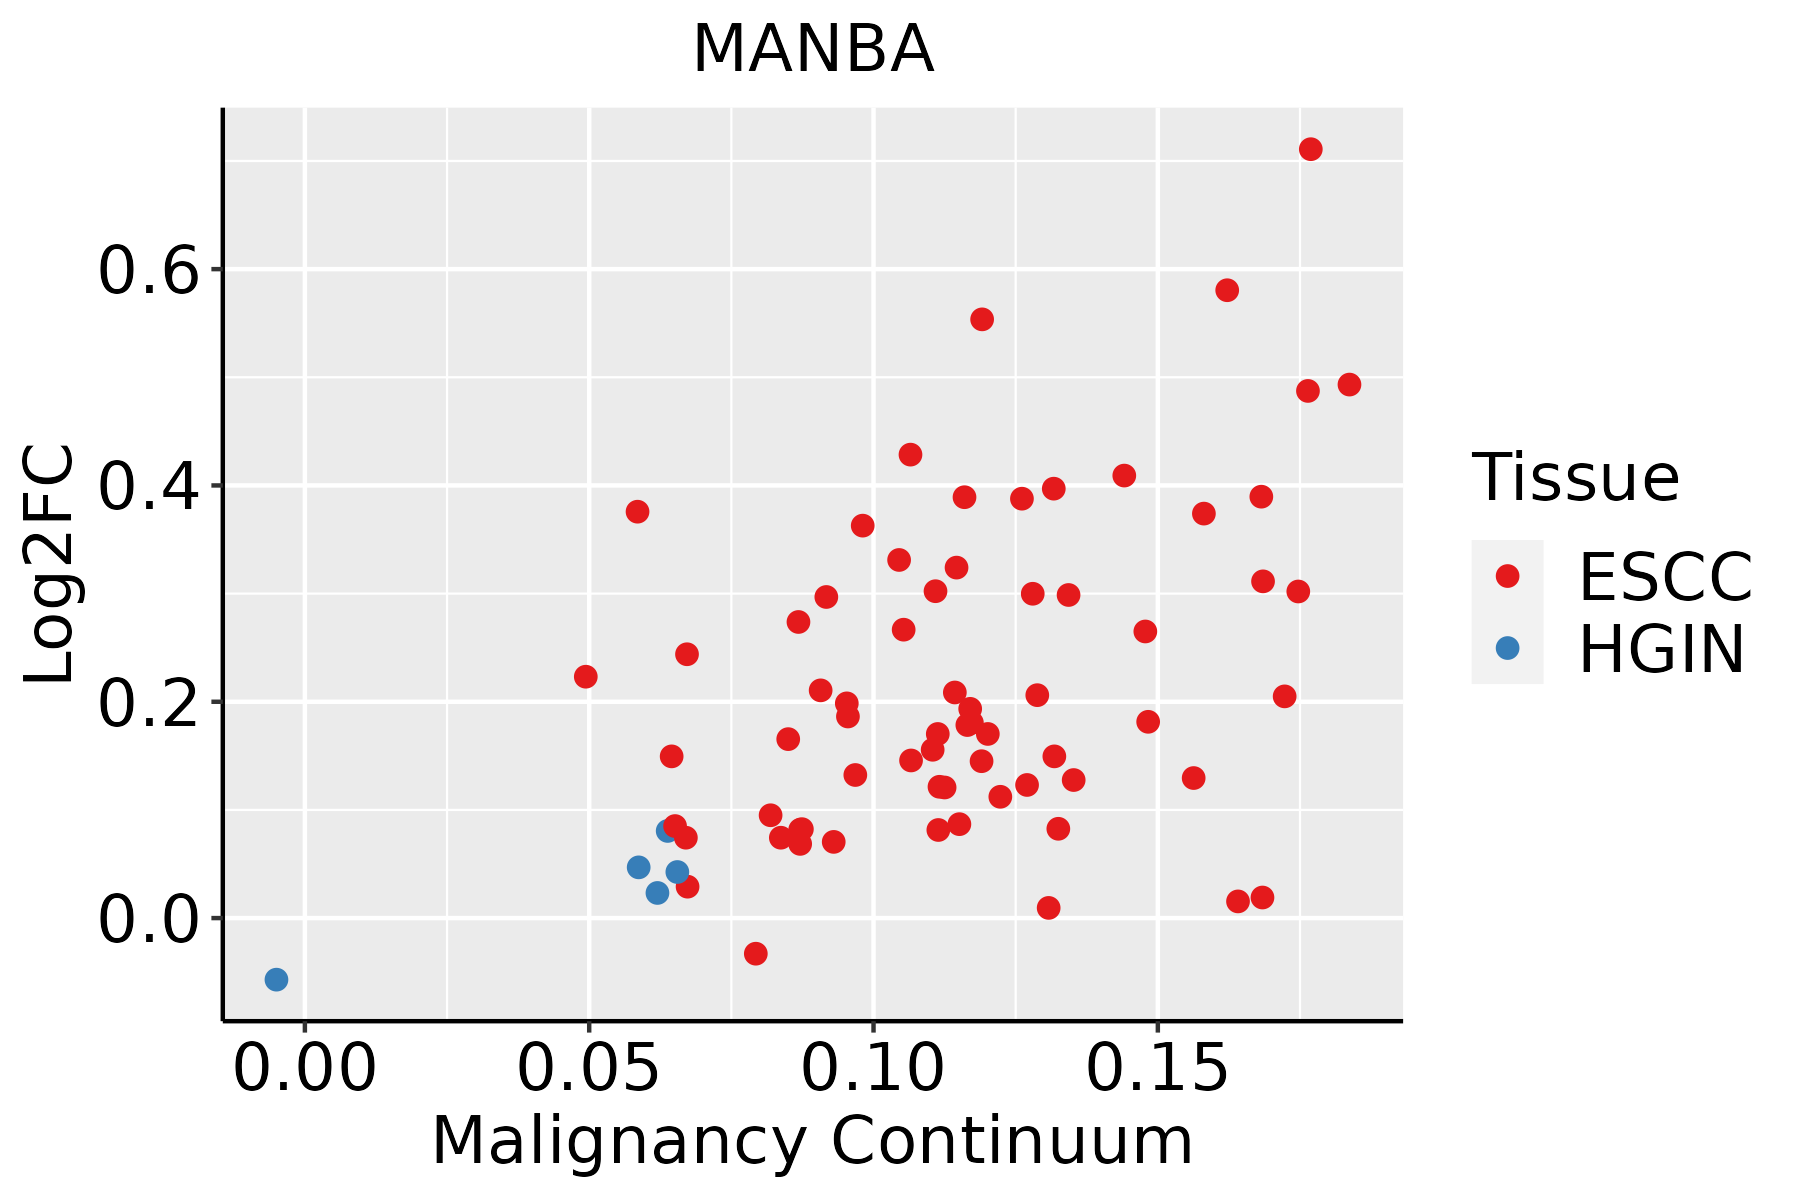 | ESCC: Esophageal squamous cell carcinoma |
| HGIN: High-grade intraepithelial neoplasias | ||
| LGIN: Low-grade intraepithelial neoplasias | ||
| Liver | 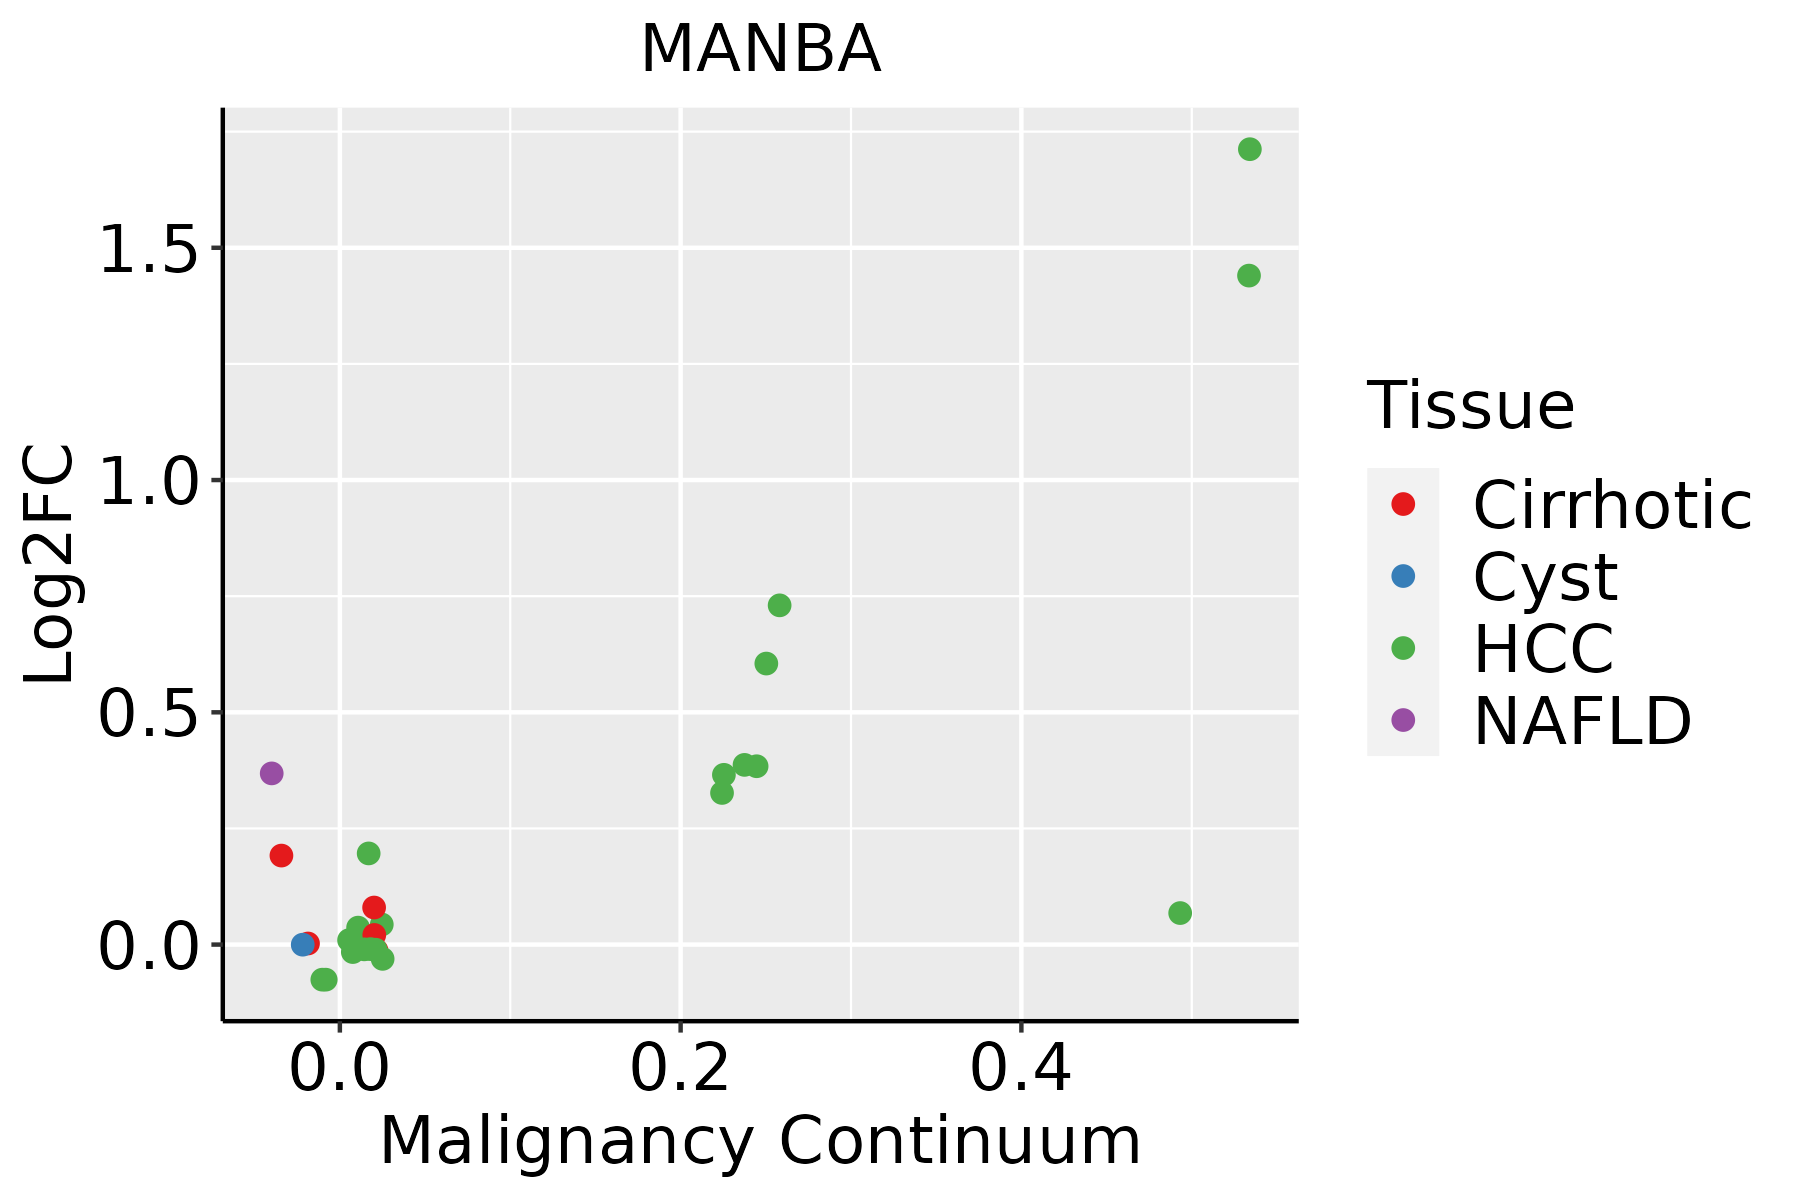 | HCC: Hepatocellular carcinoma |
| NAFLD: Non-alcoholic fatty liver disease | ||
| Lung | 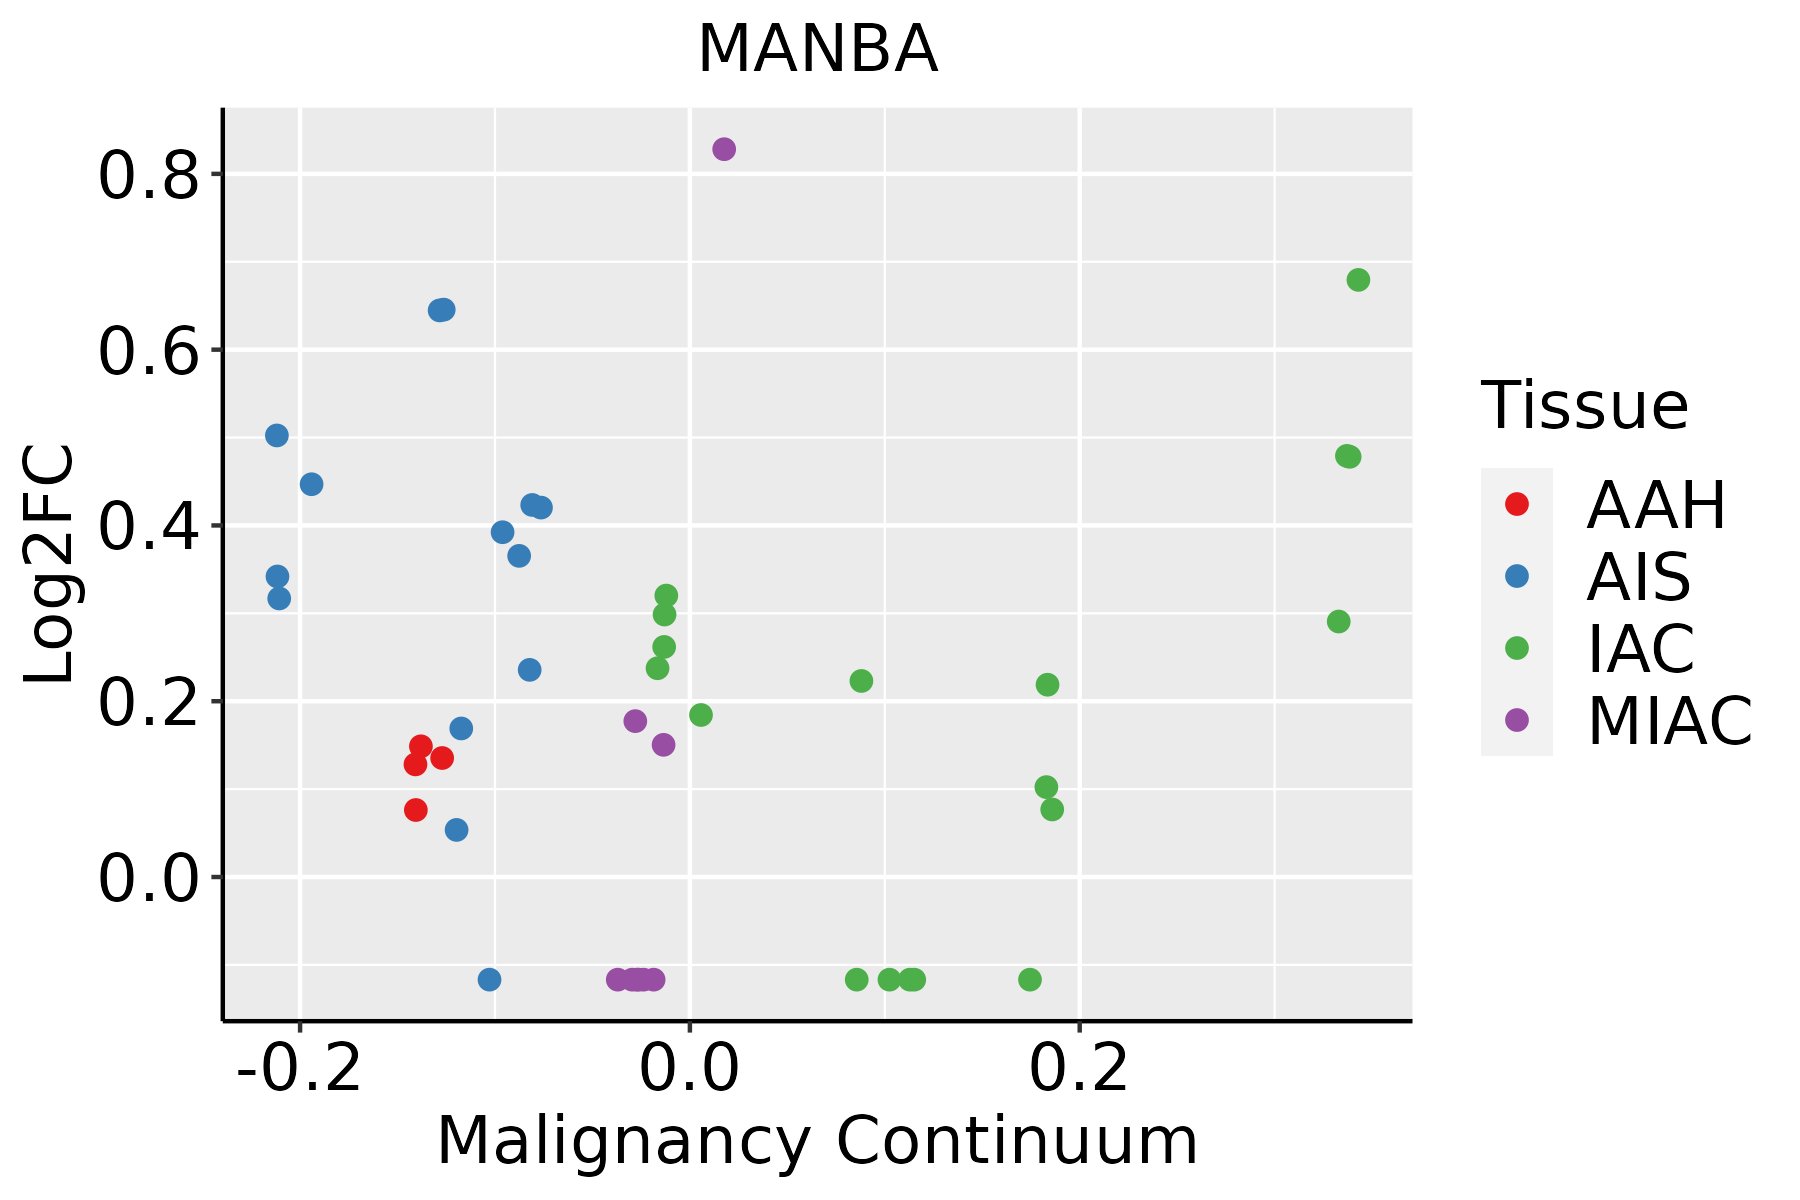 | AAH: Atypical adenomatous hyperplasia |
| AIS: Adenocarcinoma in situ | ||
| IAC: Invasive lung adenocarcinoma | ||
| MIA: Minimally invasive adenocarcinoma |
| ∗log2FC in expression of this searched gene in stem-like cells from each diseased tissue sample relative to stem-like cells in normal samples in each tissue plotted against the malignancy continuum. Samples are colored based on if they are from different disease stage. |
Top |
Malignant transformation related pathway analysis |
| Find out the enriched GO biological processes and KEGG pathways involved in transition from healthy to precancer to cancer |
| Tissue | Disease Stage | Enriched GO biological Processes |
| Colorectum | AD |  |
| Colorectum | SER |  |
| Colorectum | MSS |  |
| Colorectum | MSI-H |  |
| Colorectum | FAP |  |
| ∗Top 15 enriched GO BP terms are showed in the bar plot of each disease state in each tissue. Each row represents a significant GO biological process which is colored according to the -log10(p.adjust). |
| Page: 1 2 3 4 5 6 7 8 9 |
| GO ID | Tissue | Disease Stage | Description | Gene Ratio | Bg Ratio | pvalue | p.adjust | Count |
| GO:00091002 | Esophagus | ESCC | glycoprotein metabolic process | 226/8552 | 387/18723 | 2.64e-07 | 3.94e-06 | 226 |
| GO:001605216 | Esophagus | ESCC | carbohydrate catabolic process | 91/8552 | 154/18723 | 5.39e-04 | 2.97e-03 | 91 |
| GO:19011362 | Esophagus | ESCC | carbohydrate derivative catabolic process | 99/8552 | 172/18723 | 1.11e-03 | 5.54e-03 | 99 |
| GO:0006516 | Esophagus | ESCC | glycoprotein catabolic process | 19/8552 | 28/18723 | 1.49e-02 | 4.84e-02 | 19 |
| GO:001605222 | Liver | HCC | carbohydrate catabolic process | 99/7958 | 154/18723 | 3.79e-08 | 8.30e-07 | 99 |
| GO:1901136 | Liver | HCC | carbohydrate derivative catabolic process | 98/7958 | 172/18723 | 8.71e-05 | 7.62e-04 | 98 |
| GO:0009100 | Liver | HCC | glycoprotein metabolic process | 193/7958 | 387/18723 | 1.89e-03 | 9.62e-03 | 193 |
| Page: 1 |
| Pathway ID | Tissue | Disease Stage | Description | Gene Ratio | Bg Ratio | pvalue | p.adjust | qvalue | Count |
| hsa0414222 | Esophagus | ESCC | Lysosome | 102/4205 | 132/8465 | 5.11e-11 | 7.13e-10 | 3.65e-10 | 102 |
| hsa0414232 | Esophagus | ESCC | Lysosome | 102/4205 | 132/8465 | 5.11e-11 | 7.13e-10 | 3.65e-10 | 102 |
| hsa041422 | Liver | HCC | Lysosome | 100/4020 | 132/8465 | 2.32e-11 | 4.31e-10 | 2.40e-10 | 100 |
| hsa00511 | Liver | HCC | Other glycan degradation | 15/4020 | 18/8465 | 1.96e-03 | 6.91e-03 | 3.84e-03 | 15 |
| hsa041423 | Liver | HCC | Lysosome | 100/4020 | 132/8465 | 2.32e-11 | 4.31e-10 | 2.40e-10 | 100 |
| hsa005111 | Liver | HCC | Other glycan degradation | 15/4020 | 18/8465 | 1.96e-03 | 6.91e-03 | 3.84e-03 | 15 |
| Page: 1 |
Top |
Cell-cell communication analysis |
| Identification of potential cell-cell interactions between two cell types and their ligand-receptor pairs for different disease states |
| Ligand | Receptor | LRpair | Pathway | Tissue | Disease Stage |
| Page: 1 |
Top |
Single-cell gene regulatory network inference analysis |
| Find out the significant the regulons (TFs) and the target genes of each regulon across cell types for different disease states |
| TF | Cell Type | Tissue | Disease Stage | Target Gene | RSS | Regulon Activity |
| ∗The dot plots of a searched regulon are shown for all cell subpopulations in each disease state of each tissue based on the regulon specific score inferred using pySCENIC and by calculating the average expression. |
| Page: 1 |
Top |
Somatic mutation of malignant transformation related genes |
| Annotation of somatic variants for genes involved in malignant transformation |
| Hugo Symbol | Variant Class | Variant Classification | dbSNP RS | HGVSc | HGVSp | HGVSp Short | SWISSPROT | BIOTYPE | SIFT | PolyPhen | Tumor Sample Barcode | Tissue | Histology | Sex | Age | Stage | Therapy Types | Drugs | Outcome |
| MANBA | SNV | Missense_Mutation | c.1384C>A | p.Leu462Met | p.L462M | O00462 | protein_coding | deleterious(0.01) | probably_damaging(0.967) | TCGA-A2-A04Y-01 | Breast | breast invasive carcinoma | Female | <65 | I/II | Chemotherapy | cytoxan | SD | |
| MANBA | SNV | Missense_Mutation | c.1685C>A | p.Ser562Tyr | p.S562Y | O00462 | protein_coding | deleterious(0) | probably_damaging(0.996) | TCGA-A2-A25A-01 | Breast | breast invasive carcinoma | Female | <65 | I/II | Unspecific | Cytoxan | SD | |
| MANBA | SNV | Missense_Mutation | rs374377679 | c.544C>T | p.Arg182Trp | p.R182W | O00462 | protein_coding | deleterious(0.02) | probably_damaging(0.962) | TCGA-AN-A046-01 | Breast | breast invasive carcinoma | Female | >=65 | I/II | Unknown | Unknown | SD |
| MANBA | SNV | Missense_Mutation | novel | c.683N>A | p.Ala228Asp | p.A228D | O00462 | protein_coding | tolerated(0.56) | benign(0) | TCGA-BH-A0BR-01 | Breast | breast invasive carcinoma | Female | <65 | I/II | Unknown | Unknown | SD |
| MANBA | SNV | Missense_Mutation | c.1685N>A | p.Ser562Tyr | p.S562Y | O00462 | protein_coding | deleterious(0) | probably_damaging(0.996) | TCGA-D8-A1XL-01 | Breast | breast invasive carcinoma | Female | <65 | I/II | Chemotherapy | doxorubicine+cyclophosphamide+tamoxifen | SD | |
| MANBA | SNV | Missense_Mutation | c.1239G>C | p.Gln413His | p.Q413H | O00462 | protein_coding | tolerated(0.08) | probably_damaging(0.919) | TCGA-E2-A152-01 | Breast | breast invasive carcinoma | Female | <65 | I/II | Targeted Molecular therapy | trastuzumab | PD | |
| MANBA | insertion | Frame_Shift_Ins | novel | c.1422_1423insAAGGTAGAGCTTGCAGTGAGCCGAGATCGCGC | p.Pro475LysfsTer19 | p.P475Kfs*19 | O00462 | protein_coding | TCGA-A8-A09D-01 | Breast | breast invasive carcinoma | Female | <65 | I/II | Chemotherapy | doxorubicin | CR | ||
| MANBA | insertion | Nonsense_Mutation | novel | c.683_684insTGGGAATTAAATGGTGA | p.Gln229GlyfsTer3 | p.Q229Gfs*3 | O00462 | protein_coding | TCGA-BH-A0BR-01 | Breast | breast invasive carcinoma | Female | <65 | I/II | Unknown | Unknown | SD | ||
| MANBA | SNV | Missense_Mutation | c.1534G>A | p.Glu512Lys | p.E512K | O00462 | protein_coding | tolerated(0.22) | benign(0.02) | TCGA-DR-A0ZM-01 | Cervix | cervical & endocervical cancer | Female | <65 | III/IV | Unspecific | Cisplatin | SD | |
| MANBA | SNV | Missense_Mutation | novel | c.1762C>A | p.His588Asn | p.H588N | O00462 | protein_coding | deleterious(0) | possibly_damaging(0.506) | TCGA-MA-AA42-01 | Cervix | cervical & endocervical cancer | Female | >=65 | I/II | Unknown | Unknown | SD |
| Page: 1 2 3 4 5 6 7 8 9 |
Top |
Related drugs of malignant transformation related genes |
| Identification of chemicals and drugs interact with genes involved in malignant transfromation |
| (DGIdb 4.0) |
| Entrez ID | Symbol | Category | Interaction Types | Drug Claim Name | Drug Name | PMIDs |
| Page: 1 |

Copyright 2023-Present -The University of Texas Health Science Center at Houston |