
|
|||||
|
 | |
| |
| |
| |
| |
| |
|
Gene: MAN2B1 |
Gene summary for MAN2B1 |
| Gene information | Species | Human | Gene symbol | MAN2B1 | Gene ID | 4125 |
| Gene name | mannosidase alpha class 2B member 1 | |
| Gene Alias | LAMAN | |
| Cytomap | 19p13.13 | |
| Gene Type | protein-coding | GO ID | GO:0005975 | UniProtAcc | O00754 |
Top |
Malignant transformation analysis |
| Identification of the aberrant gene expression in precancerous and cancerous lesions by comparing the gene expression of stem-like cells in diseased tissues with normal stem cells |
| Entrez ID | Symbol | Replicates | Species | Organ | Tissue | Adj P-value | Log2FC | Malignancy |
| 4125 | MAN2B1 | LZE4T | Human | Esophagus | ESCC | 1.55e-10 | 2.84e-01 | 0.0811 |
| 4125 | MAN2B1 | LZE7T | Human | Esophagus | ESCC | 1.56e-14 | 5.16e-01 | 0.0667 |
| 4125 | MAN2B1 | LZE20T | Human | Esophagus | ESCC | 4.18e-08 | 2.66e-01 | 0.0662 |
| 4125 | MAN2B1 | LZE22D1 | Human | Esophagus | HGIN | 3.26e-02 | 1.58e-01 | 0.0595 |
| 4125 | MAN2B1 | LZE22T | Human | Esophagus | ESCC | 1.28e-07 | 4.10e-01 | 0.068 |
| 4125 | MAN2B1 | LZE24T | Human | Esophagus | ESCC | 3.76e-31 | 6.98e-01 | 0.0596 |
| 4125 | MAN2B1 | LZE22D3 | Human | Esophagus | HGIN | 1.73e-02 | 4.36e-01 | 0.0653 |
| 4125 | MAN2B1 | LZE21T | Human | Esophagus | ESCC | 9.73e-05 | 2.95e-01 | 0.0655 |
| 4125 | MAN2B1 | LZE6T | Human | Esophagus | ESCC | 5.26e-07 | 2.76e-01 | 0.0845 |
| 4125 | MAN2B1 | P1T-E | Human | Esophagus | ESCC | 1.45e-10 | 4.58e-01 | 0.0875 |
| 4125 | MAN2B1 | P2T-E | Human | Esophagus | ESCC | 6.38e-31 | 4.71e-01 | 0.1177 |
| 4125 | MAN2B1 | P4T-E | Human | Esophagus | ESCC | 1.44e-19 | 4.04e-01 | 0.1323 |
| 4125 | MAN2B1 | P5T-E | Human | Esophagus | ESCC | 2.03e-09 | 1.89e-01 | 0.1327 |
| 4125 | MAN2B1 | P8T-E | Human | Esophagus | ESCC | 8.22e-19 | 3.33e-01 | 0.0889 |
| 4125 | MAN2B1 | P9T-E | Human | Esophagus | ESCC | 1.78e-20 | 4.36e-01 | 0.1131 |
| 4125 | MAN2B1 | P10T-E | Human | Esophagus | ESCC | 2.13e-27 | 4.23e-01 | 0.116 |
| 4125 | MAN2B1 | P11T-E | Human | Esophagus | ESCC | 2.64e-31 | 1.06e+00 | 0.1426 |
| 4125 | MAN2B1 | P12T-E | Human | Esophagus | ESCC | 4.42e-29 | 3.99e-01 | 0.1122 |
| 4125 | MAN2B1 | P15T-E | Human | Esophagus | ESCC | 2.04e-18 | 3.46e-01 | 0.1149 |
| 4125 | MAN2B1 | P16T-E | Human | Esophagus | ESCC | 8.84e-36 | 5.80e-01 | 0.1153 |
| Page: 1 2 3 4 |
| Tissue | Expression Dynamics | Abbreviation |
| Esophagus |  | ESCC: Esophageal squamous cell carcinoma |
| HGIN: High-grade intraepithelial neoplasias | ||
| LGIN: Low-grade intraepithelial neoplasias | ||
| Liver | 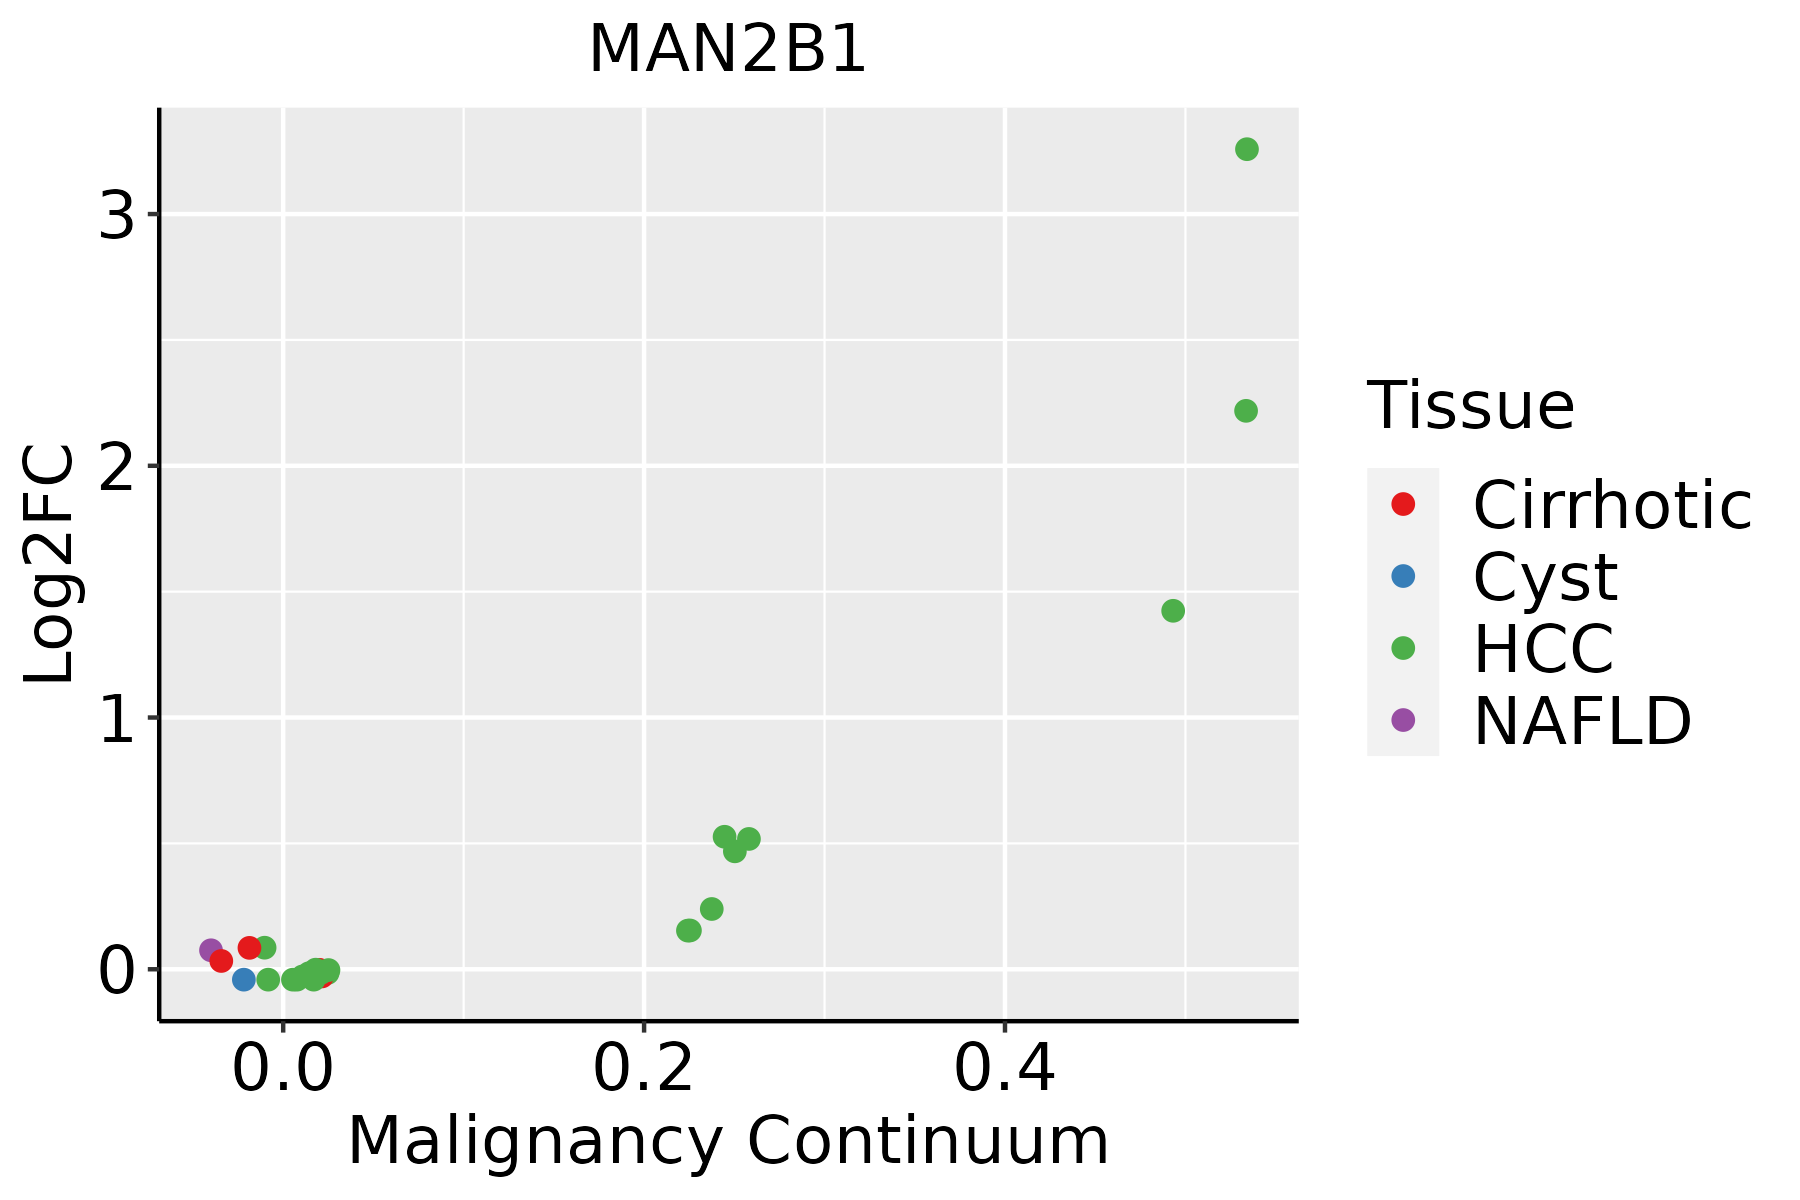 | HCC: Hepatocellular carcinoma |
| NAFLD: Non-alcoholic fatty liver disease |
| ∗log2FC in expression of this searched gene in stem-like cells from each diseased tissue sample relative to stem-like cells in normal samples in each tissue plotted against the malignancy continuum. Samples are colored based on if they are from different disease stage. |
Top |
Malignant transformation related pathway analysis |
| Find out the enriched GO biological processes and KEGG pathways involved in transition from healthy to precancer to cancer |
| Tissue | Disease Stage | Enriched GO biological Processes |
| Colorectum | AD |  |
| Colorectum | SER |  |
| Colorectum | MSS |  |
| Colorectum | MSI-H |  |
| Colorectum | FAP |  |
| ∗Top 15 enriched GO BP terms are showed in the bar plot of each disease state in each tissue. Each row represents a significant GO biological process which is colored according to the -log10(p.adjust). |
| Page: 1 2 3 4 5 6 7 8 9 |
| GO ID | Tissue | Disease Stage | Description | Gene Ratio | Bg Ratio | pvalue | p.adjust | Count |
| GO:00059969 | Esophagus | ESCC | monosaccharide metabolic process | 159/8552 | 257/18723 | 1.11e-07 | 1.81e-06 | 159 |
| GO:00193189 | Esophagus | ESCC | hexose metabolic process | 147/8552 | 237/18723 | 2.63e-07 | 3.94e-06 | 147 |
| GO:00091002 | Esophagus | ESCC | glycoprotein metabolic process | 226/8552 | 387/18723 | 2.64e-07 | 3.94e-06 | 226 |
| GO:00065173 | Esophagus | ESCC | protein deglycosylation | 19/8552 | 26/18723 | 4.31e-03 | 1.71e-02 | 19 |
| GO:000599621 | Liver | HCC | monosaccharide metabolic process | 167/7958 | 257/18723 | 2.31e-13 | 1.25e-11 | 167 |
| GO:001931821 | Liver | HCC | hexose metabolic process | 155/7958 | 237/18723 | 7.63e-13 | 3.90e-11 | 155 |
| GO:00065172 | Liver | HCC | protein deglycosylation | 22/7958 | 26/18723 | 1.23e-05 | 1.39e-04 | 22 |
| GO:0009100 | Liver | HCC | glycoprotein metabolic process | 193/7958 | 387/18723 | 1.89e-03 | 9.62e-03 | 193 |
| Page: 1 |
| Pathway ID | Tissue | Disease Stage | Description | Gene Ratio | Bg Ratio | pvalue | p.adjust | qvalue | Count |
| hsa041426 | Esophagus | HGIN | Lysosome | 33/1383 | 132/8465 | 6.65e-03 | 4.37e-02 | 3.47e-02 | 33 |
| hsa0414213 | Esophagus | HGIN | Lysosome | 33/1383 | 132/8465 | 6.65e-03 | 4.37e-02 | 3.47e-02 | 33 |
| hsa0414222 | Esophagus | ESCC | Lysosome | 102/4205 | 132/8465 | 5.11e-11 | 7.13e-10 | 3.65e-10 | 102 |
| hsa0414232 | Esophagus | ESCC | Lysosome | 102/4205 | 132/8465 | 5.11e-11 | 7.13e-10 | 3.65e-10 | 102 |
| hsa041422 | Liver | HCC | Lysosome | 100/4020 | 132/8465 | 2.32e-11 | 4.31e-10 | 2.40e-10 | 100 |
| hsa00511 | Liver | HCC | Other glycan degradation | 15/4020 | 18/8465 | 1.96e-03 | 6.91e-03 | 3.84e-03 | 15 |
| hsa041423 | Liver | HCC | Lysosome | 100/4020 | 132/8465 | 2.32e-11 | 4.31e-10 | 2.40e-10 | 100 |
| hsa005111 | Liver | HCC | Other glycan degradation | 15/4020 | 18/8465 | 1.96e-03 | 6.91e-03 | 3.84e-03 | 15 |
| Page: 1 |
Top |
Cell-cell communication analysis |
| Identification of potential cell-cell interactions between two cell types and their ligand-receptor pairs for different disease states |
| Ligand | Receptor | LRpair | Pathway | Tissue | Disease Stage |
| Page: 1 |
Top |
Single-cell gene regulatory network inference analysis |
| Find out the significant the regulons (TFs) and the target genes of each regulon across cell types for different disease states |
| TF | Cell Type | Tissue | Disease Stage | Target Gene | RSS | Regulon Activity |
| ∗The dot plots of a searched regulon are shown for all cell subpopulations in each disease state of each tissue based on the regulon specific score inferred using pySCENIC and by calculating the average expression. |
| Page: 1 |
Top |
Somatic mutation of malignant transformation related genes |
| Annotation of somatic variants for genes involved in malignant transformation |
| Hugo Symbol | Variant Class | Variant Classification | dbSNP RS | HGVSc | HGVSp | HGVSp Short | SWISSPROT | BIOTYPE | SIFT | PolyPhen | Tumor Sample Barcode | Tissue | Histology | Sex | Age | Stage | Therapy Types | Drugs | Outcome |
| MAN2B1 | SNV | Missense_Mutation | c.2194N>A | p.Arg732Ser | p.R732S | O00754 | protein_coding | deleterious(0) | probably_damaging(0.981) | TCGA-AR-A256-01 | Breast | breast invasive carcinoma | Female | <65 | I/II | Chemotherapy | doxorubicin | PD | |
| MAN2B1 | SNV | Missense_Mutation | c.1141N>A | p.Ala381Thr | p.A381T | O00754 | protein_coding | deleterious(0) | possibly_damaging(0.877) | TCGA-D8-A1XK-01 | Breast | breast invasive carcinoma | Female | <65 | I/II | Chemotherapy | doxorubicine+cyclophosphamide | SD | |
| MAN2B1 | SNV | Missense_Mutation | novel | c.2845A>C | p.Thr949Pro | p.T949P | O00754 | protein_coding | tolerated(0.05) | possibly_damaging(0.761) | TCGA-E9-A22A-01 | Breast | breast invasive carcinoma | Female | >=65 | I/II | Hormone Therapy | tamoxiphen | SD |
| MAN2B1 | insertion | In_Frame_Ins | novel | c.1604_1605insATG | p.Phe535delinsLeuCys | p.F535delinsLC | O00754 | protein_coding | TCGA-A8-A09D-01 | Breast | breast invasive carcinoma | Female | <65 | I/II | Chemotherapy | doxorubicin | CR | ||
| MAN2B1 | insertion | Frame_Shift_Ins | novel | c.1602_1603insATTTGCTTGTTAGAGGGGGACAGAAT | p.Phe535IlefsTer12 | p.F535Ifs*12 | O00754 | protein_coding | TCGA-A8-A09D-01 | Breast | breast invasive carcinoma | Female | <65 | I/II | Chemotherapy | doxorubicin | CR | ||
| MAN2B1 | insertion | Nonsense_Mutation | novel | c.1050_1051insCTGACCTCGTGATCCGCCCGCCTCGGTCTT | p.His350_Val351insLeuThrSerTerSerAlaArgLeuGlyLeu | p.H350_V351insLTS*SARLGL | O00754 | protein_coding | TCGA-BH-A0H7-01 | Breast | breast invasive carcinoma | Female | >=65 | III/IV | Chemotherapy | doxorubicin | SD | ||
| MAN2B1 | SNV | Missense_Mutation | c.1183N>T | p.Arg395Trp | p.R395W | O00754 | protein_coding | deleterious(0) | probably_damaging(0.998) | TCGA-2W-A8YY-01 | Cervix | cervical & endocervical cancer | Female | <65 | I/II | Chemotherapy | cisplatin | CR | |
| MAN2B1 | SNV | Missense_Mutation | novel | c.1256N>G | p.Val419Gly | p.V419G | O00754 | protein_coding | tolerated(0.19) | benign(0.001) | TCGA-C5-A1MF-01 | Cervix | cervical & endocervical cancer | Female | <65 | I/II | Unknown | Unknown | SD |
| MAN2B1 | SNV | Missense_Mutation | c.788C>T | p.Pro263Leu | p.P263L | O00754 | protein_coding | deleterious(0) | probably_damaging(1) | TCGA-EA-A410-01 | Cervix | cervical & endocervical cancer | Female | <65 | I/II | Unknown | Unknown | SD | |
| MAN2B1 | SNV | Missense_Mutation | novel | c.1458C>G | p.Phe486Leu | p.F486L | O00754 | protein_coding | tolerated(0.68) | benign(0) | TCGA-IR-A3LH-01 | Cervix | cervical & endocervical cancer | Female | <65 | I/II | Chemotherapy | cisplatin | CR |
| Page: 1 2 3 4 5 6 7 8 9 10 11 |
Top |
Related drugs of malignant transformation related genes |
| Identification of chemicals and drugs interact with genes involved in malignant transfromation |
| (DGIdb 4.0) |
| Entrez ID | Symbol | Category | Interaction Types | Drug Claim Name | Drug Name | PMIDs |
| Page: 1 |

Copyright 2023-Present -The University of Texas Health Science Center at Houston |