
|
|||||
|
 | |
| |
| |
| |
| |
| |
|
Gene: MAN2A2 |
Gene summary for MAN2A2 |
| Gene information | Species | Human | Gene symbol | MAN2A2 | Gene ID | 4122 |
| Gene name | mannosidase alpha class 2A member 2 | |
| Gene Alias | MANA2X | |
| Cytomap | 15q26.1 | |
| Gene Type | protein-coding | GO ID | GO:0005975 | UniProtAcc | P49641 |
Top |
Malignant transformation analysis |
| Identification of the aberrant gene expression in precancerous and cancerous lesions by comparing the gene expression of stem-like cells in diseased tissues with normal stem cells |
| Entrez ID | Symbol | Replicates | Species | Organ | Tissue | Adj P-value | Log2FC | Malignancy |
| 4122 | MAN2A2 | NAFLD1 | Human | Liver | NAFLD | 1.73e-02 | 2.47e-01 | -0.04 |
| 4122 | MAN2A2 | HCC1_Meng | Human | Liver | HCC | 5.96e-20 | 9.66e-03 | 0.0246 |
| 4122 | MAN2A2 | HCC2_Meng | Human | Liver | HCC | 7.60e-04 | 5.74e-02 | 0.0107 |
| 4122 | MAN2A2 | HCC1 | Human | Liver | HCC | 8.01e-08 | 3.26e+00 | 0.5336 |
| 4122 | MAN2A2 | HCC2 | Human | Liver | HCC | 2.87e-25 | 3.92e+00 | 0.5341 |
| 4122 | MAN2A2 | S014 | Human | Liver | HCC | 1.06e-05 | 2.38e-01 | 0.2254 |
| 4122 | MAN2A2 | S015 | Human | Liver | HCC | 1.10e-03 | 2.54e-01 | 0.2375 |
| 4122 | MAN2A2 | S016 | Human | Liver | HCC | 1.11e-02 | 1.89e-01 | 0.2243 |
| 4122 | MAN2A2 | S027 | Human | Liver | HCC | 7.38e-08 | 5.49e-01 | 0.2446 |
| 4122 | MAN2A2 | S028 | Human | Liver | HCC | 2.39e-17 | 5.50e-01 | 0.2503 |
| 4122 | MAN2A2 | S029 | Human | Liver | HCC | 6.28e-07 | 3.14e-01 | 0.2581 |
| Page: 1 |
| Tissue | Expression Dynamics | Abbreviation |
| Liver | 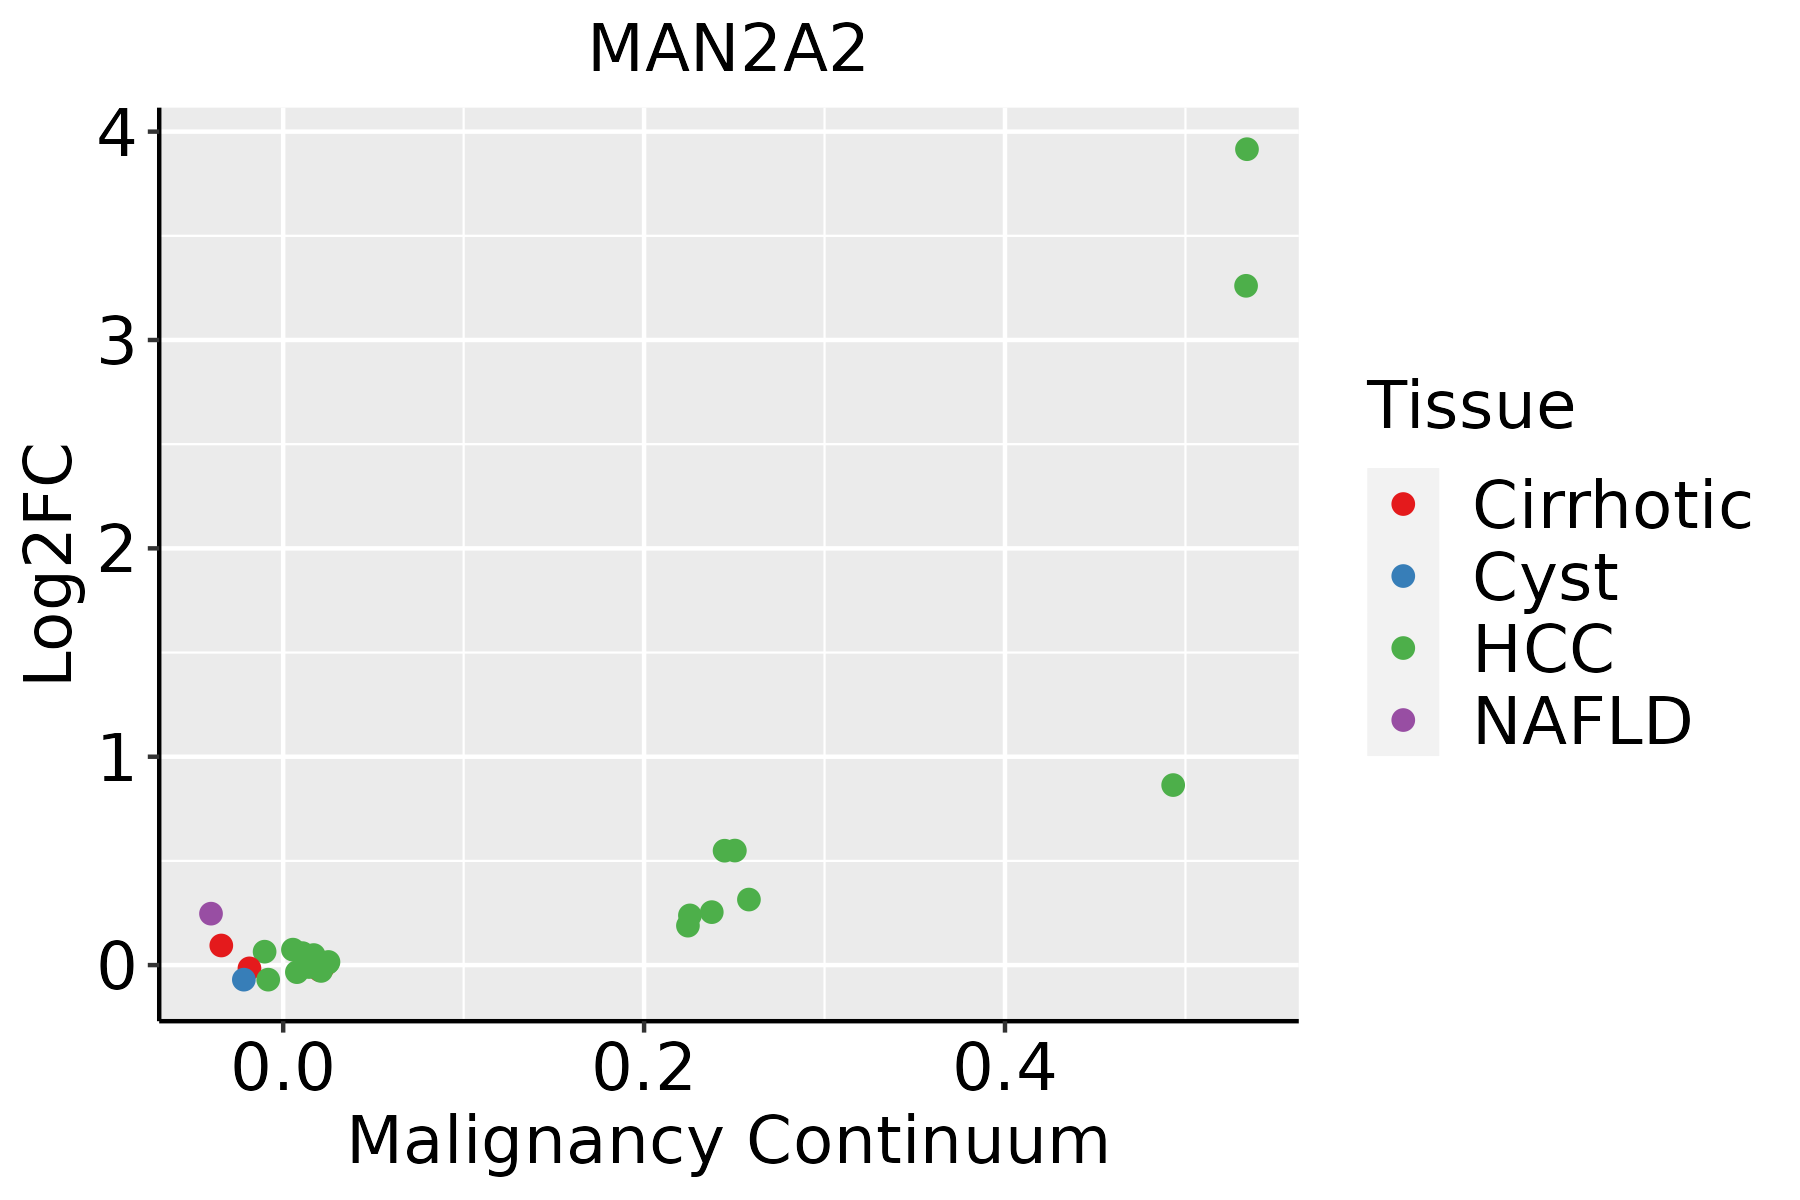 | HCC: Hepatocellular carcinoma |
| NAFLD: Non-alcoholic fatty liver disease |
| ∗log2FC in expression of this searched gene in stem-like cells from each diseased tissue sample relative to stem-like cells in normal samples in each tissue plotted against the malignancy continuum. Samples are colored based on if they are from different disease stage. |
Top |
Malignant transformation related pathway analysis |
| Find out the enriched GO biological processes and KEGG pathways involved in transition from healthy to precancer to cancer |
| Tissue | Disease Stage | Enriched GO biological Processes |
| Colorectum | AD |  |
| Colorectum | SER |  |
| Colorectum | MSS |  |
| Colorectum | MSI-H |  |
| Colorectum | FAP |  |
| ∗Top 15 enriched GO BP terms are showed in the bar plot of each disease state in each tissue. Each row represents a significant GO biological process which is colored according to the -log10(p.adjust). |
| Page: 1 2 3 4 5 6 7 8 9 |
| GO ID | Tissue | Disease Stage | Description | Gene Ratio | Bg Ratio | pvalue | p.adjust | Count |
| GO:00059965 | Liver | NAFLD | monosaccharide metabolic process | 53/1882 | 257/18723 | 2.89e-07 | 1.92e-05 | 53 |
| GO:00193185 | Liver | NAFLD | hexose metabolic process | 49/1882 | 237/18723 | 7.41e-07 | 4.12e-05 | 49 |
| GO:0006517 | Liver | NAFLD | protein deglycosylation | 9/1882 | 26/18723 | 6.56e-04 | 8.50e-03 | 9 |
| GO:000599621 | Liver | HCC | monosaccharide metabolic process | 167/7958 | 257/18723 | 2.31e-13 | 1.25e-11 | 167 |
| GO:001931821 | Liver | HCC | hexose metabolic process | 155/7958 | 237/18723 | 7.63e-13 | 3.90e-11 | 155 |
| GO:00065172 | Liver | HCC | protein deglycosylation | 22/7958 | 26/18723 | 1.23e-05 | 1.39e-04 | 22 |
| GO:00064862 | Liver | HCC | protein glycosylation | 122/7958 | 226/18723 | 3.11e-04 | 2.21e-03 | 122 |
| GO:00434132 | Liver | HCC | macromolecule glycosylation | 122/7958 | 226/18723 | 3.11e-04 | 2.21e-03 | 122 |
| GO:00700852 | Liver | HCC | glycosylation | 128/7958 | 240/18723 | 4.35e-04 | 2.92e-03 | 128 |
| GO:0009100 | Liver | HCC | glycoprotein metabolic process | 193/7958 | 387/18723 | 1.89e-03 | 9.62e-03 | 193 |
| Page: 1 |
| Pathway ID | Tissue | Disease Stage | Description | Gene Ratio | Bg Ratio | pvalue | p.adjust | qvalue | Count |
| hsa0051021 | Liver | HCC | N-Glycan biosynthesis | 40/4020 | 53/8465 | 2.95e-05 | 1.87e-04 | 1.04e-04 | 40 |
| hsa005132 | Liver | HCC | Various types of N-glycan biosynthesis | 30/4020 | 42/8465 | 1.41e-03 | 5.07e-03 | 2.82e-03 | 30 |
| hsa0051031 | Liver | HCC | N-Glycan biosynthesis | 40/4020 | 53/8465 | 2.95e-05 | 1.87e-04 | 1.04e-04 | 40 |
| hsa005133 | Liver | HCC | Various types of N-glycan biosynthesis | 30/4020 | 42/8465 | 1.41e-03 | 5.07e-03 | 2.82e-03 | 30 |
| Page: 1 |
Top |
Cell-cell communication analysis |
| Identification of potential cell-cell interactions between two cell types and their ligand-receptor pairs for different disease states |
| Ligand | Receptor | LRpair | Pathway | Tissue | Disease Stage |
| Page: 1 |
Top |
Single-cell gene regulatory network inference analysis |
| Find out the significant the regulons (TFs) and the target genes of each regulon across cell types for different disease states |
| TF | Cell Type | Tissue | Disease Stage | Target Gene | RSS | Regulon Activity |
| ∗The dot plots of a searched regulon are shown for all cell subpopulations in each disease state of each tissue based on the regulon specific score inferred using pySCENIC and by calculating the average expression. |
| Page: 1 |
Top |
Somatic mutation of malignant transformation related genes |
| Annotation of somatic variants for genes involved in malignant transformation |
| Hugo Symbol | Variant Class | Variant Classification | dbSNP RS | HGVSc | HGVSp | HGVSp Short | SWISSPROT | BIOTYPE | SIFT | PolyPhen | Tumor Sample Barcode | Tissue | Histology | Sex | Age | Stage | Therapy Types | Drugs | Outcome |
| MAN2A2 | SNV | Missense_Mutation | novel | c.678N>G | p.Ile226Met | p.I226M | P49641 | protein_coding | deleterious(0) | possibly_damaging(0.665) | TCGA-A7-A6VX-01 | Breast | breast invasive carcinoma | Female | >=65 | I/II | Chemotherapy | docetaxel | CR |
| MAN2A2 | SNV | Missense_Mutation | c.1705C>A | p.His569Asn | p.H569N | P49641 | protein_coding | deleterious(0) | probably_damaging(1) | TCGA-BH-A0HA-01 | Breast | breast invasive carcinoma | Female | <65 | I/II | Unknown | Unknown | SD | |
| MAN2A2 | SNV | Missense_Mutation | c.2885G>T | p.Arg962Leu | p.R962L | P49641 | protein_coding | deleterious(0) | probably_damaging(0.999) | TCGA-D8-A1XQ-01 | Breast | breast invasive carcinoma | Female | >=65 | I/II | Unknown | Unknown | SD | |
| MAN2A2 | SNV | Missense_Mutation | c.1705N>T | p.His569Tyr | p.H569Y | P49641 | protein_coding | deleterious(0) | probably_damaging(1) | TCGA-D8-A27G-01 | Breast | breast invasive carcinoma | Female | >=65 | I/II | Unknown | Unknown | SD | |
| MAN2A2 | SNV | Missense_Mutation | rs549071659 | c.2732N>A | p.Arg911Gln | p.R911Q | P49641 | protein_coding | tolerated(0.18) | benign(0.023) | TCGA-EW-A1IZ-01 | Breast | breast invasive carcinoma | Female | <65 | III/IV | Chemotherapy | taxotere | SD |
| MAN2A2 | SNV | Missense_Mutation | novel | c.3140N>T | p.Ser1047Leu | p.S1047L | P49641 | protein_coding | deleterious(0.04) | benign(0.03) | TCGA-OL-A5D6-01 | Breast | breast invasive carcinoma | Female | >=65 | I/II | Unknown | Unknown | SD |
| MAN2A2 | insertion | Frame_Shift_Ins | novel | c.3133_3134insGATGTGGCATCGCTCGTGAAGCCGCAGATTACCCAGAGCA | p.Ala1045GlyfsTer20 | p.A1045Gfs*20 | P49641 | protein_coding | TCGA-A7-A0CG-01 | Breast | breast invasive carcinoma | Female | >=65 | I/II | Unknown | Unknown | SD | ||
| MAN2A2 | insertion | Nonsense_Mutation | novel | c.448_449insCAGTATG | p.Gln150ProfsTer3 | p.Q150Pfs*3 | P49641 | protein_coding | TCGA-A8-A08H-01 | Breast | breast invasive carcinoma | Female | >=65 | I/II | Unknown | Unknown | SD | ||
| MAN2A2 | insertion | In_Frame_Ins | novel | c.450_451insGCTGAAAAAGCAGGTGACAGTGTGTGG | p.Gln150_Gly151insAlaGluLysAlaGlyAspSerValTrp | p.Q150_G151insAEKAGDSVW | P49641 | protein_coding | TCGA-A8-A08H-01 | Breast | breast invasive carcinoma | Female | >=65 | I/II | Unknown | Unknown | SD | ||
| MAN2A2 | insertion | Frame_Shift_Ins | novel | c.2048_2049insACTATGCCATCAAGAAGCACTTTGCTGCCACCCACAGCCTA | p.Ala684LeufsTer244 | p.A684Lfs*244 | P49641 | protein_coding | TCGA-AO-A03T-01 | Breast | breast invasive carcinoma | Female | <65 | I/II | Chemotherapy | cyclophosphamide | SD |
| Page: 1 2 3 4 5 6 7 8 9 10 11 12 |
Top |
Related drugs of malignant transformation related genes |
| Identification of chemicals and drugs interact with genes involved in malignant transfromation |
| (DGIdb 4.0) |
| Entrez ID | Symbol | Category | Interaction Types | Drug Claim Name | Drug Name | PMIDs |
| Page: 1 |

Copyright 2023-Present -The University of Texas Health Science Center at Houston |