
|
|||||
|
 | |
| |
| |
| |
| |
| |
|
Gene: MAN2A1 |
Gene summary for MAN2A1 |
| Gene information | Species | Human | Gene symbol | MAN2A1 | Gene ID | 4124 |
| Gene name | mannosidase alpha class 2A member 1 | |
| Gene Alias | AMan II | |
| Cytomap | 5q21.3 | |
| Gene Type | protein-coding | GO ID | GO:0001654 | UniProtAcc | Q16706 |
Top |
Malignant transformation analysis |
| Identification of the aberrant gene expression in precancerous and cancerous lesions by comparing the gene expression of stem-like cells in diseased tissues with normal stem cells |
| Entrez ID | Symbol | Replicates | Species | Organ | Tissue | Adj P-value | Log2FC | Malignancy |
| 4124 | MAN2A1 | CCI_2 | Human | Cervix | CC | 3.14e-07 | 7.64e-01 | 0.5249 |
| 4124 | MAN2A1 | CCI_3 | Human | Cervix | CC | 1.57e-06 | 5.86e-01 | 0.516 |
| 4124 | MAN2A1 | HTA11_3410_2000001011 | Human | Colorectum | AD | 4.79e-18 | -6.25e-01 | 0.0155 |
| 4124 | MAN2A1 | HTA11_3361_2000001011 | Human | Colorectum | AD | 3.67e-03 | -5.15e-01 | -0.1207 |
| 4124 | MAN2A1 | HTA11_696_2000001011 | Human | Colorectum | AD | 1.06e-04 | -3.50e-01 | -0.1464 |
| 4124 | MAN2A1 | HTA11_866_2000001011 | Human | Colorectum | AD | 1.40e-07 | -4.05e-01 | -0.1001 |
| 4124 | MAN2A1 | HTA11_1391_2000001011 | Human | Colorectum | AD | 1.03e-06 | -4.60e-01 | -0.059 |
| 4124 | MAN2A1 | HTA11_866_3004761011 | Human | Colorectum | AD | 4.03e-10 | -5.51e-01 | 0.096 |
| 4124 | MAN2A1 | HTA11_8622_2000001021 | Human | Colorectum | SER | 2.02e-03 | -6.56e-01 | 0.0528 |
| 4124 | MAN2A1 | HTA11_10711_2000001011 | Human | Colorectum | AD | 6.42e-04 | -4.79e-01 | 0.0338 |
| 4124 | MAN2A1 | HTA11_7696_3000711011 | Human | Colorectum | AD | 7.80e-19 | -5.04e-01 | 0.0674 |
| 4124 | MAN2A1 | HTA11_11156_2000001011 | Human | Colorectum | AD | 4.56e-02 | -7.28e-01 | 0.0397 |
| 4124 | MAN2A1 | HTA11_99999974143_84620 | Human | Colorectum | MSS | 2.28e-12 | -4.35e-01 | 0.3005 |
| 4124 | MAN2A1 | F007 | Human | Colorectum | FAP | 9.49e-03 | -3.16e-01 | 0.1176 |
| 4124 | MAN2A1 | A001-C-207 | Human | Colorectum | FAP | 3.90e-02 | -1.59e-01 | 0.1278 |
| 4124 | MAN2A1 | A015-C-203 | Human | Colorectum | FAP | 8.91e-24 | -3.71e-01 | -0.1294 |
| 4124 | MAN2A1 | A015-C-204 | Human | Colorectum | FAP | 7.91e-05 | -2.54e-01 | -0.0228 |
| 4124 | MAN2A1 | A014-C-040 | Human | Colorectum | FAP | 2.69e-04 | -4.96e-01 | -0.1184 |
| 4124 | MAN2A1 | A002-C-201 | Human | Colorectum | FAP | 5.23e-16 | -4.65e-01 | 0.0324 |
| 4124 | MAN2A1 | A002-C-203 | Human | Colorectum | FAP | 8.55e-07 | -1.95e-01 | 0.2786 |
| Page: 1 2 3 4 5 6 7 8 |
| Tissue | Expression Dynamics | Abbreviation |
| Cervix | 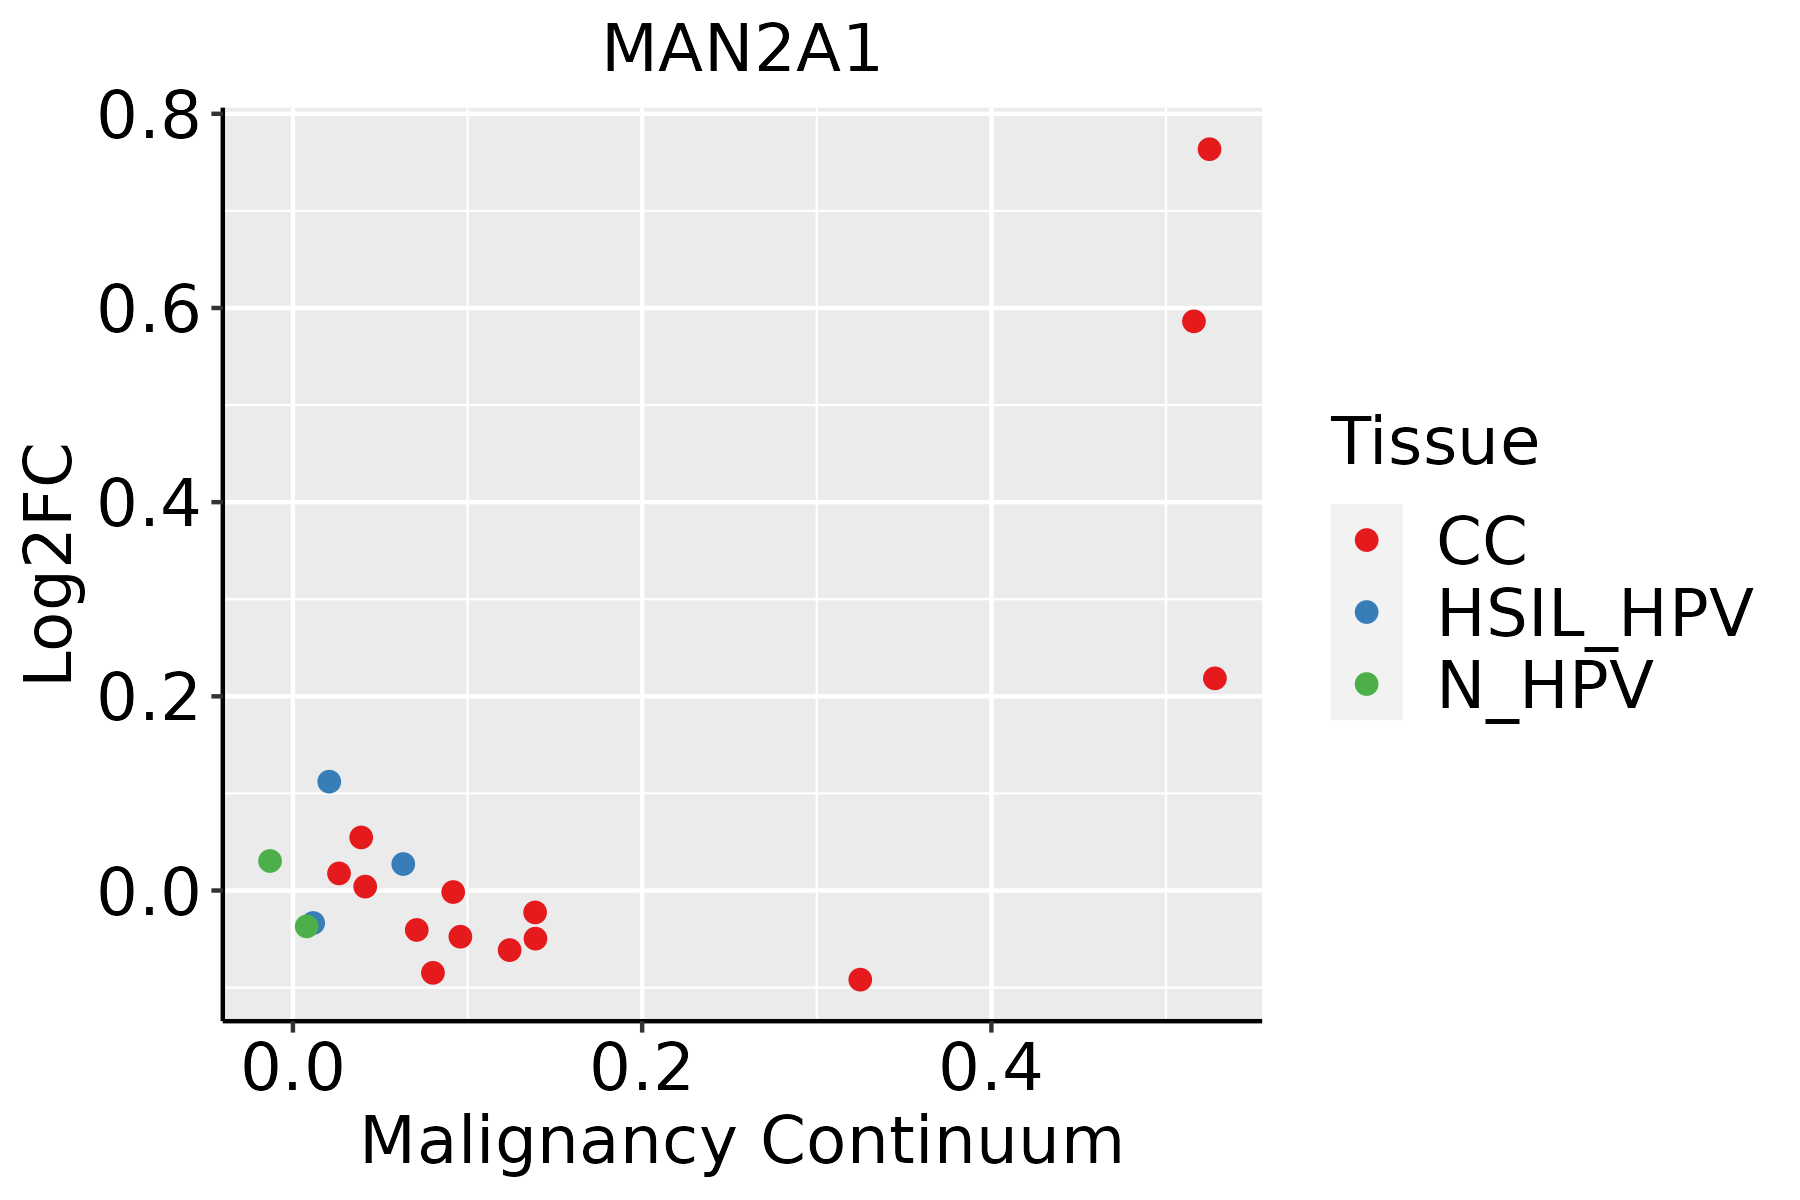 | CC: Cervix cancer |
| HSIL_HPV: HPV-infected high-grade squamous intraepithelial lesions | ||
| N_HPV: HPV-infected normal cervix | ||
| Colorectum (GSE201348) |  | FAP: Familial adenomatous polyposis |
| CRC: Colorectal cancer | ||
| Colorectum (HTA11) |  | AD: Adenomas |
| SER: Sessile serrated lesions | ||
| MSI-H: Microsatellite-high colorectal cancer | ||
| MSS: Microsatellite stable colorectal cancer | ||
| Esophagus | 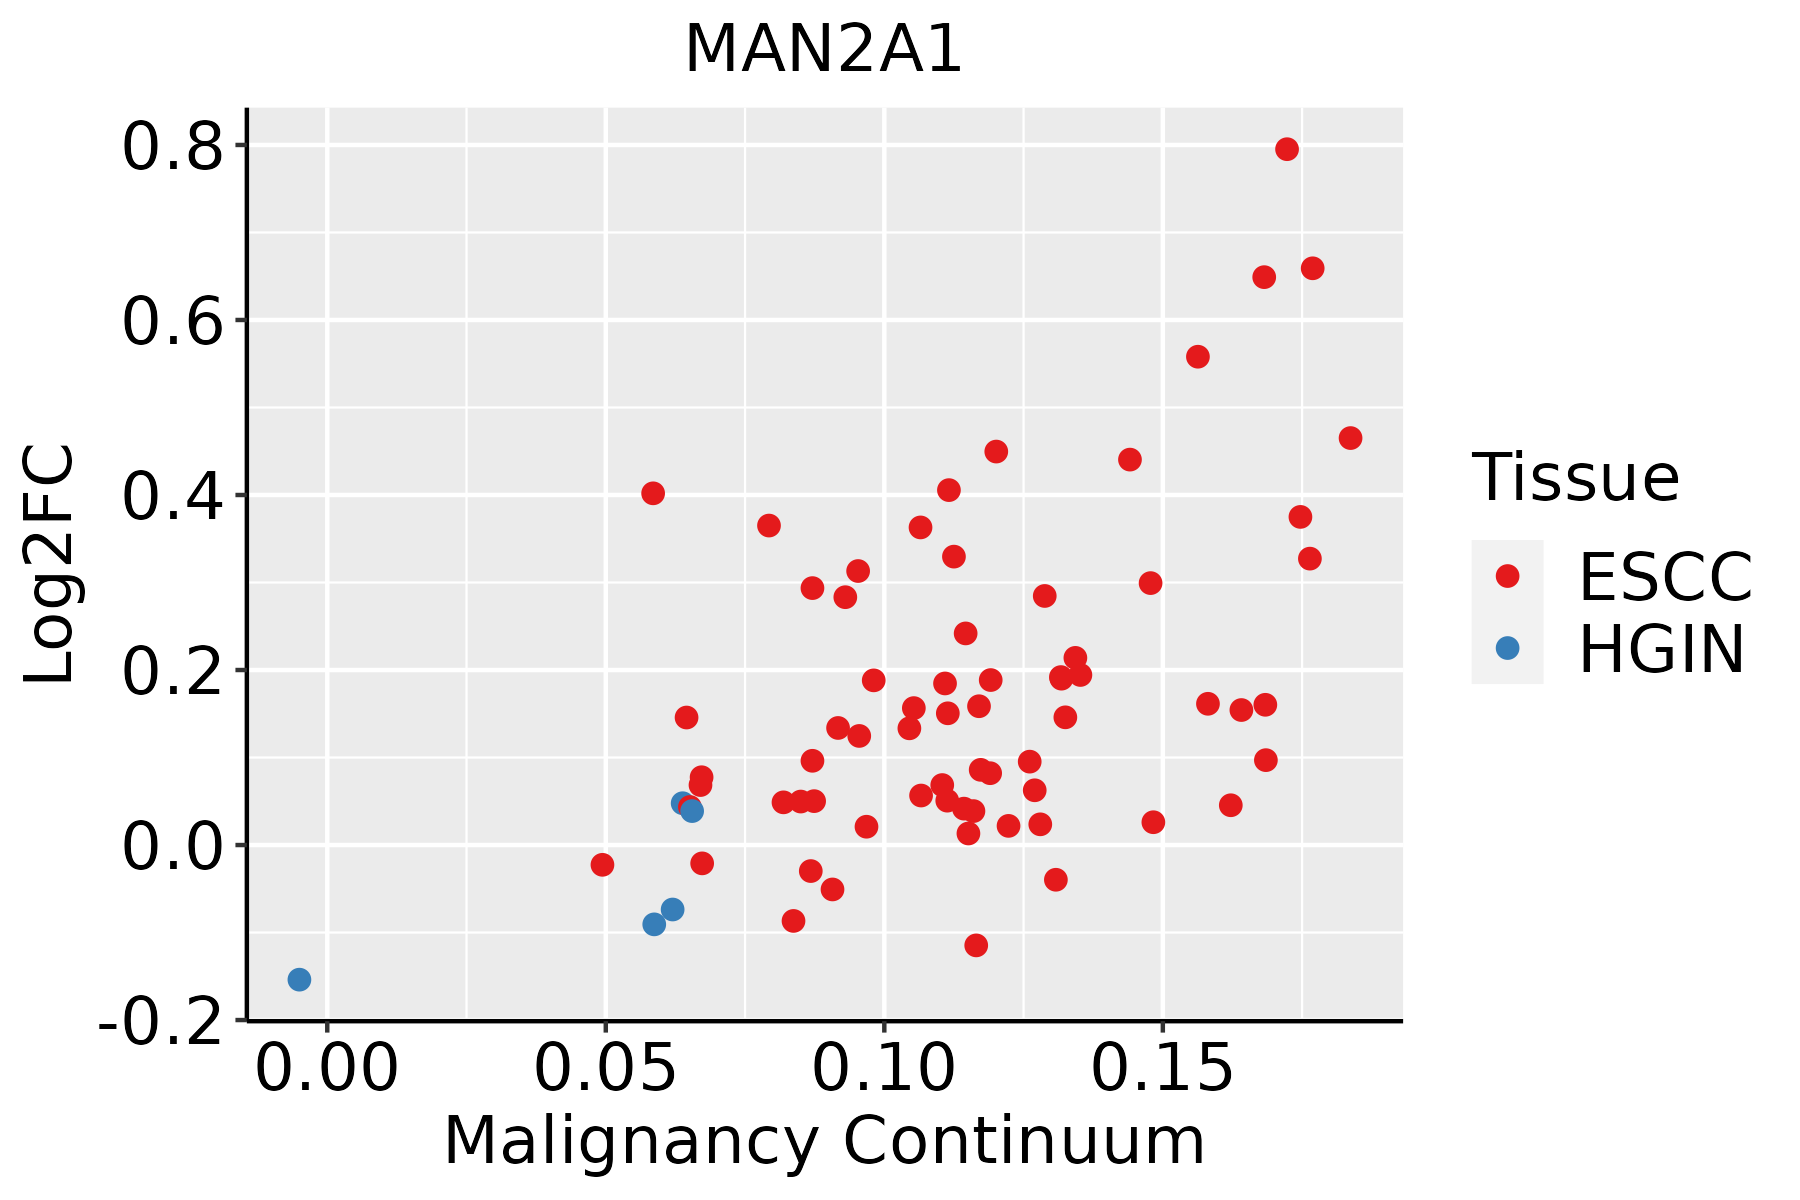 | ESCC: Esophageal squamous cell carcinoma |
| HGIN: High-grade intraepithelial neoplasias | ||
| LGIN: Low-grade intraepithelial neoplasias | ||
| Liver |  | HCC: Hepatocellular carcinoma |
| NAFLD: Non-alcoholic fatty liver disease | ||
| Oral Cavity | 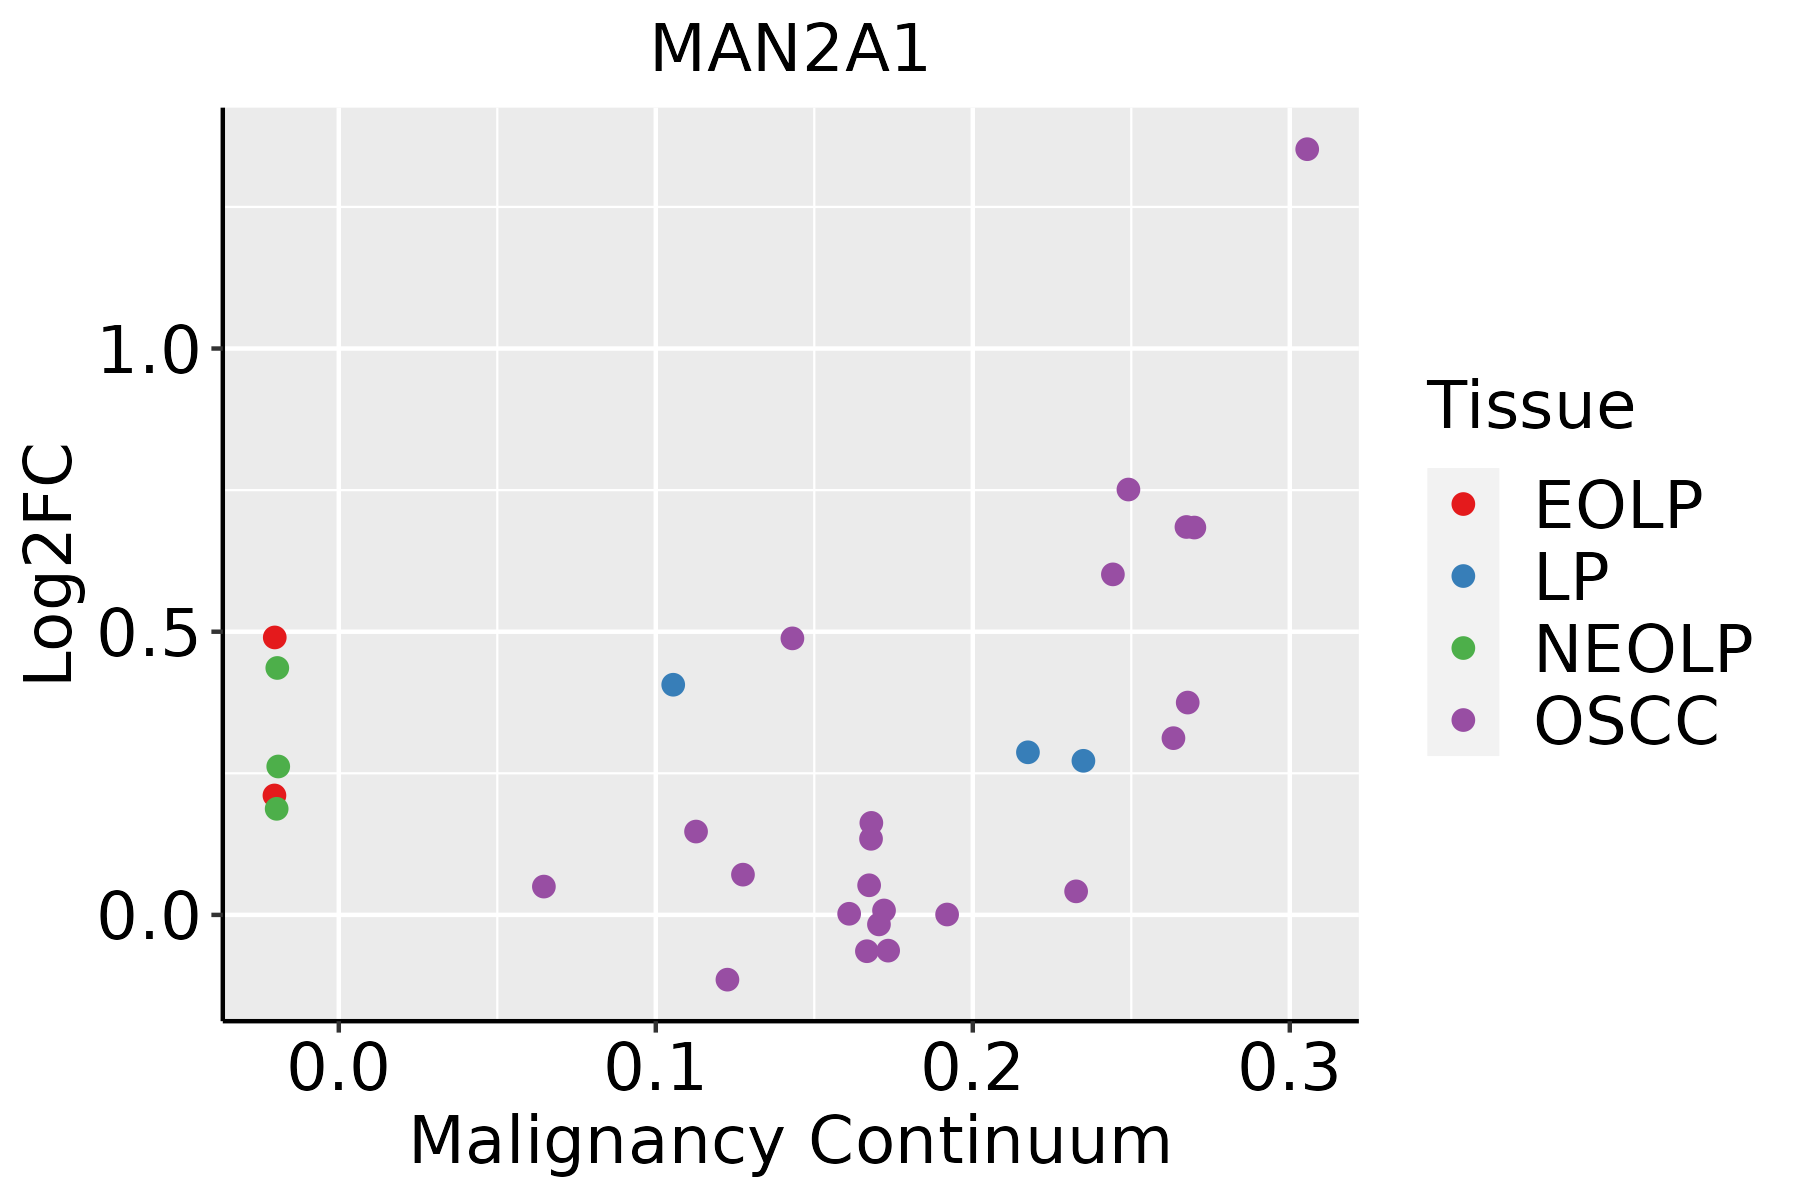 | EOLP: Erosive Oral lichen planus |
| LP: leukoplakia | ||
| NEOLP: Non-erosive oral lichen planus | ||
| OSCC: Oral squamous cell carcinoma | ||
| Skin | 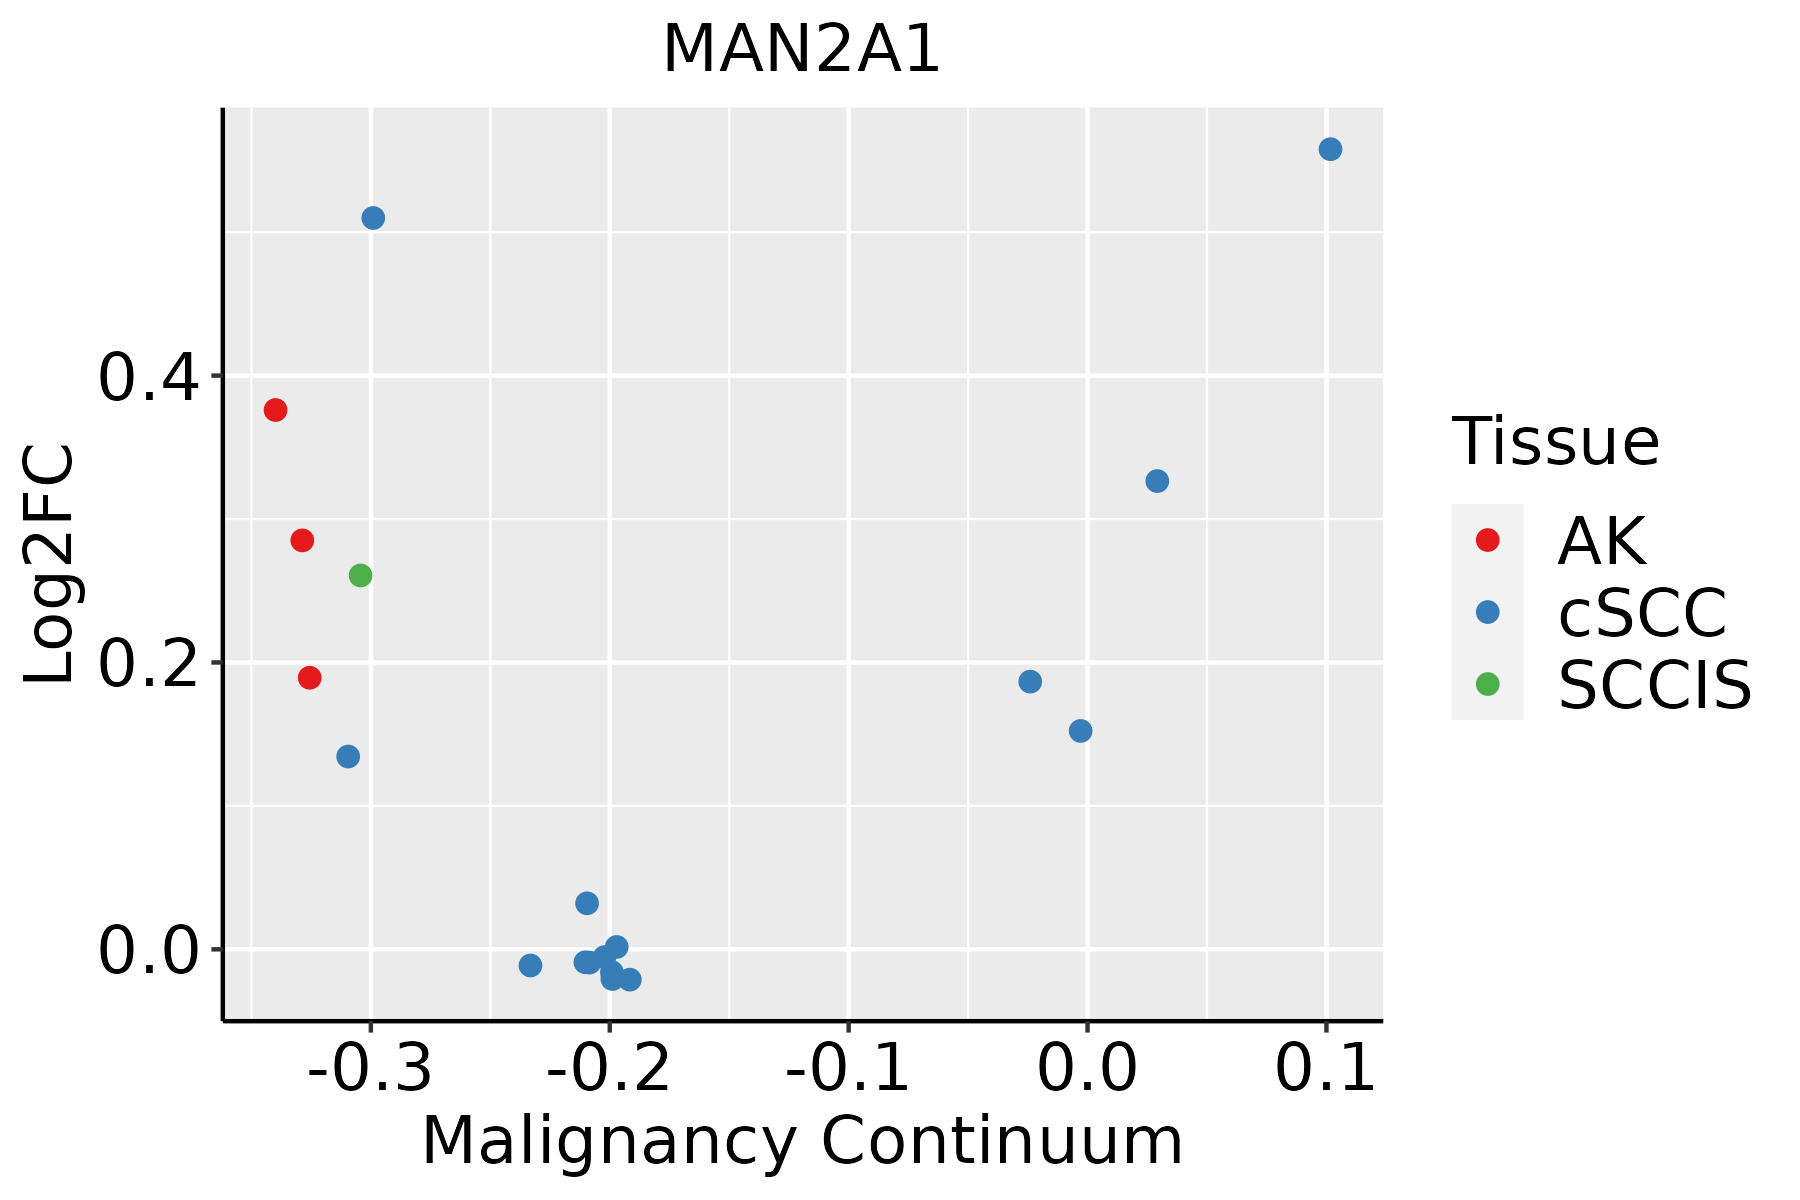 | AK: Actinic keratosis |
| cSCC: Cutaneous squamous cell carcinoma | ||
| SCCIS:squamous cell carcinoma in situ | ||
| Thyroid | 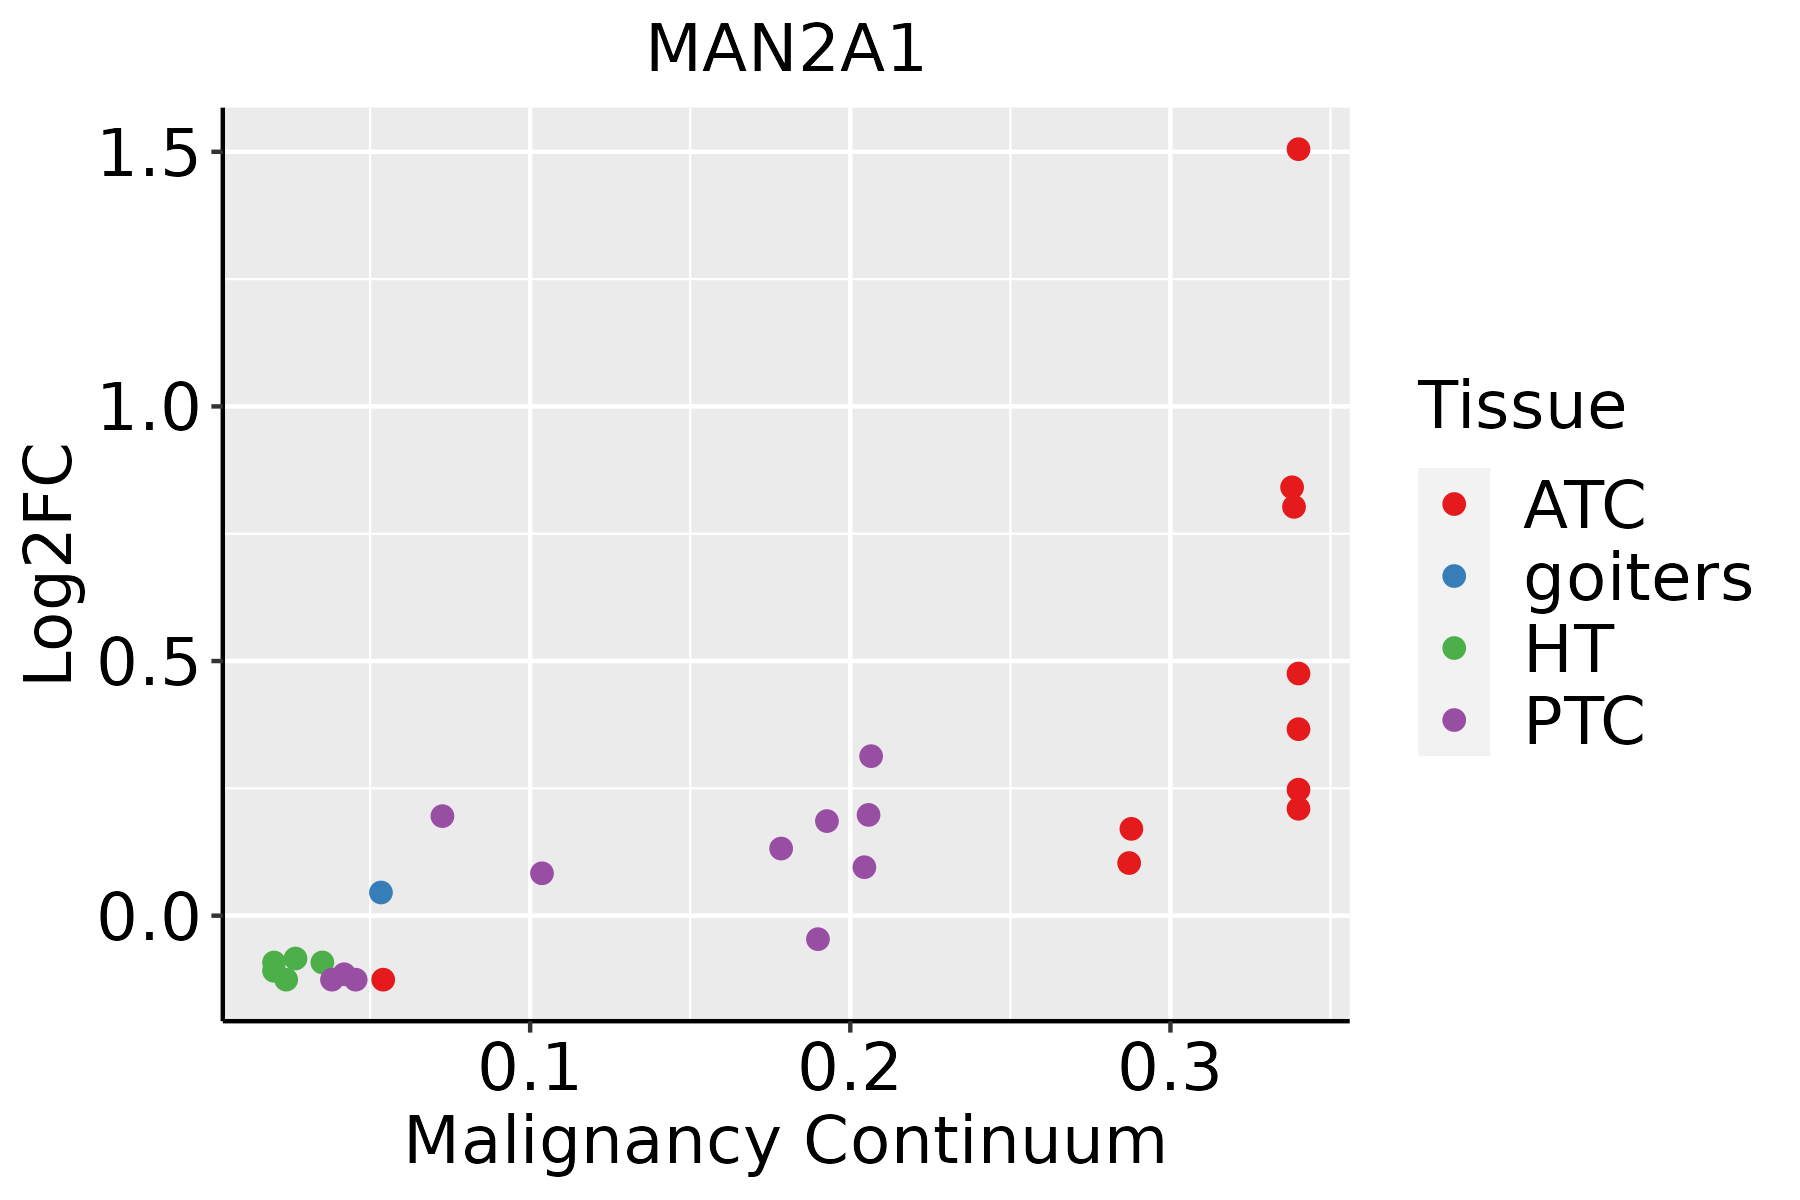 | ATC: Anaplastic thyroid cancer |
| HT: Hashimoto's thyroiditis | ||
| PTC: Papillary thyroid cancer |
| ∗log2FC in expression of this searched gene in stem-like cells from each diseased tissue sample relative to stem-like cells in normal samples in each tissue plotted against the malignancy continuum. Samples are colored based on if they are from different disease stage. |
Top |
Malignant transformation related pathway analysis |
| Find out the enriched GO biological processes and KEGG pathways involved in transition from healthy to precancer to cancer |
| Tissue | Disease Stage | Enriched GO biological Processes |
| Colorectum | AD |  |
| Colorectum | SER |  |
| Colorectum | MSS |  |
| Colorectum | MSI-H |  |
| Colorectum | FAP |  |
| ∗Top 15 enriched GO BP terms are showed in the bar plot of each disease state in each tissue. Each row represents a significant GO biological process which is colored according to the -log10(p.adjust). |
| Page: 1 2 3 4 5 6 7 8 9 |
| GO ID | Tissue | Disease Stage | Description | Gene Ratio | Bg Ratio | pvalue | p.adjust | Count |
| GO:001603210 | Cervix | CC | viral process | 109/2311 | 415/18723 | 5.40e-15 | 6.46e-12 | 109 |
| GO:00107206 | Cervix | CC | positive regulation of cell development | 64/2311 | 298/18723 | 5.69e-06 | 1.41e-04 | 64 |
| GO:004873210 | Cervix | CC | gland development | 84/2311 | 436/18723 | 1.93e-05 | 3.54e-04 | 84 |
| GO:00017018 | Cervix | CC | in utero embryonic development | 71/2311 | 367/18723 | 7.21e-05 | 1.00e-03 | 71 |
| GO:00610089 | Cervix | CC | hepaticobiliary system development | 34/2311 | 150/18723 | 2.92e-04 | 3.14e-03 | 34 |
| GO:00018899 | Cervix | CC | liver development | 33/2311 | 147/18723 | 4.27e-04 | 4.30e-03 | 33 |
| GO:00519603 | Cervix | CC | regulation of nervous system development | 77/2311 | 443/18723 | 1.13e-03 | 9.30e-03 | 77 |
| GO:00507676 | Cervix | CC | regulation of neurogenesis | 65/2311 | 364/18723 | 1.33e-03 | 1.05e-02 | 65 |
| GO:00303245 | Cervix | CC | lung development | 36/2311 | 177/18723 | 1.64e-03 | 1.26e-02 | 36 |
| GO:00507694 | Cervix | CC | positive regulation of neurogenesis | 43/2311 | 225/18723 | 2.25e-03 | 1.61e-02 | 43 |
| GO:00303235 | Cervix | CC | respiratory tube development | 36/2311 | 181/18723 | 2.46e-03 | 1.71e-02 | 36 |
| GO:00605413 | Cervix | CC | respiratory system development | 39/2311 | 203/18723 | 3.18e-03 | 2.07e-02 | 39 |
| GO:00190807 | Cervix | CC | viral gene expression | 21/2311 | 94/18723 | 4.68e-03 | 2.82e-02 | 21 |
| GO:0150063 | Cervix | CC | visual system development | 63/2311 | 375/18723 | 6.58e-03 | 3.65e-02 | 63 |
| GO:00519622 | Cervix | CC | positive regulation of nervous system development | 48/2311 | 272/18723 | 6.60e-03 | 3.65e-02 | 48 |
| GO:0001654 | Cervix | CC | eye development | 62/2311 | 371/18723 | 7.83e-03 | 4.13e-02 | 62 |
| GO:0048880 | Cervix | CC | sensory system development | 63/2311 | 381/18723 | 9.29e-03 | 4.66e-02 | 63 |
| GO:0016032 | Colorectum | AD | viral process | 168/3918 | 415/18723 | 4.67e-20 | 3.66e-17 | 168 |
| GO:0048732 | Colorectum | AD | gland development | 149/3918 | 436/18723 | 6.07e-11 | 6.33e-09 | 149 |
| GO:0019080 | Colorectum | AD | viral gene expression | 42/3918 | 94/18723 | 1.90e-07 | 8.02e-06 | 42 |
| Page: 1 2 3 4 5 6 7 8 9 10 11 12 13 14 15 |
| Pathway ID | Tissue | Disease Stage | Description | Gene Ratio | Bg Ratio | pvalue | p.adjust | qvalue | Count |
| hsa00510 | Colorectum | AD | N-Glycan biosynthesis | 21/2092 | 53/8465 | 1.15e-02 | 4.24e-02 | 2.71e-02 | 21 |
| hsa005101 | Colorectum | AD | N-Glycan biosynthesis | 21/2092 | 53/8465 | 1.15e-02 | 4.24e-02 | 2.71e-02 | 21 |
| hsa0051023 | Esophagus | ESCC | N-Glycan biosynthesis | 39/4205 | 53/8465 | 3.26e-04 | 1.15e-03 | 5.89e-04 | 39 |
| hsa005136 | Esophagus | ESCC | Various types of N-glycan biosynthesis | 31/4205 | 42/8465 | 1.23e-03 | 3.78e-03 | 1.93e-03 | 31 |
| hsa0051033 | Esophagus | ESCC | N-Glycan biosynthesis | 39/4205 | 53/8465 | 3.26e-04 | 1.15e-03 | 5.89e-04 | 39 |
| hsa0051313 | Esophagus | ESCC | Various types of N-glycan biosynthesis | 31/4205 | 42/8465 | 1.23e-03 | 3.78e-03 | 1.93e-03 | 31 |
| hsa005104 | Liver | Cirrhotic | N-Glycan biosynthesis | 32/2530 | 53/8465 | 3.82e-06 | 4.10e-05 | 2.53e-05 | 32 |
| hsa005134 | Liver | Cirrhotic | Various types of N-glycan biosynthesis | 26/2530 | 42/8465 | 1.65e-05 | 1.41e-04 | 8.69e-05 | 26 |
| hsa0051011 | Liver | Cirrhotic | N-Glycan biosynthesis | 32/2530 | 53/8465 | 3.82e-06 | 4.10e-05 | 2.53e-05 | 32 |
| hsa0051311 | Liver | Cirrhotic | Various types of N-glycan biosynthesis | 26/2530 | 42/8465 | 1.65e-05 | 1.41e-04 | 8.69e-05 | 26 |
| hsa0051021 | Liver | HCC | N-Glycan biosynthesis | 40/4020 | 53/8465 | 2.95e-05 | 1.87e-04 | 1.04e-04 | 40 |
| hsa005132 | Liver | HCC | Various types of N-glycan biosynthesis | 30/4020 | 42/8465 | 1.41e-03 | 5.07e-03 | 2.82e-03 | 30 |
| hsa0051031 | Liver | HCC | N-Glycan biosynthesis | 40/4020 | 53/8465 | 2.95e-05 | 1.87e-04 | 1.04e-04 | 40 |
| hsa005133 | Liver | HCC | Various types of N-glycan biosynthesis | 30/4020 | 42/8465 | 1.41e-03 | 5.07e-03 | 2.82e-03 | 30 |
| hsa005105 | Oral cavity | OSCC | N-Glycan biosynthesis | 39/3704 | 53/8465 | 9.77e-06 | 4.36e-05 | 2.22e-05 | 39 |
| hsa005135 | Oral cavity | OSCC | Various types of N-glycan biosynthesis | 29/3704 | 42/8465 | 8.03e-04 | 2.32e-03 | 1.18e-03 | 29 |
| hsa0051012 | Oral cavity | OSCC | N-Glycan biosynthesis | 39/3704 | 53/8465 | 9.77e-06 | 4.36e-05 | 2.22e-05 | 39 |
| hsa0051312 | Oral cavity | OSCC | Various types of N-glycan biosynthesis | 29/3704 | 42/8465 | 8.03e-04 | 2.32e-03 | 1.18e-03 | 29 |
| Page: 1 |
Top |
Cell-cell communication analysis |
| Identification of potential cell-cell interactions between two cell types and their ligand-receptor pairs for different disease states |
| Ligand | Receptor | LRpair | Pathway | Tissue | Disease Stage |
| Page: 1 |
Top |
Single-cell gene regulatory network inference analysis |
| Find out the significant the regulons (TFs) and the target genes of each regulon across cell types for different disease states |
| TF | Cell Type | Tissue | Disease Stage | Target Gene | RSS | Regulon Activity |
| ∗The dot plots of a searched regulon are shown for all cell subpopulations in each disease state of each tissue based on the regulon specific score inferred using pySCENIC and by calculating the average expression. |
| Page: 1 |
Top |
Somatic mutation of malignant transformation related genes |
| Annotation of somatic variants for genes involved in malignant transformation |
| Hugo Symbol | Variant Class | Variant Classification | dbSNP RS | HGVSc | HGVSp | HGVSp Short | SWISSPROT | BIOTYPE | SIFT | PolyPhen | Tumor Sample Barcode | Tissue | Histology | Sex | Age | Stage | Therapy Types | Drugs | Outcome |
| MAN2A1 | SNV | Missense_Mutation | novel | c.1679N>A | p.Arg560Lys | p.R560K | Q16706 | protein_coding | deleterious(0.01) | probably_damaging(0.997) | TCGA-5L-AAT1-01 | Breast | breast invasive carcinoma | Female | <65 | III/IV | Hormone Therapy | letrozol | SD |
| MAN2A1 | SNV | Missense_Mutation | novel | c.2344N>C | p.Glu782Gln | p.E782Q | Q16706 | protein_coding | tolerated(0.26) | benign(0.026) | TCGA-5L-AAT1-01 | Breast | breast invasive carcinoma | Female | <65 | III/IV | Hormone Therapy | letrozol | SD |
| MAN2A1 | SNV | Missense_Mutation | rs748133805 | c.2626N>T | p.Arg876Cys | p.R876C | Q16706 | protein_coding | tolerated(0.06) | possibly_damaging(0.901) | TCGA-A8-A09G-01 | Breast | breast invasive carcinoma | Female | >=65 | III/IV | Unknown | Unknown | SD |
| MAN2A1 | SNV | Missense_Mutation | c.599N>C | p.Val200Ala | p.V200A | Q16706 | protein_coding | deleterious(0.05) | possibly_damaging(0.838) | TCGA-A8-A09Z-01 | Breast | breast invasive carcinoma | Female | >=65 | I/II | Unknown | Unknown | SD | |
| MAN2A1 | SNV | Missense_Mutation | c.3373N>G | p.Asn1125Asp | p.N1125D | Q16706 | protein_coding | deleterious(0.05) | possibly_damaging(0.627) | TCGA-AR-A0TP-01 | Breast | breast invasive carcinoma | Female | <65 | I/II | Chemotherapy | doxorubicin | SD | |
| MAN2A1 | SNV | Missense_Mutation | rs758664411 | c.3191N>G | p.Asn1064Ser | p.N1064S | Q16706 | protein_coding | tolerated(0.35) | benign(0.012) | TCGA-AR-A0TU-01 | Breast | breast invasive carcinoma | Female | <65 | I/II | Unspecific | Doxorubicin | SD |
| MAN2A1 | SNV | Missense_Mutation | novel | c.2626N>A | p.Arg876Ser | p.R876S | Q16706 | protein_coding | deleterious(0.03) | possibly_damaging(0.548) | TCGA-BH-A0BM-01 | Breast | breast invasive carcinoma | Female | <65 | I/II | Chemotherapy | adriamycin | SD |
| MAN2A1 | SNV | Missense_Mutation | c.3393N>C | p.Leu1131Phe | p.L1131F | Q16706 | protein_coding | deleterious(0) | possibly_damaging(0.795) | TCGA-C8-A26Y-01 | Breast | breast invasive carcinoma | Female | >=65 | I/II | Unknown | Unknown | SD | |
| MAN2A1 | SNV | Missense_Mutation | c.746N>T | p.Gly249Val | p.G249V | Q16706 | protein_coding | deleterious(0) | probably_damaging(0.999) | TCGA-D8-A140-01 | Breast | breast invasive carcinoma | Female | <65 | I/II | Chemotherapy | doxorubicin+cyclophosphamid | SD | |
| MAN2A1 | SNV | Missense_Mutation | c.1255C>T | p.Leu419Phe | p.L419F | Q16706 | protein_coding | deleterious(0) | probably_damaging(0.976) | TCGA-C5-A3HE-01 | Cervix | cervical & endocervical cancer | Female | <65 | I/II | Unknown | Unknown | PD |
| Page: 1 2 3 4 5 6 7 8 9 10 11 12 13 14 15 |
Top |
Related drugs of malignant transformation related genes |
| Identification of chemicals and drugs interact with genes involved in malignant transfromation |
| (DGIdb 4.0) |
| Entrez ID | Symbol | Category | Interaction Types | Drug Claim Name | Drug Name | PMIDs |
| Page: 1 |

Copyright 2023-Present -The University of Texas Health Science Center at Houston |