| Tissue | Expression Dynamics | Abbreviation |
| Esophagus |  | ESCC: Esophageal squamous cell carcinoma |
| HGIN: High-grade intraepithelial neoplasias |
| LGIN: Low-grade intraepithelial neoplasias |
| Liver | 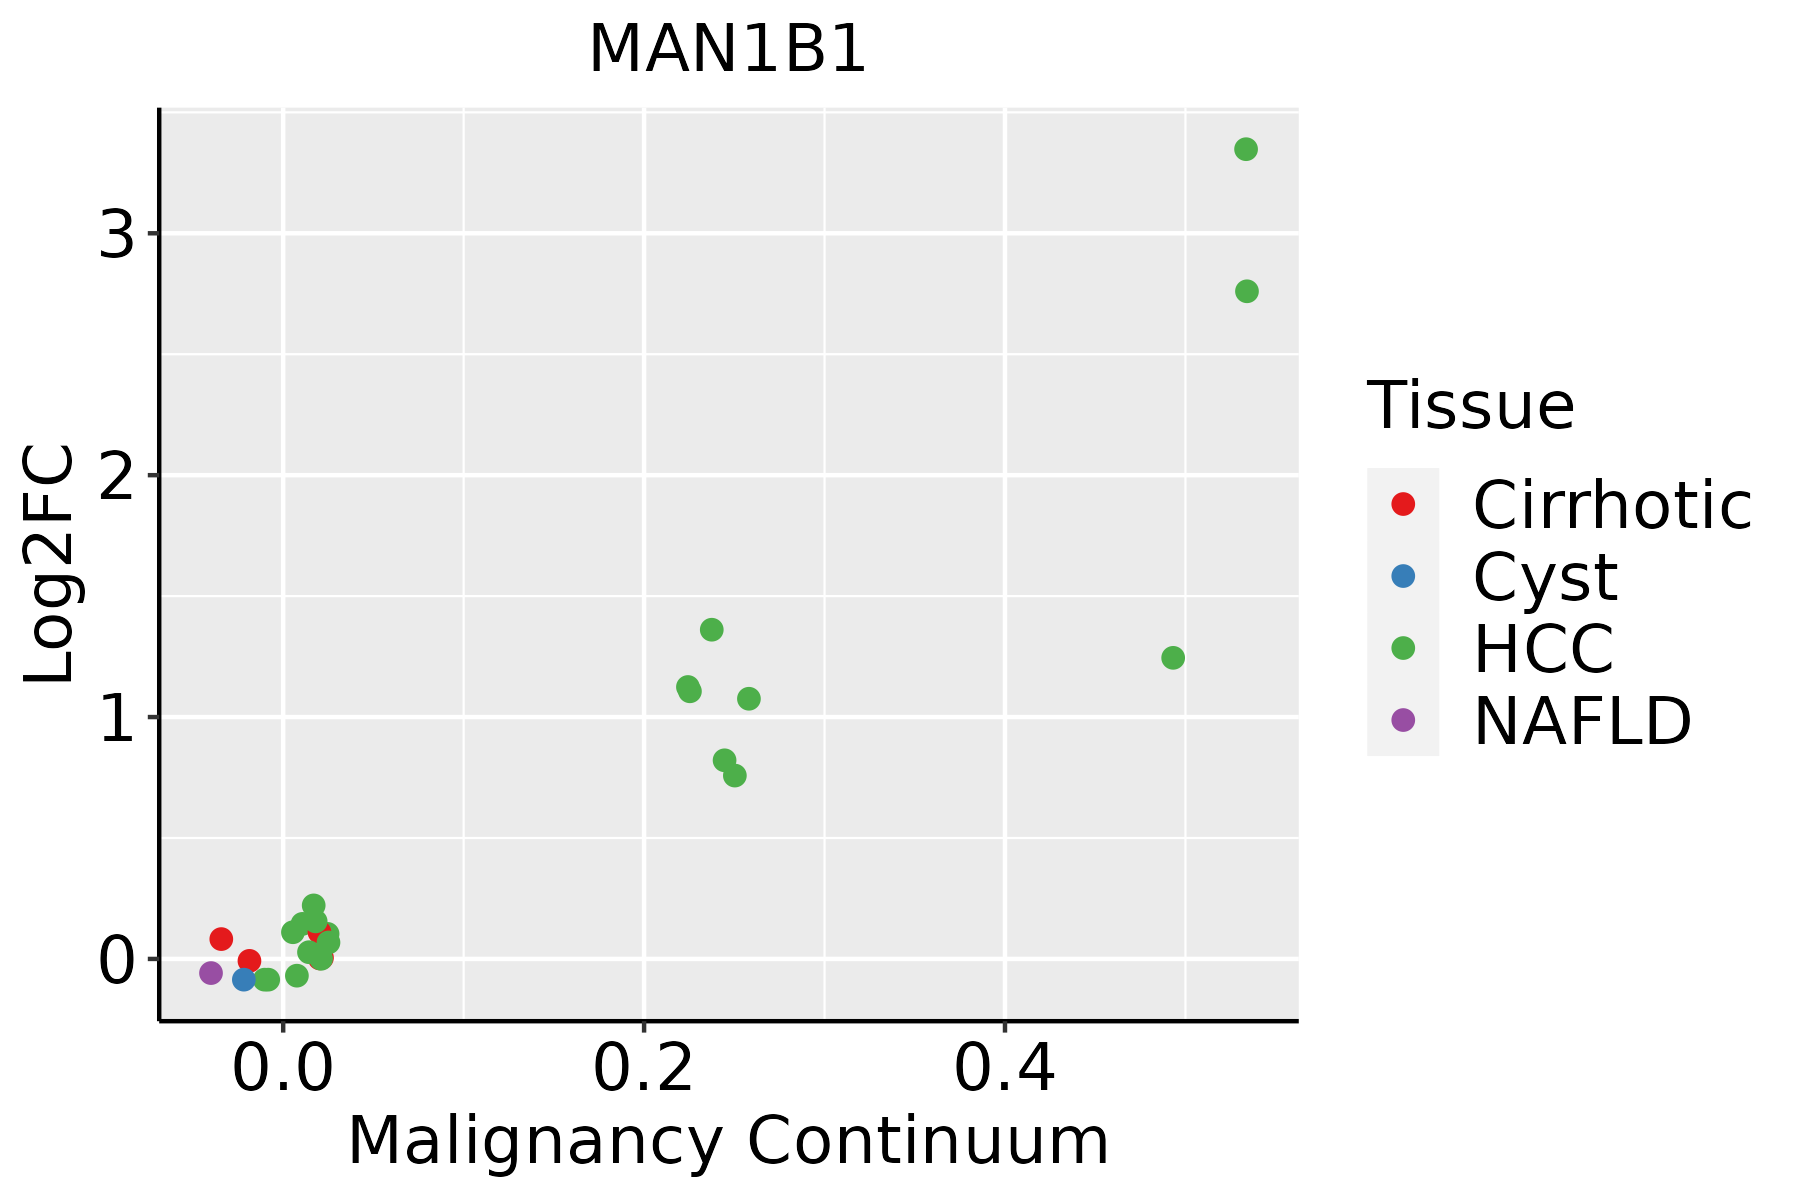 | HCC: Hepatocellular carcinoma |
| NAFLD: Non-alcoholic fatty liver disease |
| Oral Cavity | 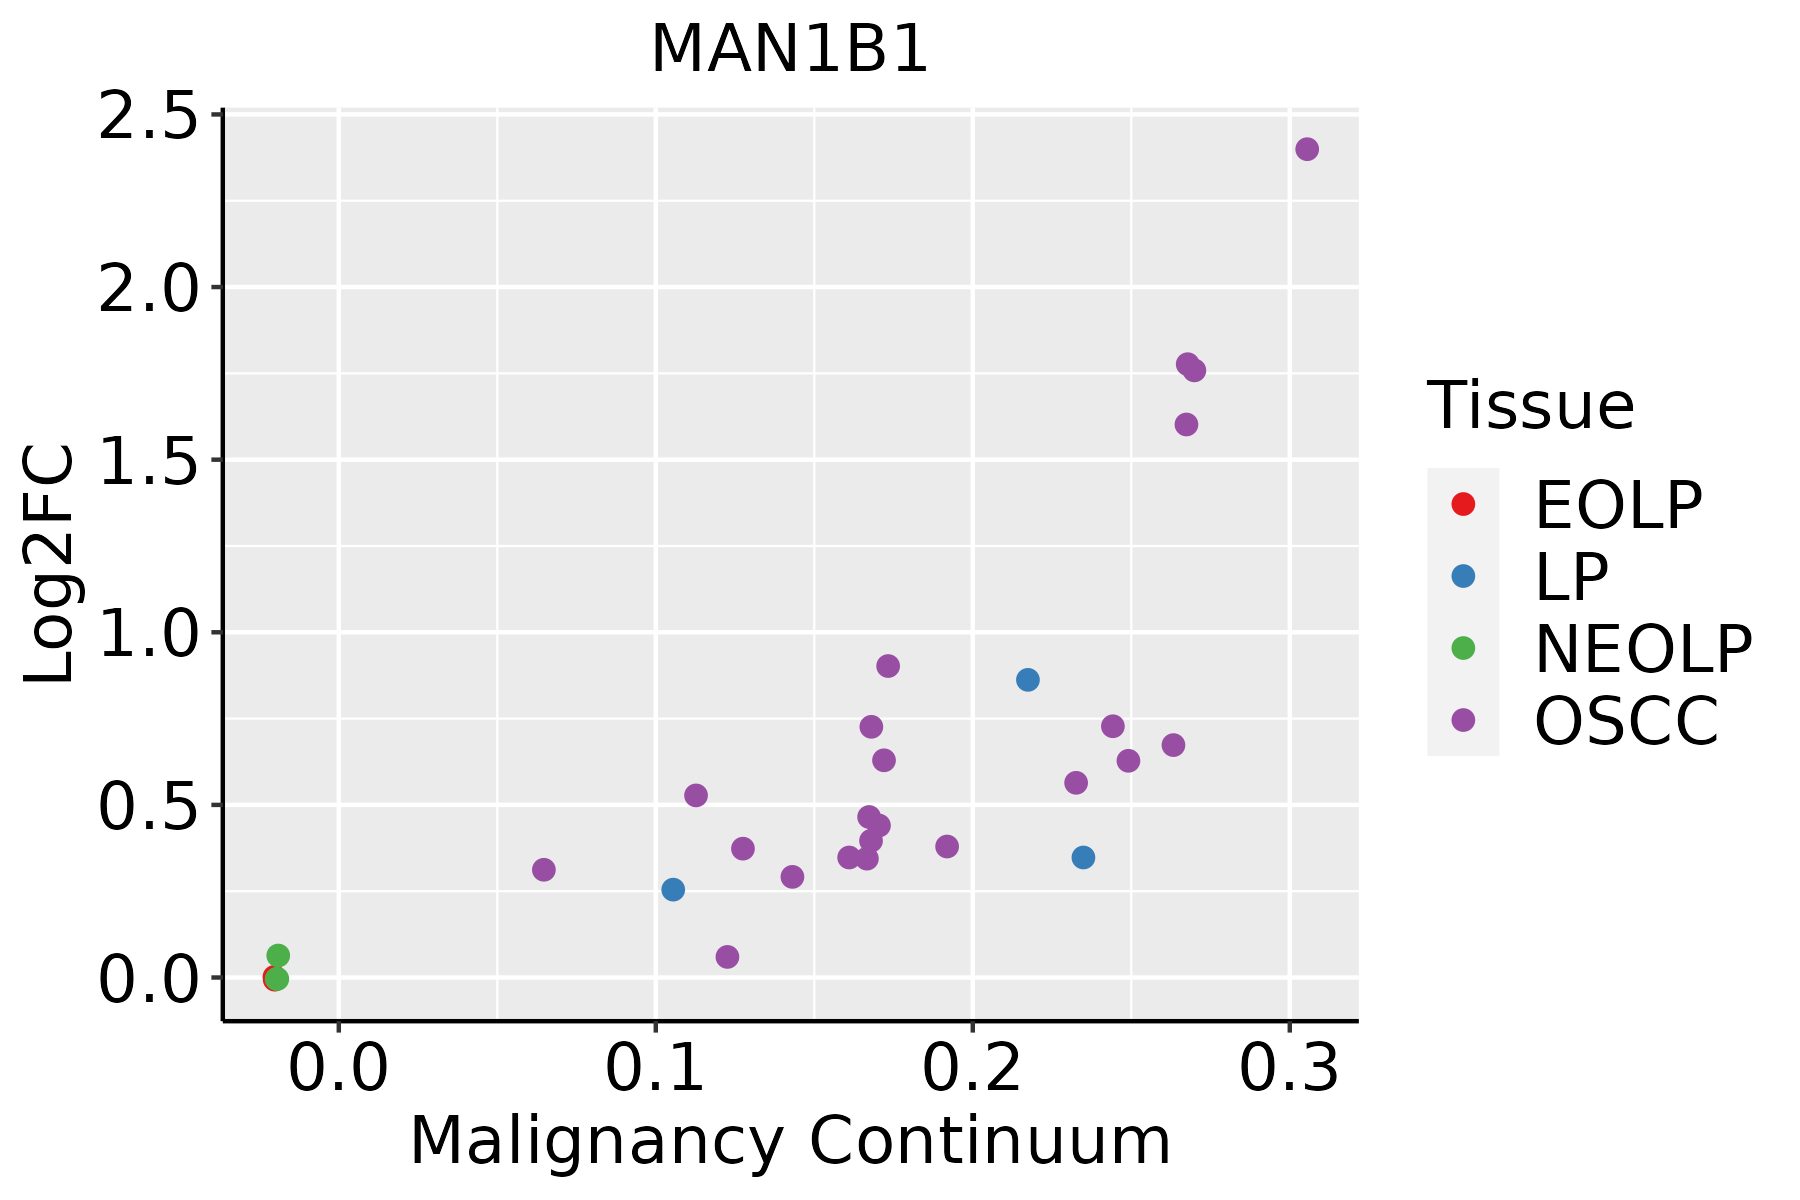 | EOLP: Erosive Oral lichen planus |
| LP: leukoplakia |
| NEOLP: Non-erosive oral lichen planus |
| OSCC: Oral squamous cell carcinoma |
| Skin |  | AK: Actinic keratosis |
| cSCC: Cutaneous squamous cell carcinoma |
| SCCIS:squamous cell carcinoma in situ |
| Thyroid | 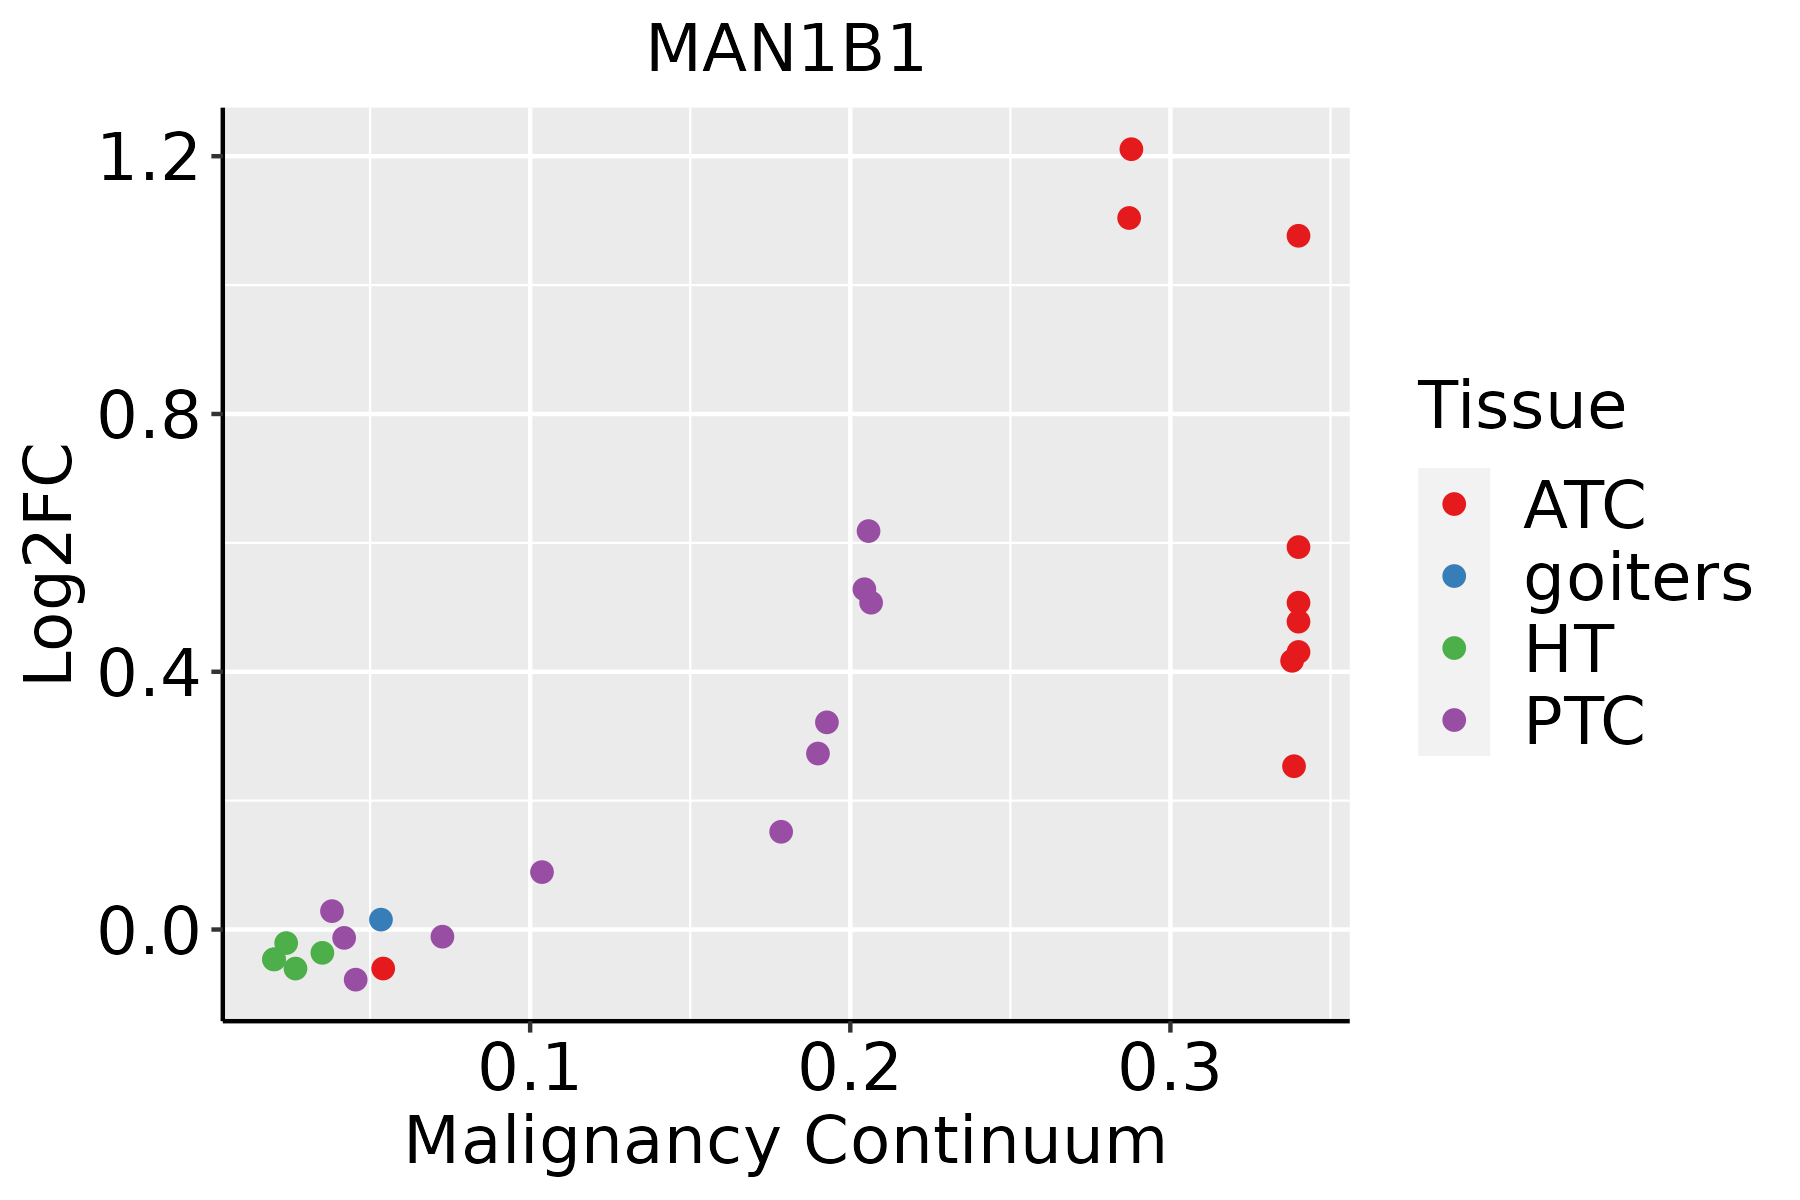 | ATC: Anaplastic thyroid cancer |
| HT: Hashimoto's thyroiditis |
| PTC: Papillary thyroid cancer |
| GO ID | Tissue | Disease Stage | Description | Gene Ratio | Bg Ratio | pvalue | p.adjust | Count |
| GO:0010498111 | Esophagus | ESCC | proteasomal protein catabolic process | 369/8552 | 490/18723 | 1.13e-41 | 1.80e-38 | 369 |
| GO:0043161111 | Esophagus | ESCC | proteasome-mediated ubiquitin-dependent protein catabolic process | 312/8552 | 412/18723 | 3.53e-36 | 4.48e-33 | 312 |
| GO:0016032111 | Esophagus | ESCC | viral process | 301/8552 | 415/18723 | 3.34e-29 | 1.32e-26 | 301 |
| GO:0034976111 | Esophagus | ESCC | response to endoplasmic reticulum stress | 192/8552 | 256/18723 | 7.15e-22 | 1.30e-19 | 192 |
| GO:001908017 | Esophagus | ESCC | viral gene expression | 80/8552 | 94/18723 | 2.04e-15 | 1.28e-13 | 80 |
| GO:003650315 | Esophagus | ESCC | ERAD pathway | 82/8552 | 107/18723 | 5.80e-11 | 1.84e-09 | 82 |
| GO:003043314 | Esophagus | ESCC | ubiquitin-dependent ERAD pathway | 66/8552 | 85/18723 | 1.64e-09 | 3.78e-08 | 66 |
| GO:00091002 | Esophagus | ESCC | glycoprotein metabolic process | 226/8552 | 387/18723 | 2.64e-07 | 3.94e-06 | 226 |
| GO:00700854 | Esophagus | ESCC | glycosylation | 144/8552 | 240/18723 | 5.12e-06 | 5.38e-05 | 144 |
| GO:00064865 | Esophagus | ESCC | protein glycosylation | 135/8552 | 226/18723 | 1.36e-05 | 1.24e-04 | 135 |
| GO:00434135 | Esophagus | ESCC | macromolecule glycosylation | 135/8552 | 226/18723 | 1.36e-05 | 1.24e-04 | 135 |
| GO:00091012 | Esophagus | ESCC | glycoprotein biosynthetic process | 181/8552 | 317/18723 | 2.54e-05 | 2.15e-04 | 181 |
| GO:00190826 | Esophagus | ESCC | viral protein processing | 24/8552 | 29/18723 | 4.50e-05 | 3.55e-04 | 24 |
| GO:19011362 | Esophagus | ESCC | carbohydrate derivative catabolic process | 99/8552 | 172/18723 | 1.11e-03 | 5.54e-03 | 99 |
| GO:00065173 | Esophagus | ESCC | protein deglycosylation | 19/8552 | 26/18723 | 4.31e-03 | 1.71e-02 | 19 |
| GO:0006516 | Esophagus | ESCC | glycoprotein catabolic process | 19/8552 | 28/18723 | 1.49e-02 | 4.84e-02 | 19 |
| GO:001603212 | Liver | Cirrhotic | viral process | 203/4634 | 415/18723 | 5.40e-27 | 3.76e-24 | 203 |
| GO:001049812 | Liver | Cirrhotic | proteasomal protein catabolic process | 216/4634 | 490/18723 | 2.52e-21 | 9.29e-19 | 216 |
| GO:00349767 | Liver | Cirrhotic | response to endoplasmic reticulum stress | 130/4634 | 256/18723 | 1.72e-19 | 3.86e-17 | 130 |
| GO:004316112 | Liver | Cirrhotic | proteasome-mediated ubiquitin-dependent protein catabolic process | 184/4634 | 412/18723 | 4.52e-19 | 8.85e-17 | 184 |
| Pathway ID | Tissue | Disease Stage | Description | Gene Ratio | Bg Ratio | pvalue | p.adjust | qvalue | Count |
| hsa04141211 | Esophagus | ESCC | Protein processing in endoplasmic reticulum | 147/4205 | 174/8465 | 3.29e-22 | 1.10e-19 | 5.64e-20 | 147 |
| hsa0051023 | Esophagus | ESCC | N-Glycan biosynthesis | 39/4205 | 53/8465 | 3.26e-04 | 1.15e-03 | 5.89e-04 | 39 |
| hsa005136 | Esophagus | ESCC | Various types of N-glycan biosynthesis | 31/4205 | 42/8465 | 1.23e-03 | 3.78e-03 | 1.93e-03 | 31 |
| hsa04141310 | Esophagus | ESCC | Protein processing in endoplasmic reticulum | 147/4205 | 174/8465 | 3.29e-22 | 1.10e-19 | 5.64e-20 | 147 |
| hsa0051033 | Esophagus | ESCC | N-Glycan biosynthesis | 39/4205 | 53/8465 | 3.26e-04 | 1.15e-03 | 5.89e-04 | 39 |
| hsa0051313 | Esophagus | ESCC | Various types of N-glycan biosynthesis | 31/4205 | 42/8465 | 1.23e-03 | 3.78e-03 | 1.93e-03 | 31 |
| hsa0414114 | Liver | Cirrhotic | Protein processing in endoplasmic reticulum | 114/2530 | 174/8465 | 1.16e-22 | 9.67e-21 | 5.96e-21 | 114 |
| hsa005104 | Liver | Cirrhotic | N-Glycan biosynthesis | 32/2530 | 53/8465 | 3.82e-06 | 4.10e-05 | 2.53e-05 | 32 |
| hsa005134 | Liver | Cirrhotic | Various types of N-glycan biosynthesis | 26/2530 | 42/8465 | 1.65e-05 | 1.41e-04 | 8.69e-05 | 26 |
| hsa0414115 | Liver | Cirrhotic | Protein processing in endoplasmic reticulum | 114/2530 | 174/8465 | 1.16e-22 | 9.67e-21 | 5.96e-21 | 114 |
| hsa0051011 | Liver | Cirrhotic | N-Glycan biosynthesis | 32/2530 | 53/8465 | 3.82e-06 | 4.10e-05 | 2.53e-05 | 32 |
| hsa0051311 | Liver | Cirrhotic | Various types of N-glycan biosynthesis | 26/2530 | 42/8465 | 1.65e-05 | 1.41e-04 | 8.69e-05 | 26 |
| hsa0414122 | Liver | HCC | Protein processing in endoplasmic reticulum | 146/4020 | 174/8465 | 7.34e-24 | 2.46e-21 | 1.37e-21 | 146 |
| hsa0051021 | Liver | HCC | N-Glycan biosynthesis | 40/4020 | 53/8465 | 2.95e-05 | 1.87e-04 | 1.04e-04 | 40 |
| hsa005132 | Liver | HCC | Various types of N-glycan biosynthesis | 30/4020 | 42/8465 | 1.41e-03 | 5.07e-03 | 2.82e-03 | 30 |
| hsa0414132 | Liver | HCC | Protein processing in endoplasmic reticulum | 146/4020 | 174/8465 | 7.34e-24 | 2.46e-21 | 1.37e-21 | 146 |
| hsa0051031 | Liver | HCC | N-Glycan biosynthesis | 40/4020 | 53/8465 | 2.95e-05 | 1.87e-04 | 1.04e-04 | 40 |
| hsa005133 | Liver | HCC | Various types of N-glycan biosynthesis | 30/4020 | 42/8465 | 1.41e-03 | 5.07e-03 | 2.82e-03 | 30 |
| hsa0414130 | Oral cavity | OSCC | Protein processing in endoplasmic reticulum | 143/3704 | 174/8465 | 6.82e-26 | 2.28e-23 | 1.16e-23 | 143 |
| hsa005105 | Oral cavity | OSCC | N-Glycan biosynthesis | 39/3704 | 53/8465 | 9.77e-06 | 4.36e-05 | 2.22e-05 | 39 |
| Hugo Symbol | Variant Class | Variant Classification | dbSNP RS | HGVSc | HGVSp | HGVSp Short | SWISSPROT | BIOTYPE | SIFT | PolyPhen | Tumor Sample Barcode | Tissue | Histology | Sex | Age | Stage | Therapy Types | Drugs | Outcome |
| MAN1B1 | SNV | Missense_Mutation | novel | c.1607N>A | p.Gly536Asp | p.G536D | Q9UKM7 | protein_coding | deleterious(0) | probably_damaging(0.998) | TCGA-3C-AAAU-01 | Breast | breast invasive carcinoma | Female | <65 | I/II | Chemotherapy | zoladex | SD |
| MAN1B1 | SNV | Missense_Mutation | | c.1919N>T | p.Ser640Phe | p.S640F | Q9UKM7 | protein_coding | deleterious(0) | probably_damaging(1) | TCGA-AC-A23H-01 | Breast | breast invasive carcinoma | Female | >=65 | I/II | Unknown | Unknown | PD |
| MAN1B1 | SNV | Missense_Mutation | | c.376N>A | p.Ala126Thr | p.A126T | Q9UKM7 | protein_coding | tolerated(0.28) | benign(0) | TCGA-BH-A0HF-01 | Breast | breast invasive carcinoma | Female | >=65 | I/II | Hormone Therapy | arimidex | SD |
| MAN1B1 | SNV | Missense_Mutation | | c.988G>C | p.Glu330Gln | p.E330Q | Q9UKM7 | protein_coding | deleterious(0) | probably_damaging(1) | TCGA-E2-A159-01 | Breast | breast invasive carcinoma | Female | <65 | I/II | Chemotherapy | cyclophosphamide | SD |
| MAN1B1 | SNV | Missense_Mutation | | c.1857G>T | p.Trp619Cys | p.W619C | Q9UKM7 | protein_coding | deleterious(0) | probably_damaging(0.998) | TCGA-GM-A2DB-01 | Breast | breast invasive carcinoma | Female | <65 | I/II | Chemotherapy | taxol | CR |
| MAN1B1 | insertion | Frame_Shift_Ins | novel | c.763_764insTTTCGCGATGTTGGCGAGGCTGGTCTCAA | p.Asp255ValfsTer30 | p.D255Vfs*30 | Q9UKM7 | protein_coding | | | TCGA-AQ-A04J-01 | Breast | breast invasive carcinoma | Female | <65 | I/II | Chemotherapy | cytoxan | SD |
| MAN1B1 | insertion | Nonsense_Mutation | novel | c.765_766insTTCTGACCTCAG | p.Asp255_Val256insPheTerProGln | p.D255_V256insF*PQ | Q9UKM7 | protein_coding | | | TCGA-AQ-A04J-01 | Breast | breast invasive carcinoma | Female | <65 | I/II | Chemotherapy | cytoxan | SD |
| MAN1B1 | insertion | In_Frame_Ins | novel | c.885_886insCCAAAAAAATTTAAAAAAAGGGAACGAAGGGACTGTAGC | p.Leu295_Asp296insProLysLysPheLysLysArgGluArgArgAspCysSer | p.L295_D296insPKKFKKRERRDCS | Q9UKM7 | protein_coding | | | TCGA-BH-A0B4-01 | Breast | breast invasive carcinoma | Male | >=65 | III/IV | Hormone Therapy | tamoxiphen | SD |
| MAN1B1 | SNV | Missense_Mutation | | c.880N>A | p.Ala294Thr | p.A294T | Q9UKM7 | protein_coding | deleterious(0) | probably_damaging(0.945) | TCGA-2W-A8YY-01 | Cervix | cervical & endocervical cancer | Female | <65 | I/II | Chemotherapy | cisplatin | CR |
| MAN1B1 | SNV | Missense_Mutation | rs775259244 | c.1474N>A | p.Glu492Lys | p.E492K | Q9UKM7 | protein_coding | tolerated(0.23) | benign(0.041) | TCGA-2W-A8YY-01 | Cervix | cervical & endocervical cancer | Female | <65 | I/II | Chemotherapy | cisplatin | CR |


