
|
|||||
|
 | |
| |
| |
| |
| |
| |
|
Gene: MAML3 |
Gene summary for MAML3 |
| Gene information | Species | Human | Gene symbol | MAML3 | Gene ID | 55534 |
| Gene name | mastermind like transcriptional coactivator 3 | |
| Gene Alias | CAGH3 | |
| Cytomap | 4q31.1 | |
| Gene Type | protein-coding | GO ID | GO:0006139 | UniProtAcc | Q96JK9 |
Top |
Malignant transformation analysis |
| Identification of the aberrant gene expression in precancerous and cancerous lesions by comparing the gene expression of stem-like cells in diseased tissues with normal stem cells |
| Entrez ID | Symbol | Replicates | Species | Organ | Tissue | Adj P-value | Log2FC | Malignancy |
| 55534 | MAML3 | CCI_1 | Human | Cervix | CC | 9.97e-10 | 1.24e+00 | 0.528 |
| 55534 | MAML3 | CCI_3 | Human | Cervix | CC | 2.83e-03 | 9.23e-01 | 0.516 |
| 55534 | MAML3 | Tumor | Human | Cervix | CC | 3.08e-02 | -1.10e-01 | 0.1241 |
| 55534 | MAML3 | T3 | Human | Cervix | CC | 1.74e-03 | -1.17e-01 | 0.1389 |
| 55534 | MAML3 | HTA11_3410_2000001011 | Human | Colorectum | AD | 4.13e-02 | -2.67e-01 | 0.0155 |
| 55534 | MAML3 | HTA11_1938_2000001011 | Human | Colorectum | AD | 1.52e-08 | 7.08e-01 | -0.0811 |
| 55534 | MAML3 | HTA11_78_2000001011 | Human | Colorectum | AD | 2.44e-02 | 5.29e-01 | -0.1088 |
| 55534 | MAML3 | HTA11_347_2000001011 | Human | Colorectum | AD | 7.76e-23 | 1.03e+00 | -0.1954 |
| 55534 | MAML3 | HTA11_411_2000001011 | Human | Colorectum | SER | 1.19e-07 | 7.56e-01 | -0.2602 |
| 55534 | MAML3 | HTA11_83_2000001011 | Human | Colorectum | SER | 3.99e-03 | 4.98e-01 | -0.1526 |
| 55534 | MAML3 | HTA11_866_2000001011 | Human | Colorectum | AD | 4.29e-05 | 5.27e-01 | -0.1001 |
| 55534 | MAML3 | HTA11_1391_2000001011 | Human | Colorectum | AD | 2.14e-03 | 4.59e-01 | -0.059 |
| 55534 | MAML3 | HTA11_6818_2000001021 | Human | Colorectum | AD | 3.24e-05 | 5.24e-01 | 0.0588 |
| 55534 | MAML3 | HTA11_99999965062_69753 | Human | Colorectum | MSI-H | 7.98e-22 | 1.23e+00 | 0.3487 |
| 55534 | MAML3 | HTA11_99999965104_69814 | Human | Colorectum | MSS | 1.49e-06 | 6.41e-01 | 0.281 |
| 55534 | MAML3 | HTA11_99999973899_84307 | Human | Colorectum | MSS | 6.96e-10 | -6.92e-01 | 0.2585 |
| 55534 | MAML3 | HTA11_99999974143_84620 | Human | Colorectum | MSS | 8.36e-11 | -5.06e-01 | 0.3005 |
| 55534 | MAML3 | F007 | Human | Colorectum | FAP | 4.13e-02 | -2.02e-01 | 0.1176 |
| 55534 | MAML3 | A001-C-207 | Human | Colorectum | FAP | 1.02e-02 | -9.75e-02 | 0.1278 |
| 55534 | MAML3 | A015-C-203 | Human | Colorectum | FAP | 5.01e-35 | -6.29e-01 | -0.1294 |
| Page: 1 2 3 4 5 6 7 |
| Tissue | Expression Dynamics | Abbreviation |
| Cervix | 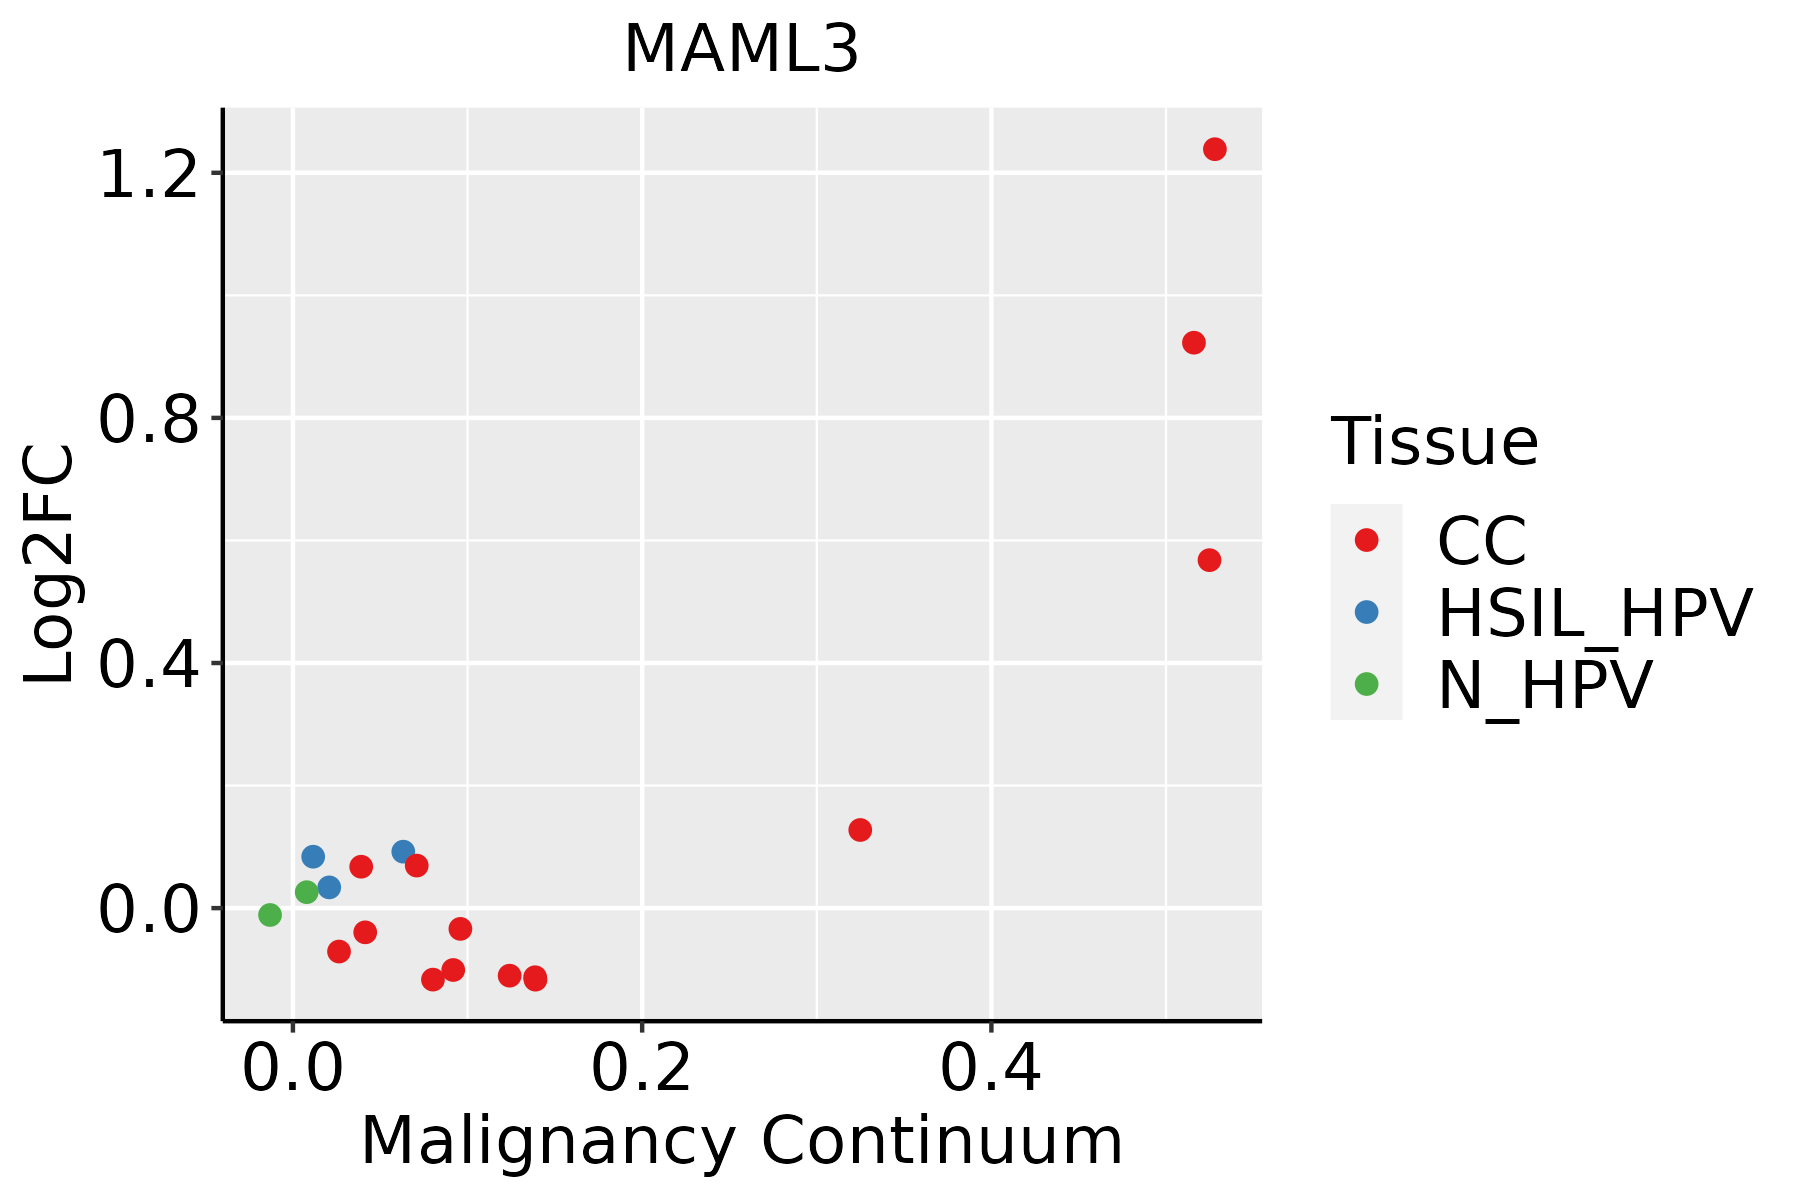 | CC: Cervix cancer |
| HSIL_HPV: HPV-infected high-grade squamous intraepithelial lesions | ||
| N_HPV: HPV-infected normal cervix | ||
| Colorectum (GSE201348) | 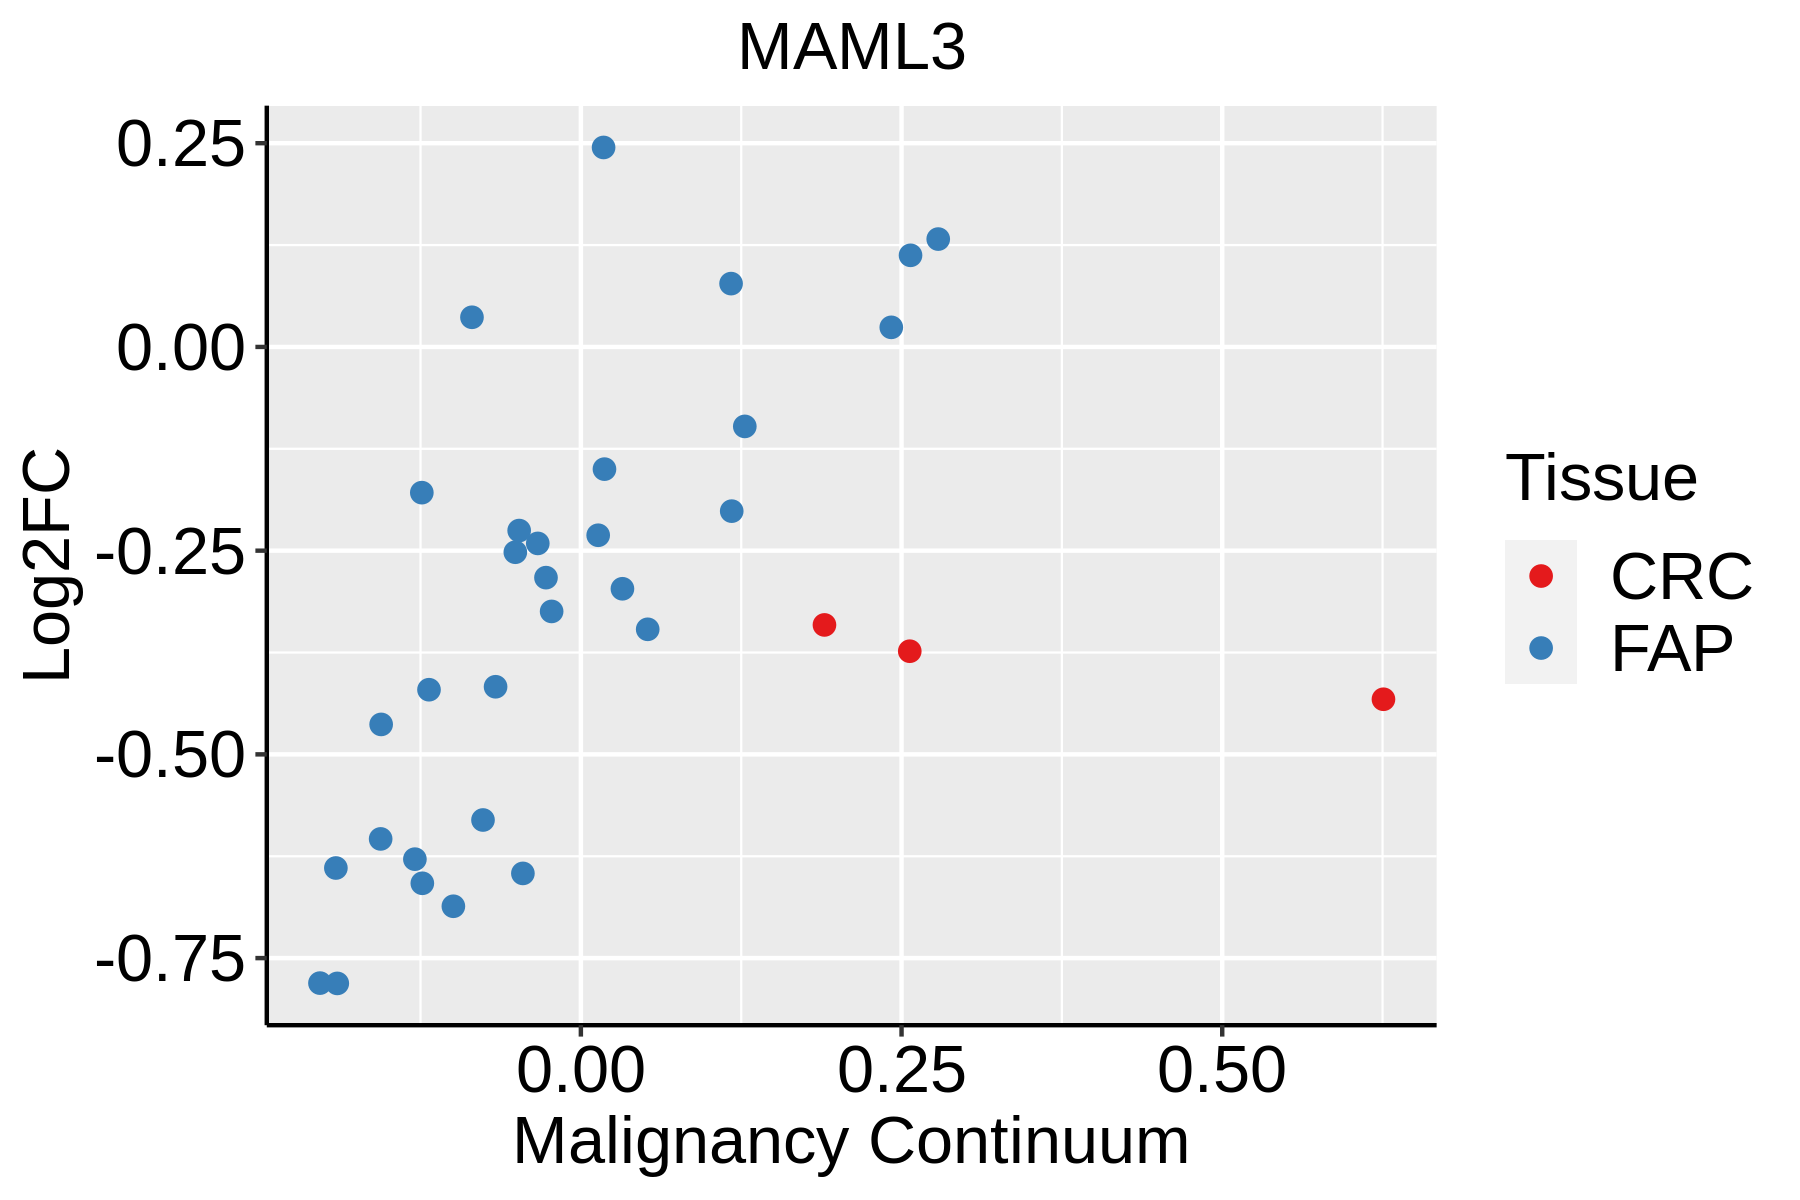 | FAP: Familial adenomatous polyposis |
| CRC: Colorectal cancer | ||
| Colorectum (HTA11) |  | AD: Adenomas |
| SER: Sessile serrated lesions | ||
| MSI-H: Microsatellite-high colorectal cancer | ||
| MSS: Microsatellite stable colorectal cancer | ||
| Endometrium | 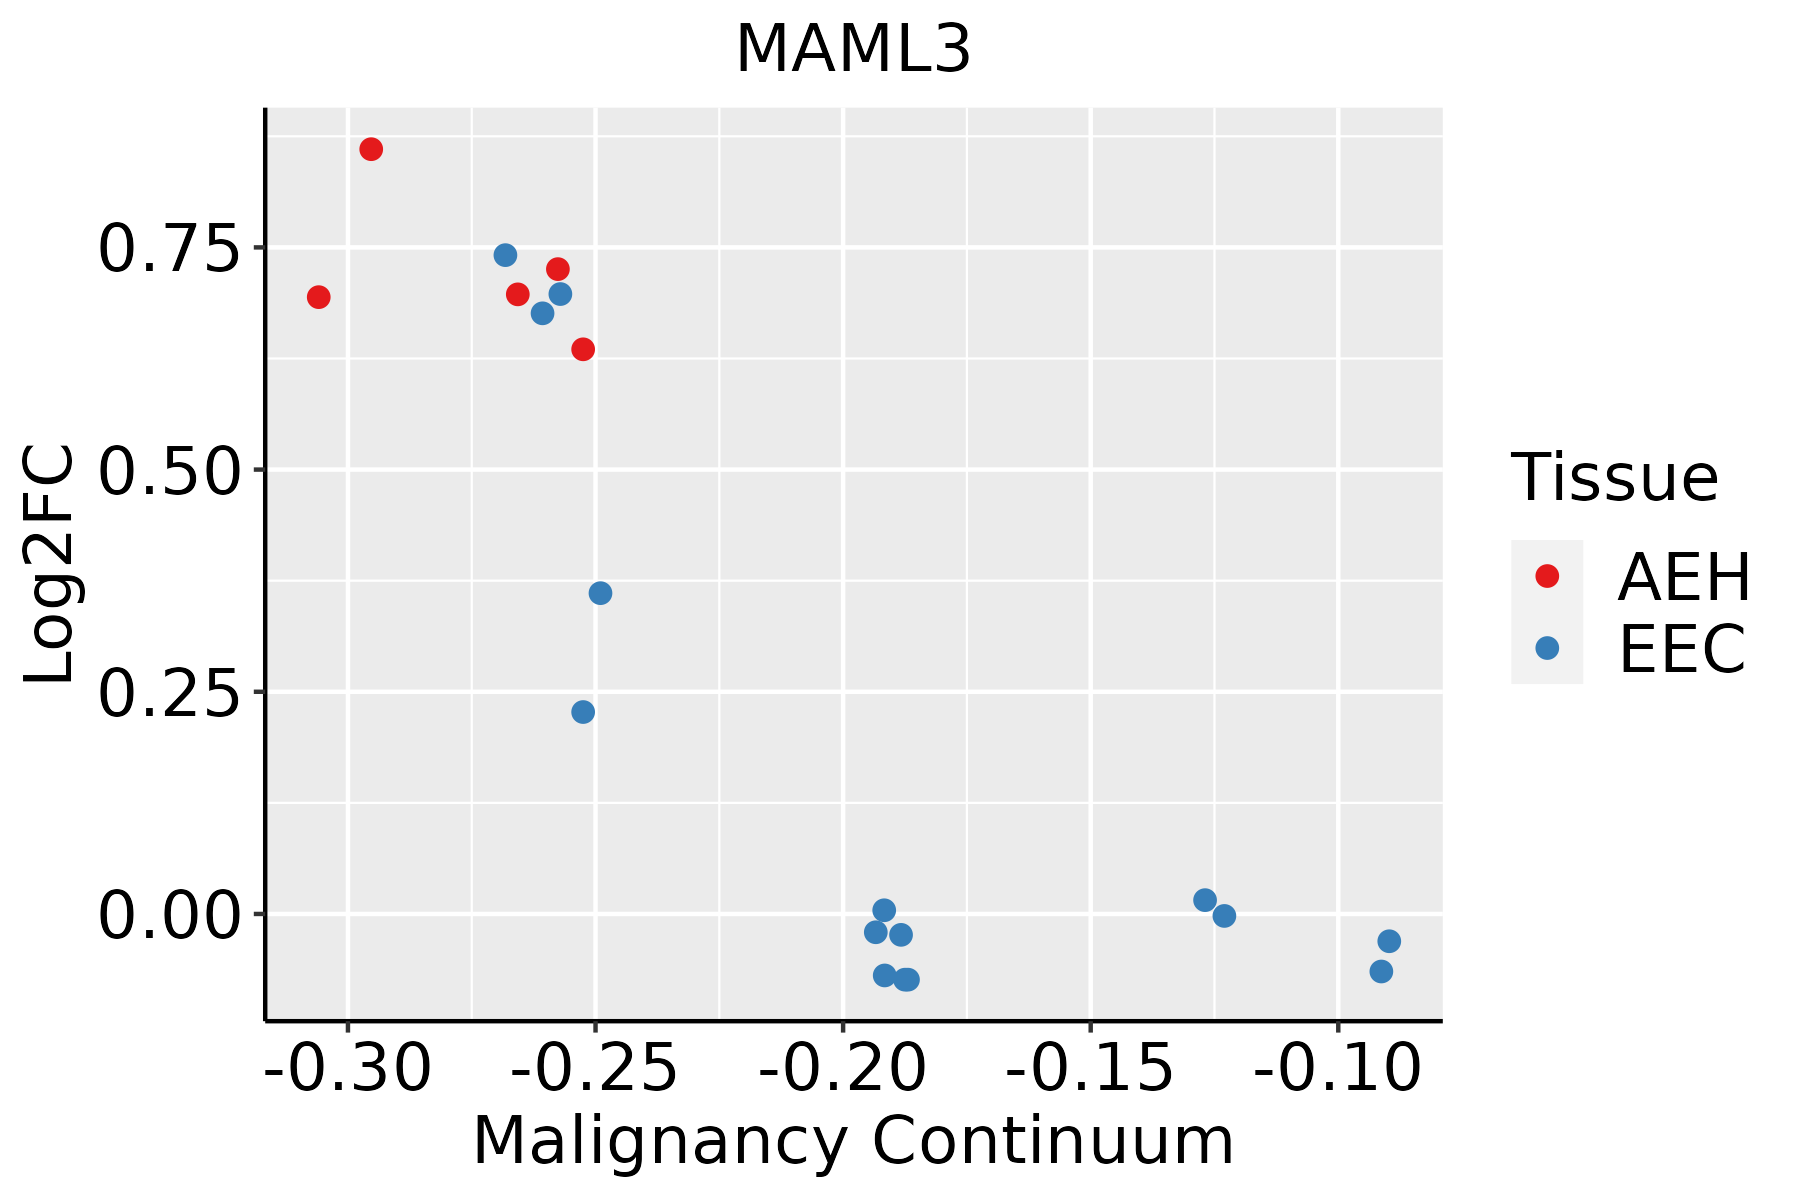 | AEH: Atypical endometrial hyperplasia |
| EEC: Endometrioid Cancer | ||
| GC |  | CAG: Chronic atrophic gastritis |
| CAG with IM: Chronic atrophic gastritis with intestinal metaplasia | ||
| CSG: Chronic superficial gastritis | ||
| GC: Gastric cancer | ||
| SIM: Severe intestinal metaplasia | ||
| WIM: Wild intestinal metaplasia | ||
| Liver |  | HCC: Hepatocellular carcinoma |
| NAFLD: Non-alcoholic fatty liver disease | ||
| Lung | 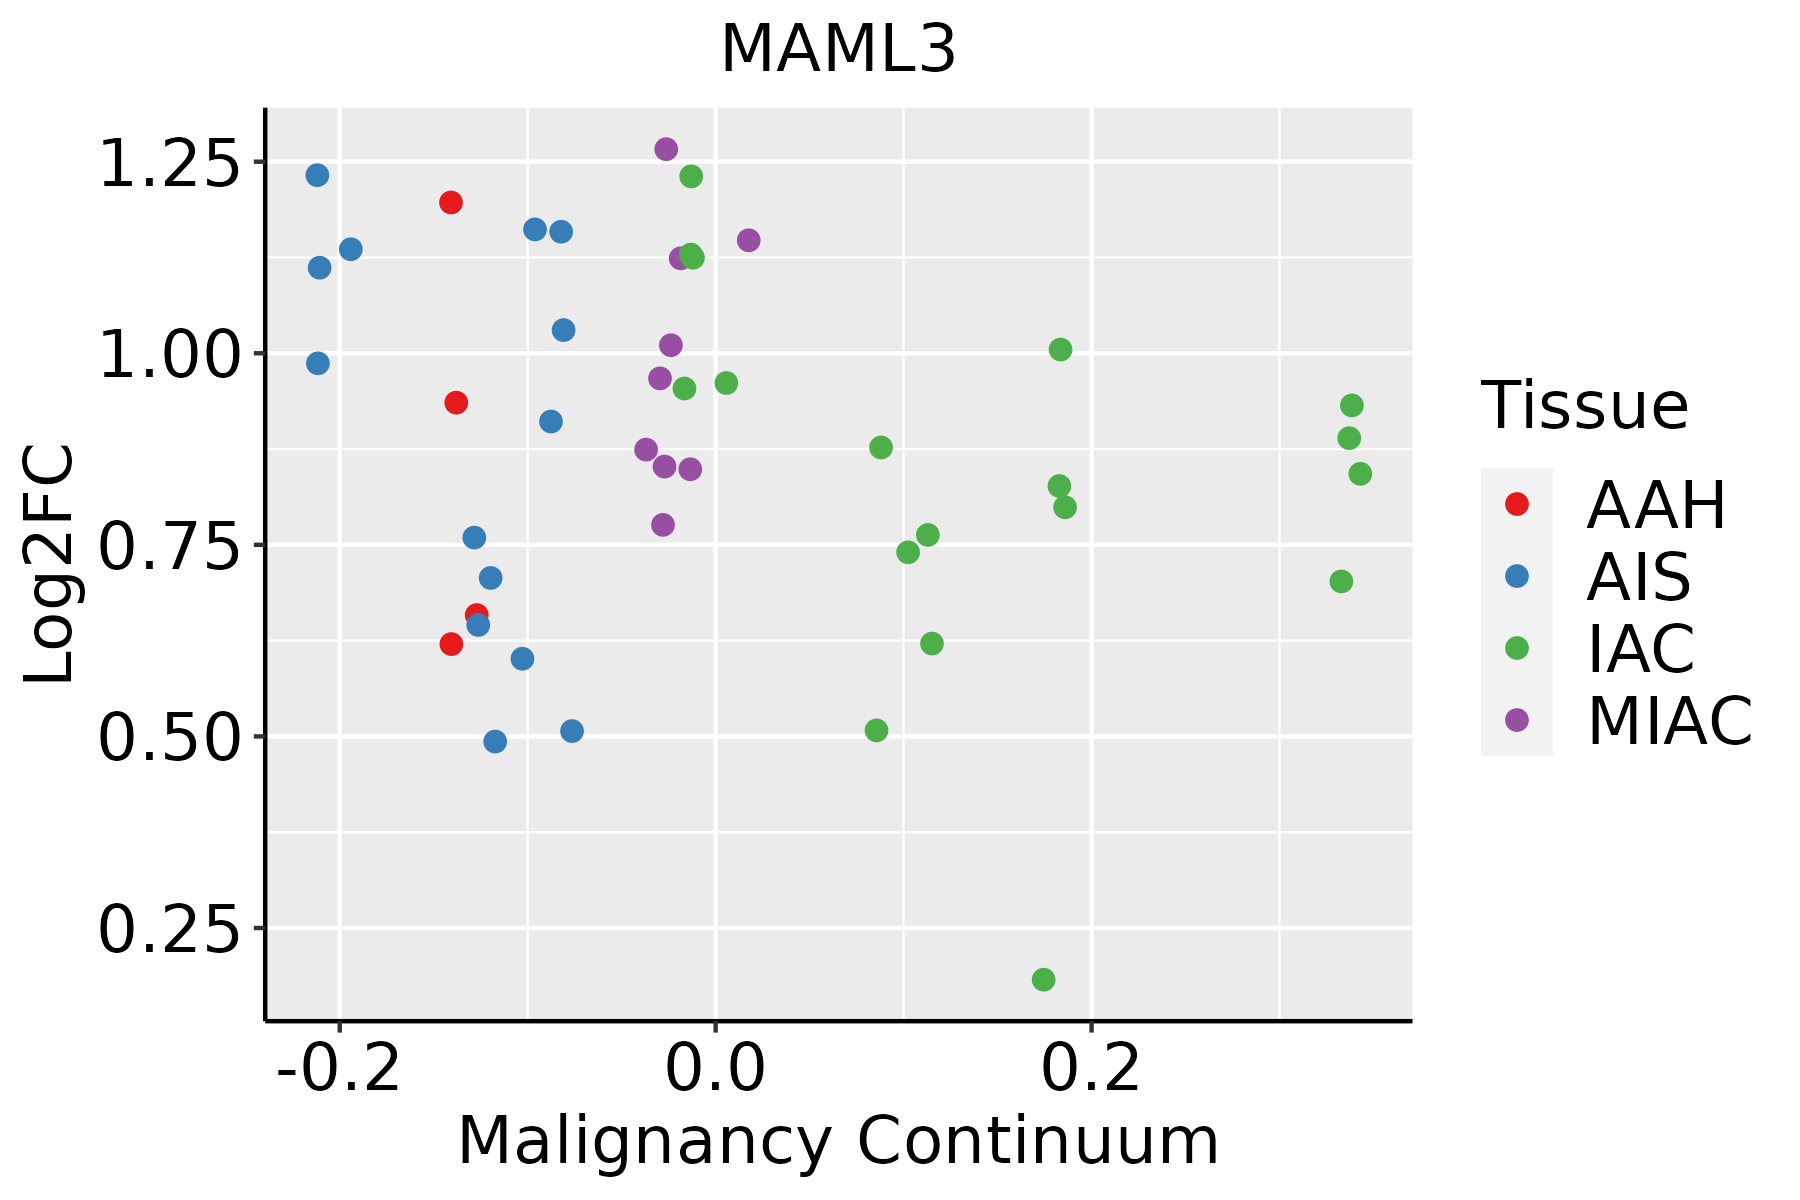 | AAH: Atypical adenomatous hyperplasia |
| AIS: Adenocarcinoma in situ | ||
| IAC: Invasive lung adenocarcinoma | ||
| MIA: Minimally invasive adenocarcinoma | ||
| Oral Cavity |  | EOLP: Erosive Oral lichen planus |
| LP: leukoplakia | ||
| NEOLP: Non-erosive oral lichen planus | ||
| OSCC: Oral squamous cell carcinoma | ||
| Prostate | 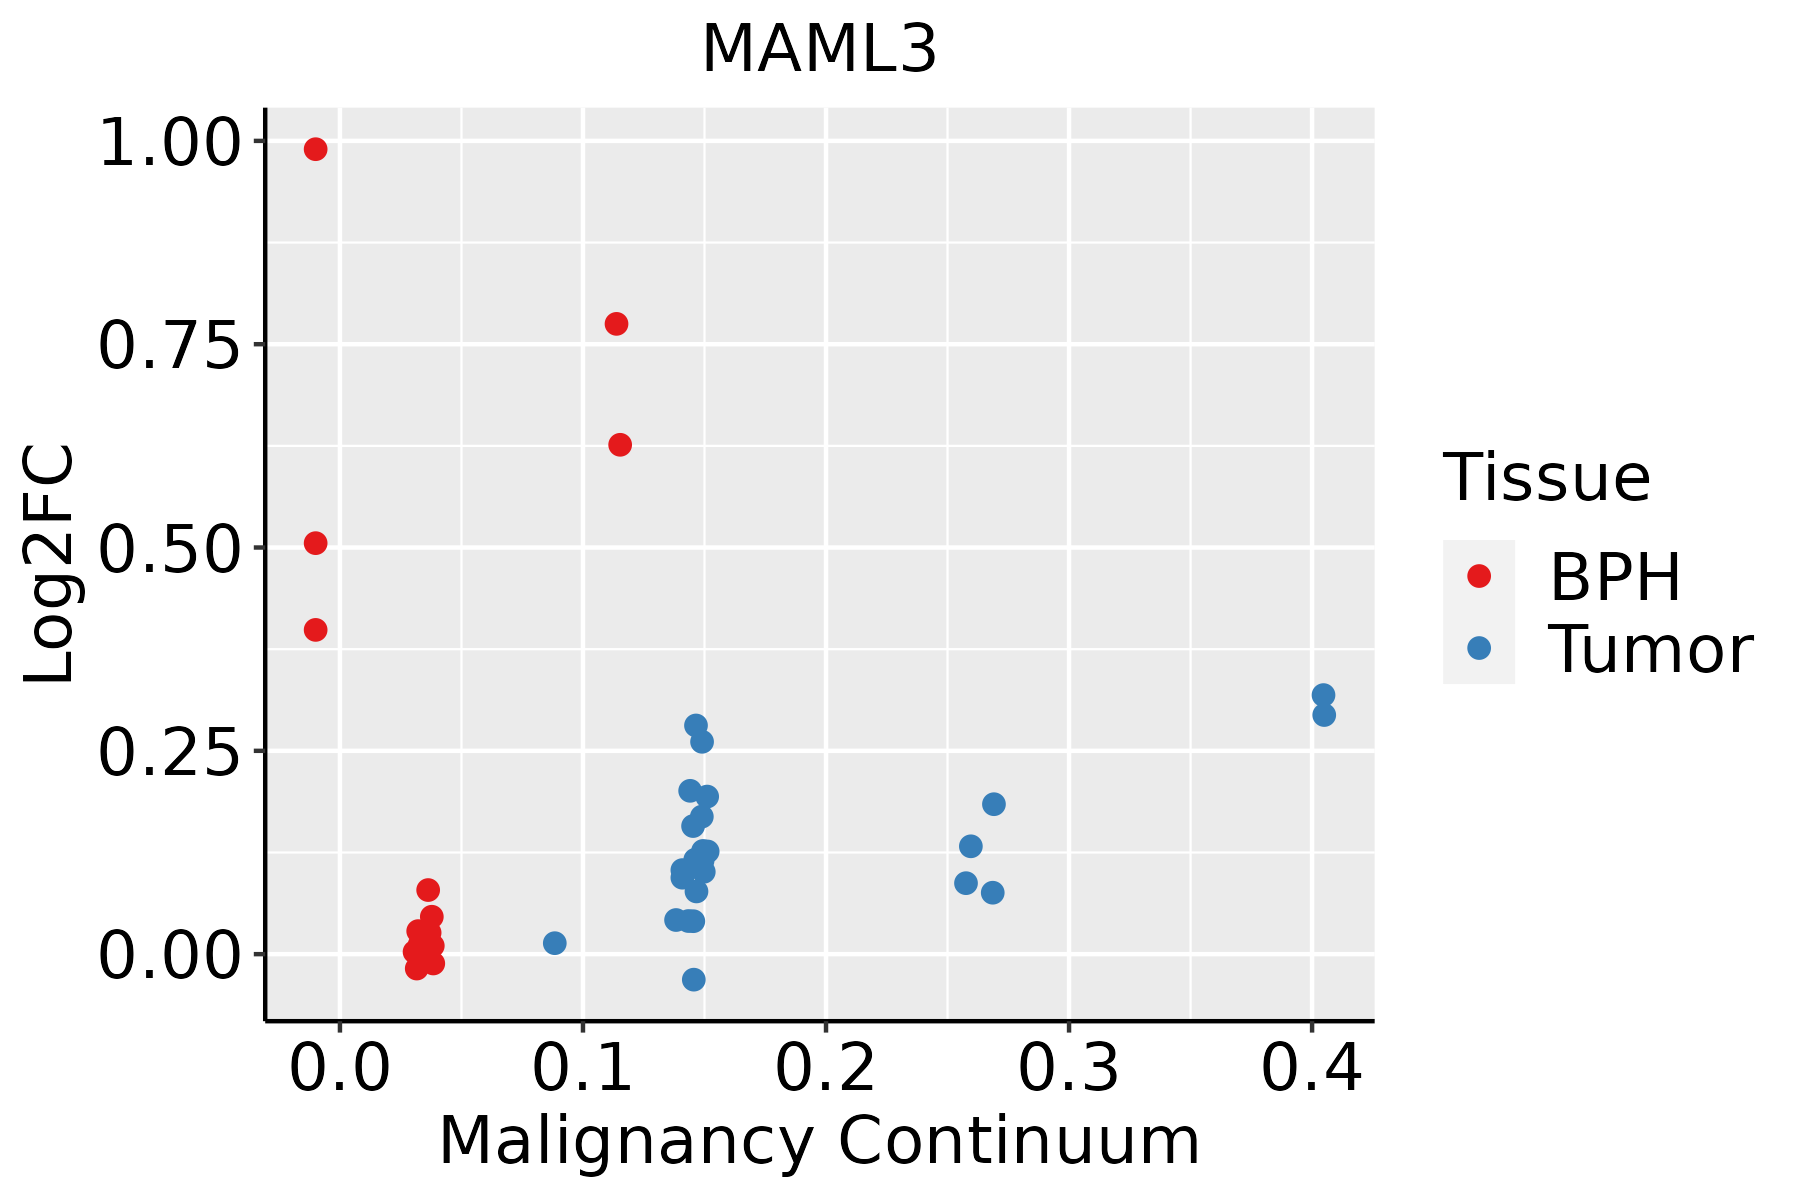 | BPH: Benign Prostatic Hyperplasia |
| Skin |  | AK: Actinic keratosis |
| cSCC: Cutaneous squamous cell carcinoma | ||
| SCCIS:squamous cell carcinoma in situ |
| ∗log2FC in expression of this searched gene in stem-like cells from each diseased tissue sample relative to stem-like cells in normal samples in each tissue plotted against the malignancy continuum. Samples are colored based on if they are from different disease stage. |
Top |
Malignant transformation related pathway analysis |
| Find out the enriched GO biological processes and KEGG pathways involved in transition from healthy to precancer to cancer |
| Tissue | Disease Stage | Enriched GO biological Processes |
| Colorectum | AD |  |
| Colorectum | SER |  |
| Colorectum | MSS |  |
| Colorectum | MSI-H |  |
| Colorectum | FAP |  |
| ∗Top 15 enriched GO BP terms are showed in the bar plot of each disease state in each tissue. Each row represents a significant GO biological process which is colored according to the -log10(p.adjust). |
| Page: 1 2 3 4 5 6 7 8 9 |
| GO ID | Tissue | Disease Stage | Description | Gene Ratio | Bg Ratio | pvalue | p.adjust | Count |
| GO:00072194 | Cervix | CC | Notch signaling pathway | 39/2311 | 172/18723 | 1.08e-04 | 1.38e-03 | 39 |
| GO:0007219 | Colorectum | AD | Notch signaling pathway | 50/3918 | 172/18723 | 6.92e-03 | 4.26e-02 | 50 |
| GO:00072191 | Colorectum | FAP | Notch signaling pathway | 38/2622 | 172/18723 | 2.56e-03 | 2.01e-02 | 38 |
| GO:00072192 | Colorectum | CRC | Notch signaling pathway | 36/2078 | 172/18723 | 1.26e-04 | 2.42e-03 | 36 |
| GO:00072193 | Lung | AIS | Notch signaling pathway | 29/1849 | 172/18723 | 2.93e-03 | 2.92e-02 | 29 |
| GO:000721921 | Oral cavity | NEOLP | Notch signaling pathway | 32/2005 | 172/18723 | 1.31e-03 | 9.48e-03 | 32 |
| GO:00072195 | Prostate | BPH | Notch signaling pathway | 41/3107 | 172/18723 | 8.95e-03 | 3.83e-02 | 41 |
| GO:000721912 | Prostate | Tumor | Notch signaling pathway | 44/3246 | 172/18723 | 4.02e-03 | 2.04e-02 | 44 |
| GO:00072198 | Skin | AK | Notch signaling pathway | 34/1910 | 172/18723 | 1.20e-04 | 1.50e-03 | 34 |
| GO:000721914 | Skin | SCCIS | Notch signaling pathway | 17/919 | 172/18723 | 4.79e-03 | 3.95e-02 | 17 |
| GO:000721922 | Skin | cSCC | Notch signaling pathway | 60/4864 | 172/18723 | 5.82e-03 | 2.87e-02 | 60 |
| Page: 1 |
| Pathway ID | Tissue | Disease Stage | Description | Gene Ratio | Bg Ratio | pvalue | p.adjust | qvalue | Count |
| hsa051657 | Cervix | CC | Human papillomavirus infection | 74/1267 | 331/8465 | 1.70e-04 | 1.02e-03 | 6.03e-04 | 74 |
| hsa04658 | Cervix | CC | Th1 and Th2 cell differentiation | 24/1267 | 92/8465 | 3.71e-03 | 1.34e-02 | 7.91e-03 | 24 |
| hsa04330 | Cervix | CC | Notch signaling pathway | 17/1267 | 62/8465 | 7.99e-03 | 2.56e-02 | 1.51e-02 | 17 |
| hsa0516512 | Cervix | CC | Human papillomavirus infection | 74/1267 | 331/8465 | 1.70e-04 | 1.02e-03 | 6.03e-04 | 74 |
| hsa046581 | Cervix | CC | Th1 and Th2 cell differentiation | 24/1267 | 92/8465 | 3.71e-03 | 1.34e-02 | 7.91e-03 | 24 |
| hsa043301 | Cervix | CC | Notch signaling pathway | 17/1267 | 62/8465 | 7.99e-03 | 2.56e-02 | 1.51e-02 | 17 |
| hsa05165 | Liver | Cirrhotic | Human papillomavirus infection | 124/2530 | 331/8465 | 1.55e-03 | 7.83e-03 | 4.83e-03 | 124 |
| hsa051651 | Liver | Cirrhotic | Human papillomavirus infection | 124/2530 | 331/8465 | 1.55e-03 | 7.83e-03 | 4.83e-03 | 124 |
| hsa051652 | Liver | HCC | Human papillomavirus infection | 188/4020 | 331/8465 | 3.34e-04 | 1.49e-03 | 8.29e-04 | 188 |
| hsa051653 | Liver | HCC | Human papillomavirus infection | 188/4020 | 331/8465 | 3.34e-04 | 1.49e-03 | 8.29e-04 | 188 |
| hsa051656 | Lung | IAC | Human papillomavirus infection | 71/1053 | 331/8465 | 1.88e-06 | 7.63e-05 | 5.06e-05 | 71 |
| hsa0516511 | Lung | IAC | Human papillomavirus infection | 71/1053 | 331/8465 | 1.88e-06 | 7.63e-05 | 5.06e-05 | 71 |
| hsa0516521 | Lung | AIS | Human papillomavirus infection | 64/961 | 331/8465 | 1.03e-05 | 3.04e-04 | 1.95e-04 | 64 |
| hsa0516531 | Lung | AIS | Human papillomavirus infection | 64/961 | 331/8465 | 1.03e-05 | 3.04e-04 | 1.95e-04 | 64 |
| hsa051654 | Lung | MIAC | Human papillomavirus infection | 32/507 | 331/8465 | 4.78e-03 | 3.49e-02 | 2.52e-02 | 32 |
| hsa051655 | Lung | MIAC | Human papillomavirus infection | 32/507 | 331/8465 | 4.78e-03 | 3.49e-02 | 2.52e-02 | 32 |
| hsa0516541 | Oral cavity | EOLP | Human papillomavirus infection | 79/1218 | 331/8465 | 1.96e-06 | 1.63e-05 | 9.60e-06 | 79 |
| hsa0465821 | Oral cavity | EOLP | Th1 and Th2 cell differentiation | 31/1218 | 92/8465 | 2.27e-06 | 1.79e-05 | 1.05e-05 | 31 |
| hsa0516551 | Oral cavity | EOLP | Human papillomavirus infection | 79/1218 | 331/8465 | 1.96e-06 | 1.63e-05 | 9.60e-06 | 79 |
| hsa0465831 | Oral cavity | EOLP | Th1 and Th2 cell differentiation | 31/1218 | 92/8465 | 2.27e-06 | 1.79e-05 | 1.05e-05 | 31 |
| Page: 1 2 |
Top |
Cell-cell communication analysis |
| Identification of potential cell-cell interactions between two cell types and their ligand-receptor pairs for different disease states |
| Ligand | Receptor | LRpair | Pathway | Tissue | Disease Stage |
| Page: 1 |
Top |
Single-cell gene regulatory network inference analysis |
| Find out the significant the regulons (TFs) and the target genes of each regulon across cell types for different disease states |
| TF | Cell Type | Tissue | Disease Stage | Target Gene | RSS | Regulon Activity |
| ∗The dot plots of a searched regulon are shown for all cell subpopulations in each disease state of each tissue based on the regulon specific score inferred using pySCENIC and by calculating the average expression. |
| Page: 1 |
Top |
Somatic mutation of malignant transformation related genes |
| Annotation of somatic variants for genes involved in malignant transformation |
| Hugo Symbol | Variant Class | Variant Classification | dbSNP RS | HGVSc | HGVSp | HGVSp Short | SWISSPROT | BIOTYPE | SIFT | PolyPhen | Tumor Sample Barcode | Tissue | Histology | Sex | Age | Stage | Therapy Types | Drugs | Outcome |
| MAML3 | SNV | Missense_Mutation | novel | c.3218N>C | p.Gly1073Ala | p.G1073A | Q96JK9 | protein_coding | tolerated(0.21) | benign(0.108) | TCGA-A8-A08O-01 | Breast | breast invasive carcinoma | Female | <65 | III/IV | Chemotherapy | docetaxel | PD |
| MAML3 | SNV | Missense_Mutation | c.2953N>A | p.Gly985Ser | p.G985S | Q96JK9 | protein_coding | tolerated(0.43) | benign(0.02) | TCGA-AC-A23H-01 | Breast | breast invasive carcinoma | Female | >=65 | I/II | Unknown | Unknown | PD | |
| MAML3 | SNV | Missense_Mutation | rs547610978 | c.1325C>T | p.Pro442Leu | p.P442L | Q96JK9 | protein_coding | tolerated(0.05) | possibly_damaging(0.668) | TCGA-BH-A0E2-01 | Breast | breast invasive carcinoma | Female | <65 | III/IV | Chemotherapy | doxorubicin | SD |
| MAML3 | SNV | Missense_Mutation | c.1360N>T | p.Pro454Ser | p.P454S | Q96JK9 | protein_coding | tolerated(0.17) | benign(0.005) | TCGA-BH-A0GY-01 | Breast | breast invasive carcinoma | Female | >=65 | I/II | Chemotherapy | cyotxan | SD | |
| MAML3 | SNV | Missense_Mutation | novel | c.2060N>T | p.Ala687Val | p.A687V | Q96JK9 | protein_coding | tolerated(0.39) | benign(0.086) | TCGA-BH-A0HF-01 | Breast | breast invasive carcinoma | Female | >=65 | I/II | Hormone Therapy | arimidex | SD |
| MAML3 | SNV | Missense_Mutation | c.3256C>T | p.Arg1086Trp | p.R1086W | Q96JK9 | protein_coding | deleterious(0) | probably_damaging(0.993) | TCGA-BH-A18G-01 | Breast | breast invasive carcinoma | Female | >=65 | I/II | Unknown | Unknown | SD | |
| MAML3 | deletion | Frame_Shift_Del | novel | c.2357_2363delNNNNNNN | p.Arg786ProfsTer24 | p.R786Pfs*24 | Q96JK9 | protein_coding | TCGA-A2-A1FW-01 | Breast | breast invasive carcinoma | Female | <65 | III/IV | Chemotherapy | cytoxan | SD | ||
| MAML3 | deletion | Frame_Shift_Del | novel | c.2725delN | p.Val909LeufsTer4 | p.V909Lfs*4 | Q96JK9 | protein_coding | TCGA-LL-A7T0-01 | Breast | breast invasive carcinoma | Female | >=65 | I/II | Unknown | Unknown | SD | ||
| MAML3 | SNV | Missense_Mutation | rs751266761 | c.3298G>A | p.Gly1100Arg | p.G1100R | Q96JK9 | protein_coding | deleterious(0.04) | possibly_damaging(0.539) | TCGA-2W-A8YY-01 | Cervix | cervical & endocervical cancer | Female | <65 | I/II | Chemotherapy | cisplatin | CR |
| MAML3 | SNV | Missense_Mutation | novel | c.787N>C | p.Glu263Gln | p.E263Q | Q96JK9 | protein_coding | tolerated(0.07) | possibly_damaging(0.796) | TCGA-C5-A1MH-01 | Cervix | cervical & endocervical cancer | Female | >=65 | III/IV | Chemotherapy | cisplatin | PD |
| Page: 1 2 3 4 5 6 7 8 9 10 11 |
Top |
Related drugs of malignant transformation related genes |
| Identification of chemicals and drugs interact with genes involved in malignant transfromation |
| (DGIdb 4.0) |
| Entrez ID | Symbol | Category | Interaction Types | Drug Claim Name | Drug Name | PMIDs |
| Page: 1 |

Copyright 2023-Present -The University of Texas Health Science Center at Houston |