
|
|||||
|
 | |
| |
| |
| |
| |
| |
|
Gene: MAML2 |
Gene summary for MAML2 |
| Gene information | Species | Human | Gene symbol | MAML2 | Gene ID | 84441 |
| Gene name | mastermind like transcriptional coactivator 2 | |
| Gene Alias | MAM-3 | |
| Cytomap | 11q21 | |
| Gene Type | protein-coding | GO ID | GO:0006139 | UniProtAcc | Q8IZL2 |
Top |
Malignant transformation analysis |
| Identification of the aberrant gene expression in precancerous and cancerous lesions by comparing the gene expression of stem-like cells in diseased tissues with normal stem cells |
| Entrez ID | Symbol | Replicates | Species | Organ | Tissue | Adj P-value | Log2FC | Malignancy |
| 84441 | MAML2 | CCI_1 | Human | Cervix | CC | 2.67e-06 | 7.96e-01 | 0.528 |
| 84441 | MAML2 | CCI_3 | Human | Cervix | CC | 7.87e-05 | 7.51e-01 | 0.516 |
| 84441 | MAML2 | HTA11_2951_2000001011 | Human | Colorectum | AD | 7.71e-03 | -6.43e-01 | 0.0216 |
| 84441 | MAML2 | HTA11_1938_2000001011 | Human | Colorectum | AD | 4.60e-07 | 5.88e-01 | -0.0811 |
| 84441 | MAML2 | HTA11_78_2000001011 | Human | Colorectum | AD | 1.70e-09 | 5.53e-01 | -0.1088 |
| 84441 | MAML2 | HTA11_347_2000001011 | Human | Colorectum | AD | 1.87e-35 | 1.28e+00 | -0.1954 |
| 84441 | MAML2 | HTA11_411_2000001011 | Human | Colorectum | SER | 2.83e-08 | 7.29e-01 | -0.2602 |
| 84441 | MAML2 | HTA11_83_2000001011 | Human | Colorectum | SER | 2.67e-10 | 6.92e-01 | -0.1526 |
| 84441 | MAML2 | HTA11_1391_2000001011 | Human | Colorectum | AD | 2.42e-07 | 7.17e-01 | -0.059 |
| 84441 | MAML2 | HTA11_9408_2000001011 | Human | Colorectum | AD | 1.32e-02 | -4.74e-01 | 0.0451 |
| 84441 | MAML2 | HTA11_7663_2000001011 | Human | Colorectum | SER | 2.34e-12 | 9.06e-01 | 0.0131 |
| 84441 | MAML2 | HTA11_10623_2000001011 | Human | Colorectum | AD | 9.01e-04 | 5.91e-01 | -0.0177 |
| 84441 | MAML2 | HTA11_10711_2000001011 | Human | Colorectum | AD | 3.10e-02 | 3.37e-01 | 0.0338 |
| 84441 | MAML2 | HTA11_6818_2000001021 | Human | Colorectum | AD | 7.81e-12 | 8.48e-01 | 0.0588 |
| 84441 | MAML2 | HTA11_99999970781_79442 | Human | Colorectum | MSS | 2.12e-05 | 5.68e-01 | 0.294 |
| 84441 | MAML2 | HTA11_99999965062_69753 | Human | Colorectum | MSI-H | 1.21e-02 | 6.50e-01 | 0.3487 |
| 84441 | MAML2 | HTA11_99999965104_69814 | Human | Colorectum | MSS | 3.09e-04 | 5.95e-01 | 0.281 |
| 84441 | MAML2 | HTA11_99999971662_82457 | Human | Colorectum | MSS | 2.11e-04 | 6.31e-01 | 0.3859 |
| 84441 | MAML2 | HTA11_99999974143_84620 | Human | Colorectum | MSS | 8.25e-28 | -7.81e-01 | 0.3005 |
| 84441 | MAML2 | A015-C-203 | Human | Colorectum | FAP | 2.67e-35 | -7.02e-01 | -0.1294 |
| Page: 1 2 3 4 5 6 7 8 9 10 11 |
| Tissue | Expression Dynamics | Abbreviation |
| Cervix | 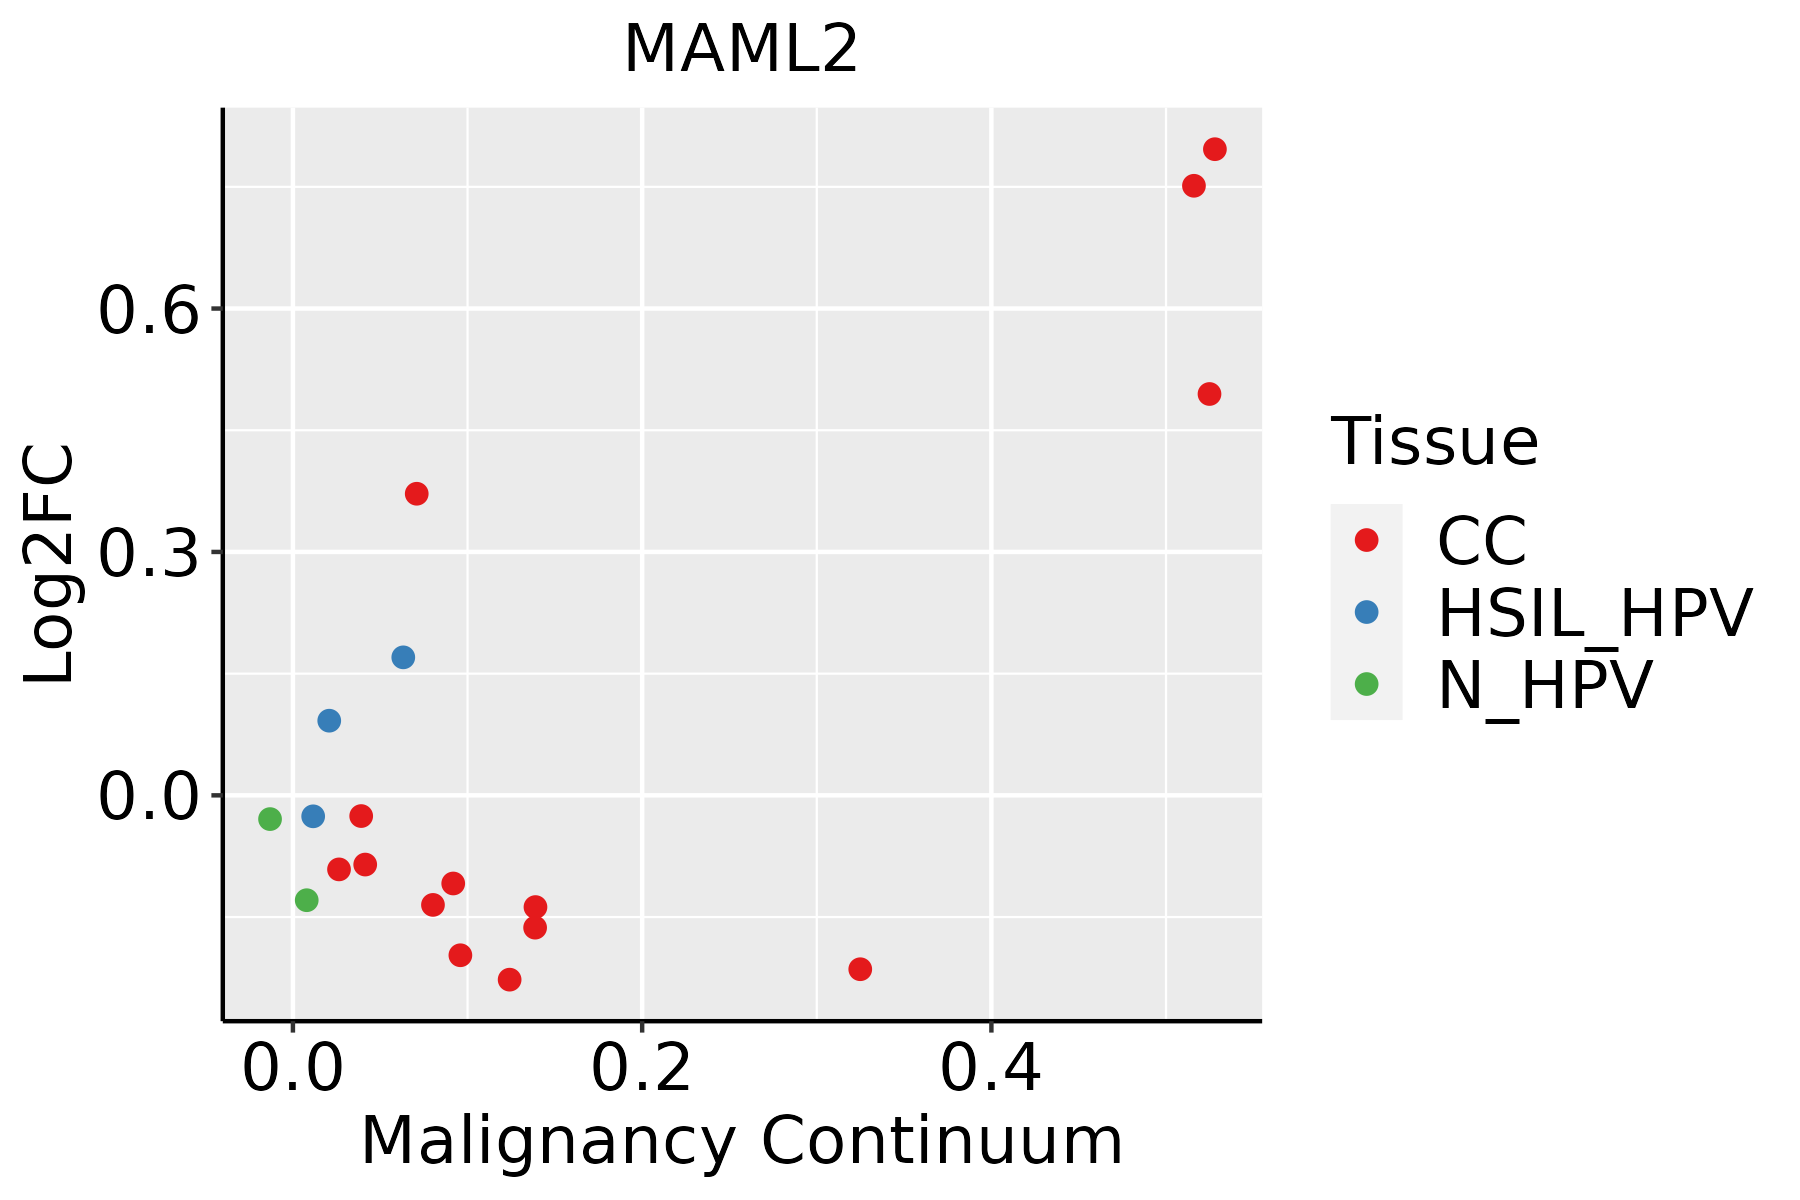 | CC: Cervix cancer |
| HSIL_HPV: HPV-infected high-grade squamous intraepithelial lesions | ||
| N_HPV: HPV-infected normal cervix | ||
| Colorectum (GSE201348) |  | FAP: Familial adenomatous polyposis |
| CRC: Colorectal cancer | ||
| Colorectum (HTA11) |  | AD: Adenomas |
| SER: Sessile serrated lesions | ||
| MSI-H: Microsatellite-high colorectal cancer | ||
| MSS: Microsatellite stable colorectal cancer | ||
| Endometrium | 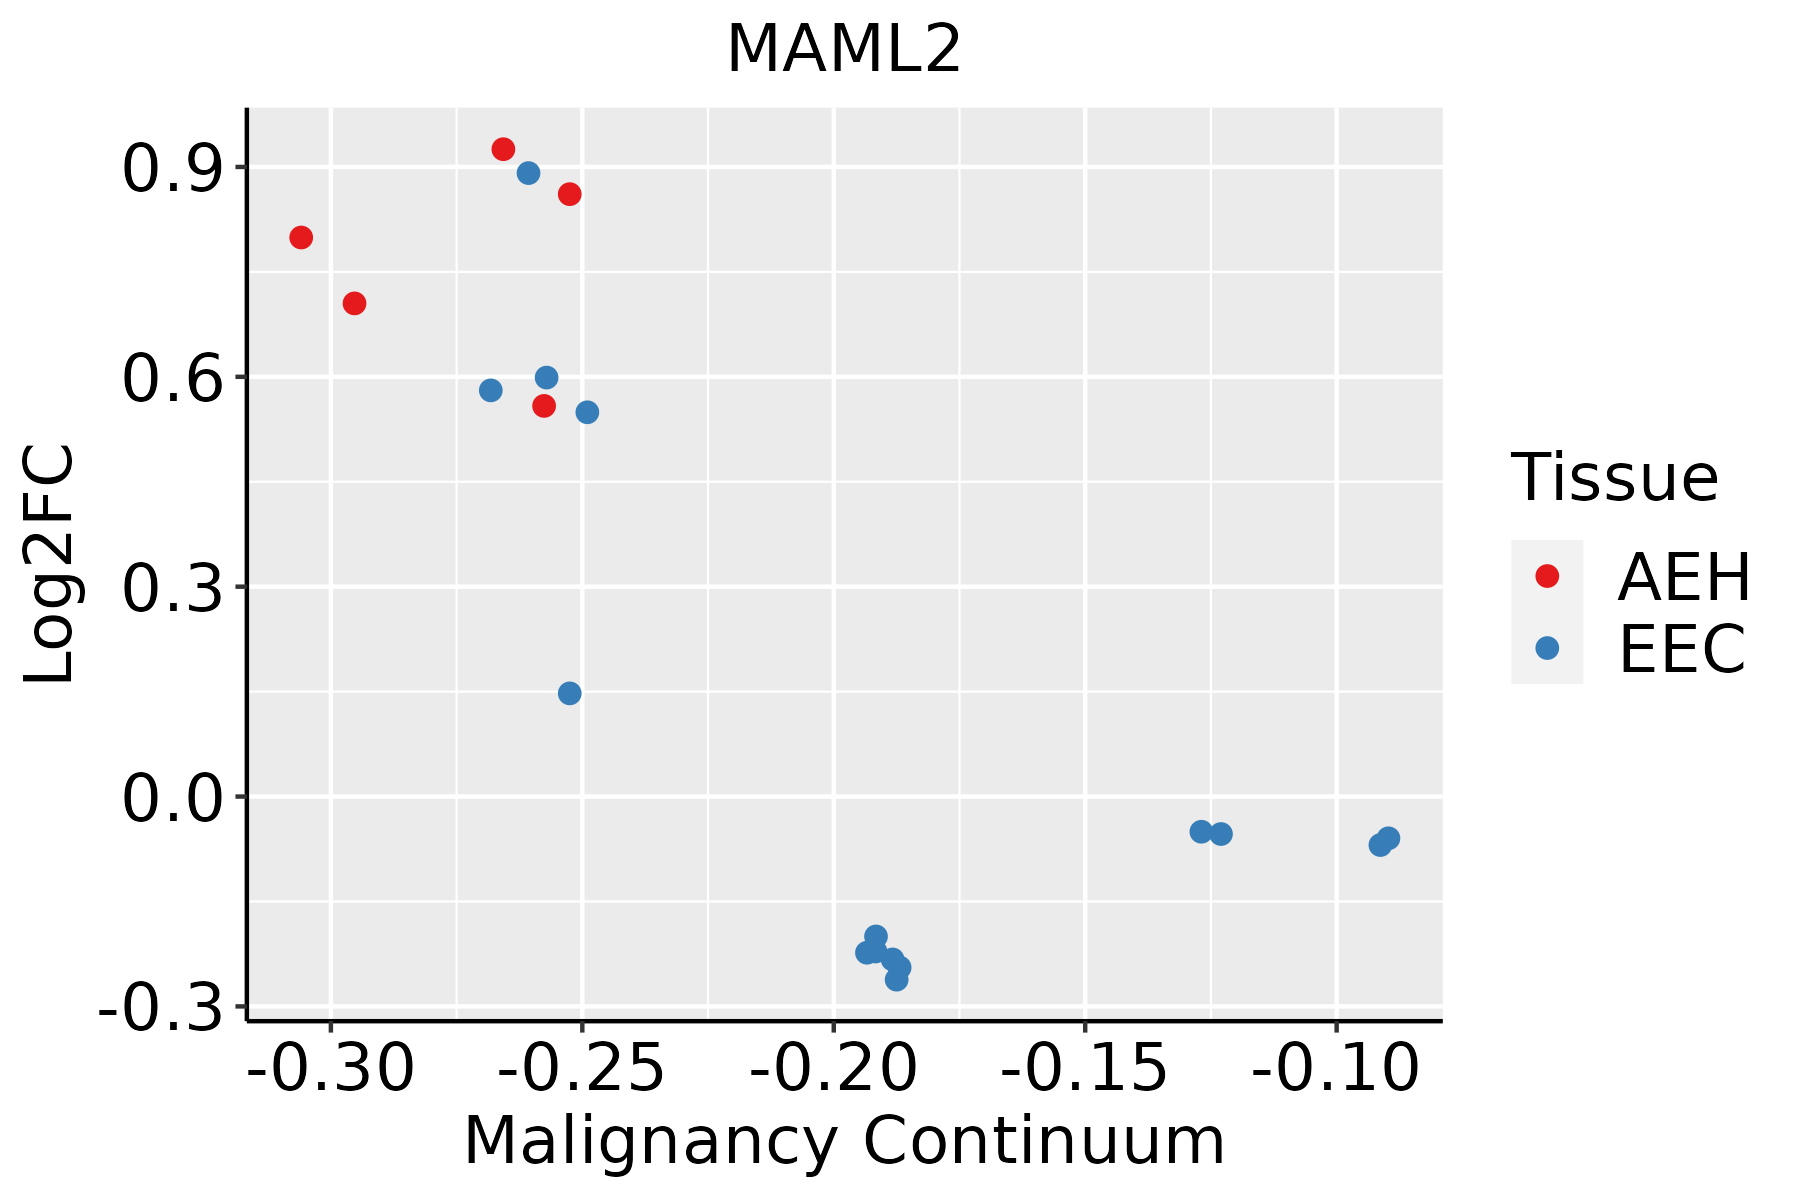 | AEH: Atypical endometrial hyperplasia |
| EEC: Endometrioid Cancer | ||
| Esophagus |  | ESCC: Esophageal squamous cell carcinoma |
| HGIN: High-grade intraepithelial neoplasias | ||
| LGIN: Low-grade intraepithelial neoplasias | ||
| Lung |  | AAH: Atypical adenomatous hyperplasia |
| AIS: Adenocarcinoma in situ | ||
| IAC: Invasive lung adenocarcinoma | ||
| MIA: Minimally invasive adenocarcinoma | ||
| Oral Cavity | 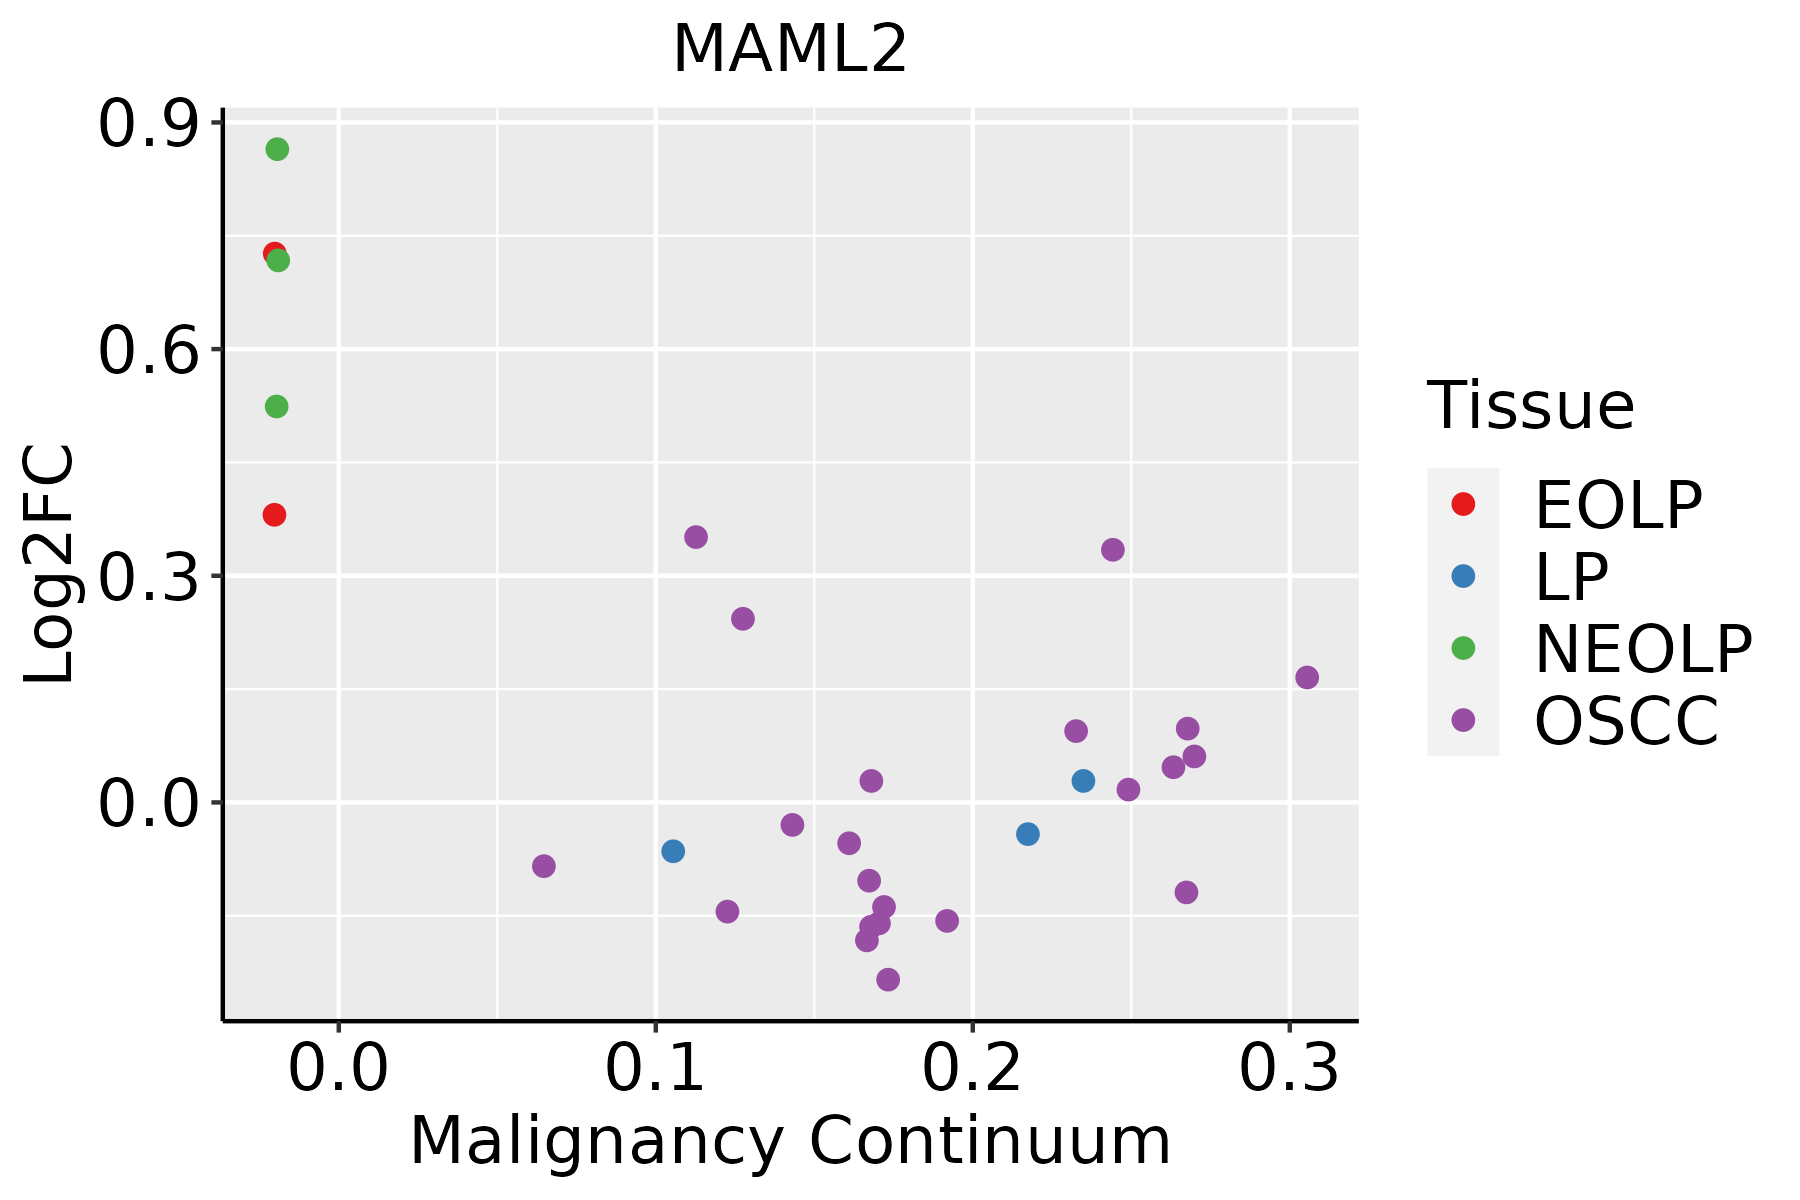 | EOLP: Erosive Oral lichen planus |
| LP: leukoplakia | ||
| NEOLP: Non-erosive oral lichen planus | ||
| OSCC: Oral squamous cell carcinoma | ||
| Prostate | 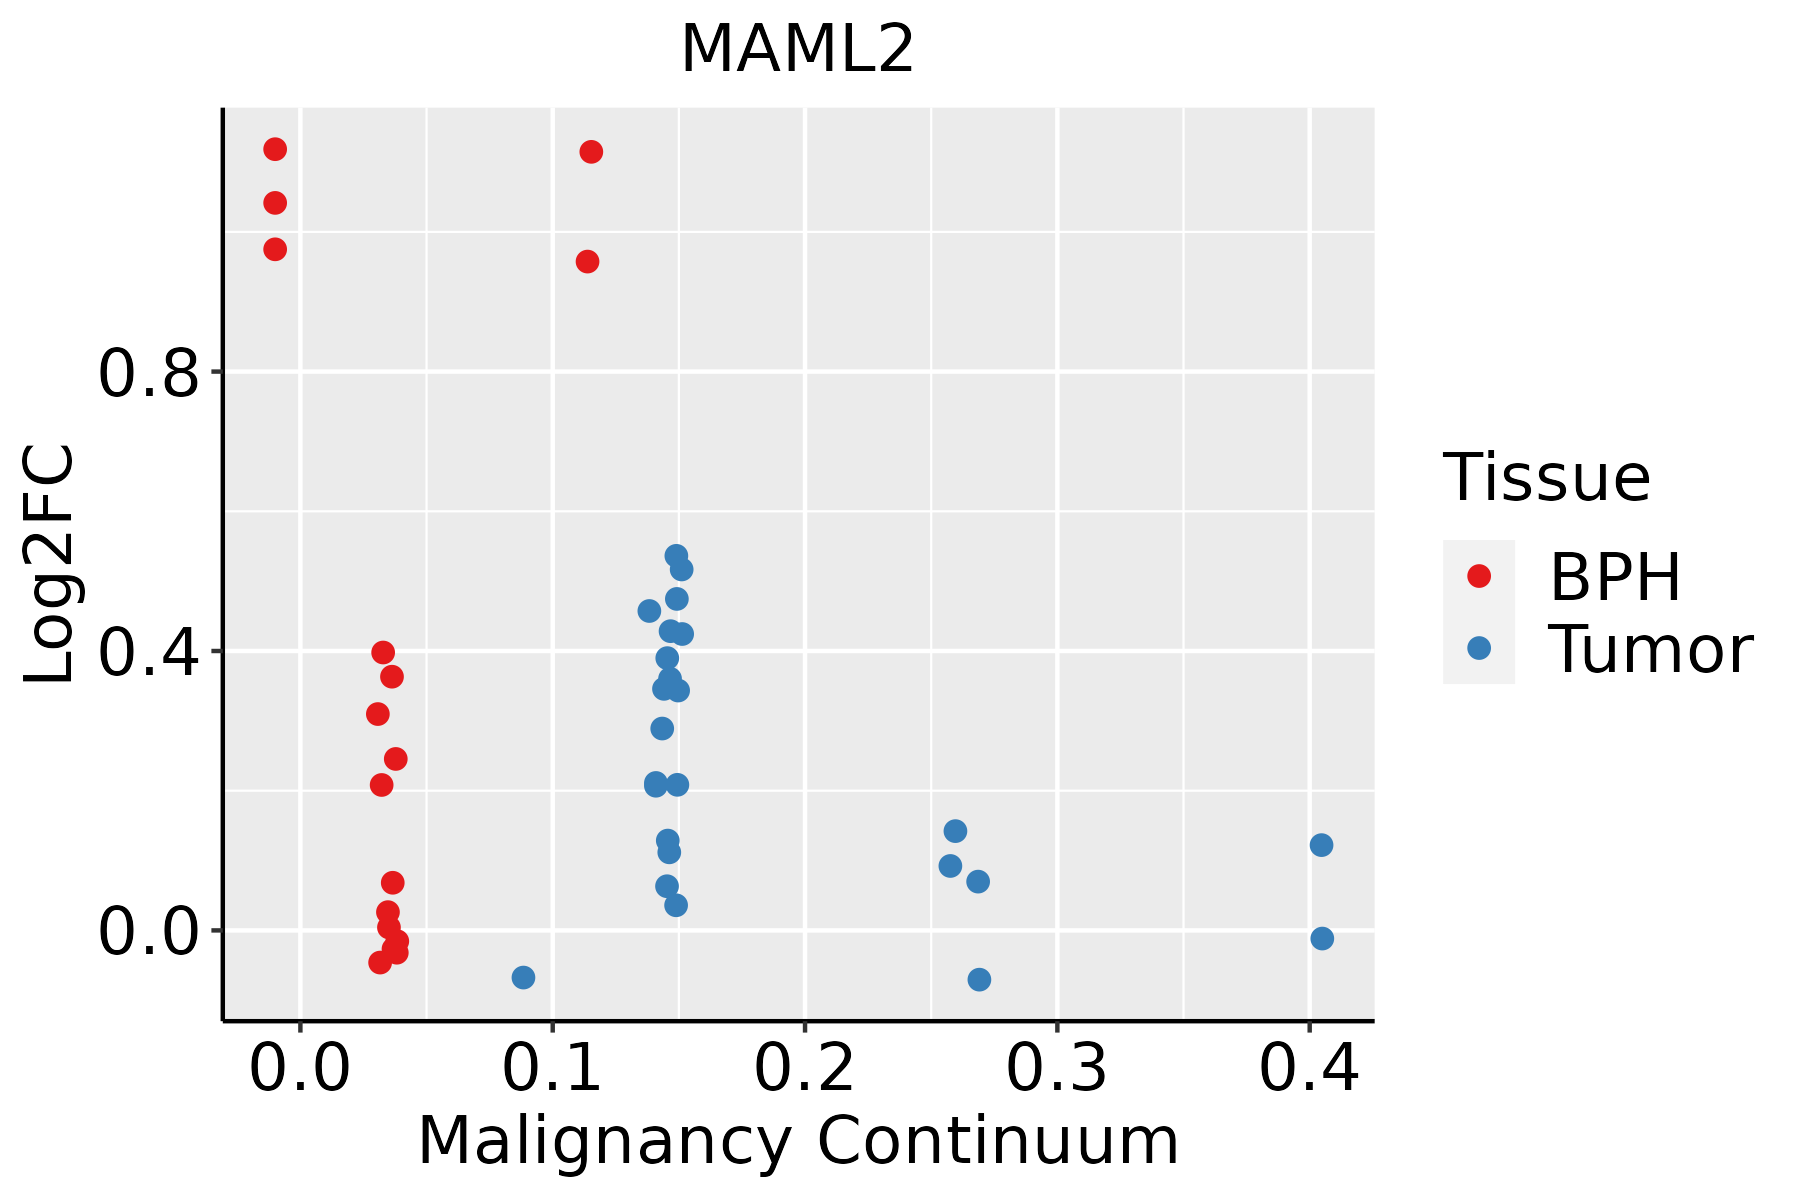 | BPH: Benign Prostatic Hyperplasia |
| Skin | 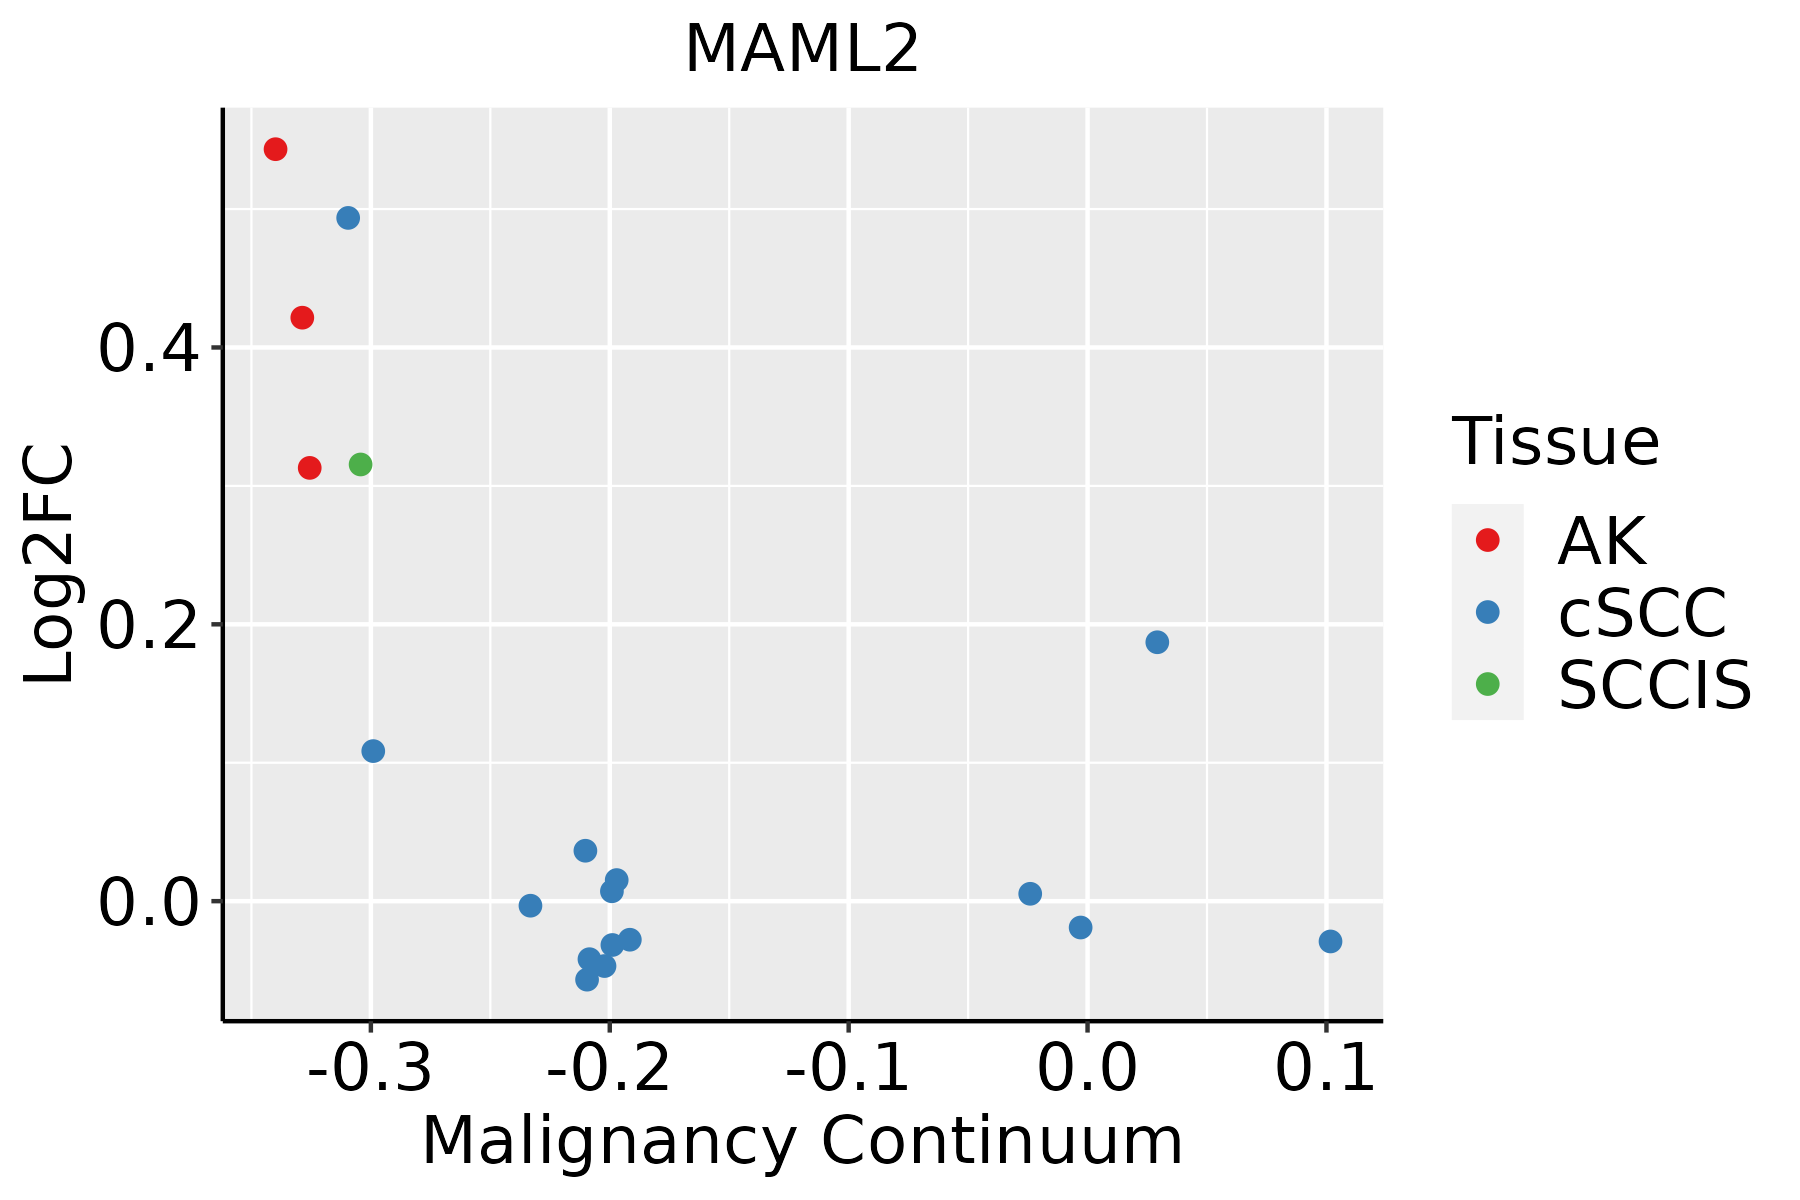 | AK: Actinic keratosis |
| cSCC: Cutaneous squamous cell carcinoma | ||
| SCCIS:squamous cell carcinoma in situ | ||
| Thyroid | 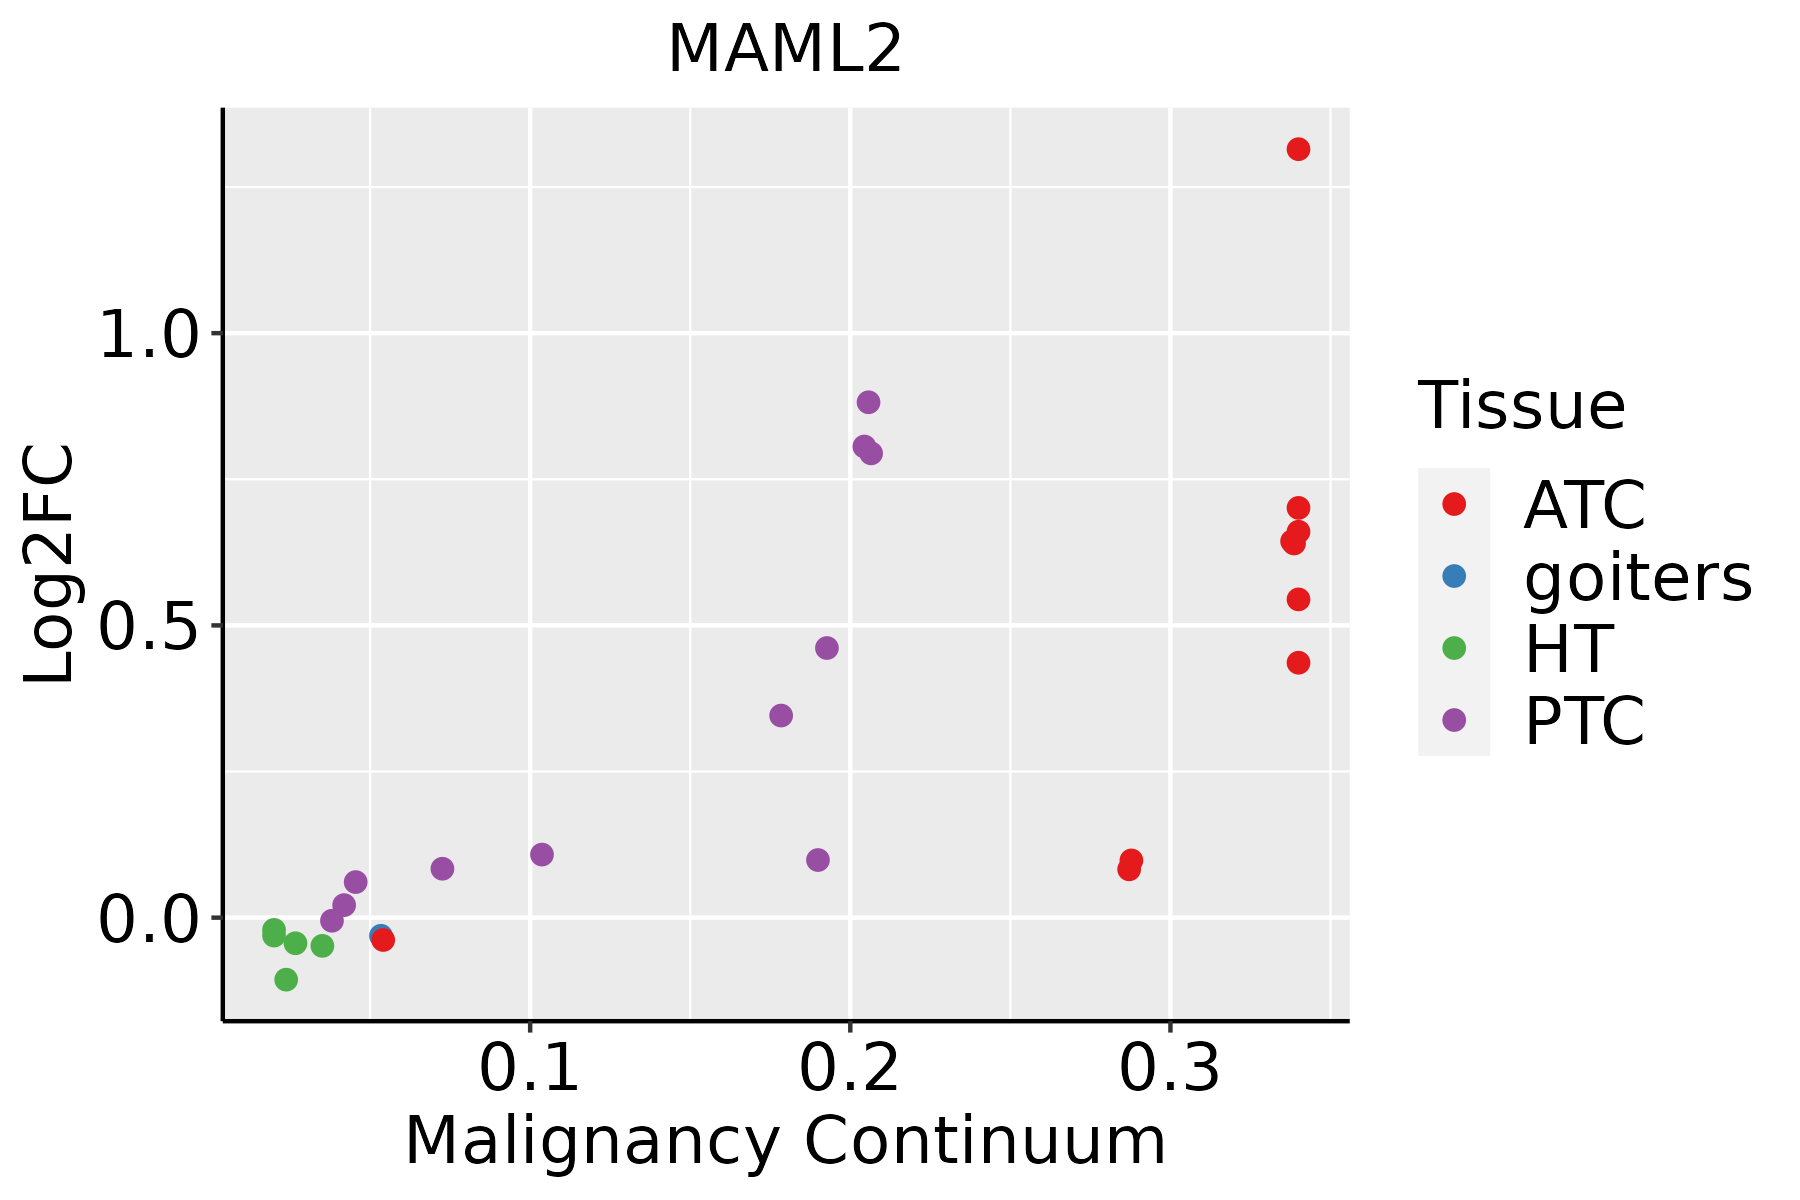 | ATC: Anaplastic thyroid cancer |
| HT: Hashimoto's thyroiditis | ||
| PTC: Papillary thyroid cancer |
| ∗log2FC in expression of this searched gene in stem-like cells from each diseased tissue sample relative to stem-like cells in normal samples in each tissue plotted against the malignancy continuum. Samples are colored based on if they are from different disease stage. |
Top |
Malignant transformation related pathway analysis |
| Find out the enriched GO biological processes and KEGG pathways involved in transition from healthy to precancer to cancer |
| Tissue | Disease Stage | Enriched GO biological Processes |
| Colorectum | AD |  |
| Colorectum | SER |  |
| Colorectum | MSS |  |
| Colorectum | MSI-H |  |
| Colorectum | FAP |  |
| ∗Top 15 enriched GO BP terms are showed in the bar plot of each disease state in each tissue. Each row represents a significant GO biological process which is colored according to the -log10(p.adjust). |
| Page: 1 2 3 4 5 6 7 8 9 |
| GO ID | Tissue | Disease Stage | Description | Gene Ratio | Bg Ratio | pvalue | p.adjust | Count |
| GO:00072194 | Cervix | CC | Notch signaling pathway | 39/2311 | 172/18723 | 1.08e-04 | 1.38e-03 | 39 |
| GO:0007219 | Colorectum | AD | Notch signaling pathway | 50/3918 | 172/18723 | 6.92e-03 | 4.26e-02 | 50 |
| GO:00072191 | Colorectum | FAP | Notch signaling pathway | 38/2622 | 172/18723 | 2.56e-03 | 2.01e-02 | 38 |
| GO:00072192 | Colorectum | CRC | Notch signaling pathway | 36/2078 | 172/18723 | 1.26e-04 | 2.42e-03 | 36 |
| GO:00072197 | Esophagus | ESCC | Notch signaling pathway | 106/8552 | 172/18723 | 1.74e-05 | 1.55e-04 | 106 |
| GO:00072193 | Lung | AIS | Notch signaling pathway | 29/1849 | 172/18723 | 2.93e-03 | 2.92e-02 | 29 |
| GO:00072196 | Oral cavity | OSCC | Notch signaling pathway | 92/7305 | 172/18723 | 7.84e-05 | 6.08e-04 | 92 |
| GO:000721921 | Oral cavity | NEOLP | Notch signaling pathway | 32/2005 | 172/18723 | 1.31e-03 | 9.48e-03 | 32 |
| GO:00072195 | Prostate | BPH | Notch signaling pathway | 41/3107 | 172/18723 | 8.95e-03 | 3.83e-02 | 41 |
| GO:000721912 | Prostate | Tumor | Notch signaling pathway | 44/3246 | 172/18723 | 4.02e-03 | 2.04e-02 | 44 |
| GO:00072198 | Skin | AK | Notch signaling pathway | 34/1910 | 172/18723 | 1.20e-04 | 1.50e-03 | 34 |
| GO:000721914 | Skin | SCCIS | Notch signaling pathway | 17/919 | 172/18723 | 4.79e-03 | 3.95e-02 | 17 |
| GO:000721922 | Skin | cSCC | Notch signaling pathway | 60/4864 | 172/18723 | 5.82e-03 | 2.87e-02 | 60 |
| GO:00072199 | Thyroid | PTC | Notch signaling pathway | 70/5968 | 172/18723 | 8.82e-03 | 3.67e-02 | 70 |
| GO:000721915 | Thyroid | ATC | Notch signaling pathway | 79/6293 | 172/18723 | 5.08e-04 | 2.96e-03 | 79 |
| Page: 1 |
| Pathway ID | Tissue | Disease Stage | Description | Gene Ratio | Bg Ratio | pvalue | p.adjust | qvalue | Count |
| hsa051657 | Cervix | CC | Human papillomavirus infection | 74/1267 | 331/8465 | 1.70e-04 | 1.02e-03 | 6.03e-04 | 74 |
| hsa04658 | Cervix | CC | Th1 and Th2 cell differentiation | 24/1267 | 92/8465 | 3.71e-03 | 1.34e-02 | 7.91e-03 | 24 |
| hsa04330 | Cervix | CC | Notch signaling pathway | 17/1267 | 62/8465 | 7.99e-03 | 2.56e-02 | 1.51e-02 | 17 |
| hsa0516512 | Cervix | CC | Human papillomavirus infection | 74/1267 | 331/8465 | 1.70e-04 | 1.02e-03 | 6.03e-04 | 74 |
| hsa046581 | Cervix | CC | Th1 and Th2 cell differentiation | 24/1267 | 92/8465 | 3.71e-03 | 1.34e-02 | 7.91e-03 | 24 |
| hsa043301 | Cervix | CC | Notch signaling pathway | 17/1267 | 62/8465 | 7.99e-03 | 2.56e-02 | 1.51e-02 | 17 |
| hsa0516510 | Esophagus | ESCC | Human papillomavirus infection | 215/4205 | 331/8465 | 7.86e-09 | 7.12e-08 | 3.65e-08 | 215 |
| hsa043306 | Esophagus | ESCC | Notch signaling pathway | 42/4205 | 62/8465 | 2.97e-03 | 7.97e-03 | 4.08e-03 | 42 |
| hsa046585 | Esophagus | ESCC | Th1 and Th2 cell differentiation | 58/4205 | 92/8465 | 6.49e-03 | 1.60e-02 | 8.19e-03 | 58 |
| hsa0516515 | Esophagus | ESCC | Human papillomavirus infection | 215/4205 | 331/8465 | 7.86e-09 | 7.12e-08 | 3.65e-08 | 215 |
| hsa0433013 | Esophagus | ESCC | Notch signaling pathway | 42/4205 | 62/8465 | 2.97e-03 | 7.97e-03 | 4.08e-03 | 42 |
| hsa0465812 | Esophagus | ESCC | Th1 and Th2 cell differentiation | 58/4205 | 92/8465 | 6.49e-03 | 1.60e-02 | 8.19e-03 | 58 |
| hsa051656 | Lung | IAC | Human papillomavirus infection | 71/1053 | 331/8465 | 1.88e-06 | 7.63e-05 | 5.06e-05 | 71 |
| hsa0516511 | Lung | IAC | Human papillomavirus infection | 71/1053 | 331/8465 | 1.88e-06 | 7.63e-05 | 5.06e-05 | 71 |
| hsa0516521 | Lung | AIS | Human papillomavirus infection | 64/961 | 331/8465 | 1.03e-05 | 3.04e-04 | 1.95e-04 | 64 |
| hsa0516531 | Lung | AIS | Human papillomavirus infection | 64/961 | 331/8465 | 1.03e-05 | 3.04e-04 | 1.95e-04 | 64 |
| hsa051654 | Lung | MIAC | Human papillomavirus infection | 32/507 | 331/8465 | 4.78e-03 | 3.49e-02 | 2.52e-02 | 32 |
| hsa051655 | Lung | MIAC | Human papillomavirus infection | 32/507 | 331/8465 | 4.78e-03 | 3.49e-02 | 2.52e-02 | 32 |
| hsa051659 | Oral cavity | OSCC | Human papillomavirus infection | 200/3704 | 331/8465 | 3.83e-10 | 4.93e-09 | 2.51e-09 | 200 |
| hsa043305 | Oral cavity | OSCC | Notch signaling pathway | 44/3704 | 62/8465 | 1.26e-05 | 5.55e-05 | 2.83e-05 | 44 |
| Page: 1 2 |
Top |
Cell-cell communication analysis |
| Identification of potential cell-cell interactions between two cell types and their ligand-receptor pairs for different disease states |
| Ligand | Receptor | LRpair | Pathway | Tissue | Disease Stage |
| Page: 1 |
Top |
Single-cell gene regulatory network inference analysis |
| Find out the significant the regulons (TFs) and the target genes of each regulon across cell types for different disease states |
| TF | Cell Type | Tissue | Disease Stage | Target Gene | RSS | Regulon Activity |
| ∗The dot plots of a searched regulon are shown for all cell subpopulations in each disease state of each tissue based on the regulon specific score inferred using pySCENIC and by calculating the average expression. |
| Page: 1 |
Top |
Somatic mutation of malignant transformation related genes |
| Annotation of somatic variants for genes involved in malignant transformation |
| Hugo Symbol | Variant Class | Variant Classification | dbSNP RS | HGVSc | HGVSp | HGVSp Short | SWISSPROT | BIOTYPE | SIFT | PolyPhen | Tumor Sample Barcode | Tissue | Histology | Sex | Age | Stage | Therapy Types | Drugs | Outcome |
| MAML2 | SNV | Missense_Mutation | c.2395N>A | p.Pro799Thr | p.P799T | Q8IZL2 | protein_coding | deleterious(0) | probably_damaging(0.997) | TCGA-A8-A09A-01 | Breast | breast invasive carcinoma | Female | <65 | I/II | Hormone Therapy | tamoxiphen | SD | |
| MAML2 | SNV | Missense_Mutation | c.1715N>T | p.Pro572Leu | p.P572L | Q8IZL2 | protein_coding | deleterious(0) | benign(0.241) | TCGA-AN-A0XU-01 | Breast | breast invasive carcinoma | Female | <65 | I/II | Unknown | Unknown | SD | |
| MAML2 | SNV | Missense_Mutation | novel | c.2868N>A | p.Met956Ile | p.M956I | Q8IZL2 | protein_coding | tolerated(0.06) | benign(0) | TCGA-AQ-A54O-01 | Breast | breast invasive carcinoma | Male | <65 | I/II | Chemotherapy | adriamycin | CR |
| MAML2 | SNV | Missense_Mutation | c.182N>A | p.Gly61Asp | p.G61D | Q8IZL2 | protein_coding | deleterious(0.01) | probably_damaging(0.991) | TCGA-BH-A18G-01 | Breast | breast invasive carcinoma | Female | >=65 | I/II | Unknown | Unknown | SD | |
| MAML2 | SNV | Missense_Mutation | rs199840764 | c.341N>T | p.Ala114Val | p.A114V | Q8IZL2 | protein_coding | tolerated(1) | benign(0) | TCGA-BH-A18L-01 | Breast | breast invasive carcinoma | Female | <65 | III/IV | Unknown | Unknown | SD |
| MAML2 | SNV | Missense_Mutation | c.199N>A | p.Asp67Asn | p.D67N | Q8IZL2 | protein_coding | deleterious(0) | probably_damaging(0.999) | TCGA-BH-A1EV-01 | Breast | breast invasive carcinoma | Female | <65 | III/IV | Unknown | Unknown | PD | |
| MAML2 | SNV | Missense_Mutation | novel | c.715N>G | p.Pro239Ala | p.P239A | Q8IZL2 | protein_coding | tolerated(0.46) | benign(0.009) | TCGA-BH-A6R9-01 | Breast | breast invasive carcinoma | Female | <65 | I/II | Unknown | Unknown | SD |
| MAML2 | SNV | Missense_Mutation | novel | c.2725N>T | p.Pro909Ser | p.P909S | Q8IZL2 | protein_coding | tolerated(0.88) | benign(0.046) | TCGA-D8-A1JG-01 | Breast | breast invasive carcinoma | Female | <65 | I/II | Chemotherapy | doxorubicin | SD |
| MAML2 | SNV | Missense_Mutation | c.2995N>A | p.Ser999Thr | p.S999T | Q8IZL2 | protein_coding | tolerated(0.37) | benign(0.023) | TCGA-E9-A245-01 | Breast | breast invasive carcinoma | Female | <65 | I/II | Hormone Therapy | tamoxiphen | SD | |
| MAML2 | insertion | Frame_Shift_Ins | novel | c.1618_1619insTACTAATTAGAGAACTCTGGCTGAAT | p.Ser540IlefsTer150 | p.S540Ifs*150 | Q8IZL2 | protein_coding | TCGA-A2-A0EV-01 | Breast | breast invasive carcinoma | Female | >=65 | I/II | Unknown | Unknown | SD |
| Page: 1 2 3 4 5 6 7 8 9 10 11 12 |
Top |
Related drugs of malignant transformation related genes |
| Identification of chemicals and drugs interact with genes involved in malignant transfromation |
| (DGIdb 4.0) |
| Entrez ID | Symbol | Category | Interaction Types | Drug Claim Name | Drug Name | PMIDs |
| Page: 1 |

Copyright 2023-Present -The University of Texas Health Science Center at Houston |