
|
|||||
|
 | |
| |
| |
| |
| |
| |
|
Gene: MAML1 |
Gene summary for MAML1 |
| Gene information | Species | Human | Gene symbol | MAML1 | Gene ID | 9794 |
| Gene name | mastermind like transcriptional coactivator 1 | |
| Gene Alias | Mam-1 | |
| Cytomap | 5q35.3 | |
| Gene Type | protein-coding | GO ID | GO:0003161 | UniProtAcc | Q92585 |
Top |
Malignant transformation analysis |
| Identification of the aberrant gene expression in precancerous and cancerous lesions by comparing the gene expression of stem-like cells in diseased tissues with normal stem cells |
| Entrez ID | Symbol | Replicates | Species | Organ | Tissue | Adj P-value | Log2FC | Malignancy |
| 9794 | MAML1 | LZE7T | Human | Esophagus | ESCC | 8.68e-05 | 2.47e-01 | 0.0667 |
| 9794 | MAML1 | LZE24T | Human | Esophagus | ESCC | 3.24e-09 | 1.48e-01 | 0.0596 |
| 9794 | MAML1 | P1T-E | Human | Esophagus | ESCC | 8.87e-06 | 2.42e-01 | 0.0875 |
| 9794 | MAML1 | P2T-E | Human | Esophagus | ESCC | 3.33e-14 | 2.47e-01 | 0.1177 |
| 9794 | MAML1 | P4T-E | Human | Esophagus | ESCC | 2.43e-14 | 1.52e-01 | 0.1323 |
| 9794 | MAML1 | P5T-E | Human | Esophagus | ESCC | 7.73e-16 | 1.29e-01 | 0.1327 |
| 9794 | MAML1 | P8T-E | Human | Esophagus | ESCC | 5.10e-11 | 1.40e-01 | 0.0889 |
| 9794 | MAML1 | P9T-E | Human | Esophagus | ESCC | 3.16e-04 | 1.12e-01 | 0.1131 |
| 9794 | MAML1 | P10T-E | Human | Esophagus | ESCC | 7.47e-18 | 2.16e-01 | 0.116 |
| 9794 | MAML1 | P11T-E | Human | Esophagus | ESCC | 1.92e-06 | 2.09e-01 | 0.1426 |
| 9794 | MAML1 | P12T-E | Human | Esophagus | ESCC | 9.18e-24 | 2.64e-01 | 0.1122 |
| 9794 | MAML1 | P15T-E | Human | Esophagus | ESCC | 1.19e-07 | 2.13e-01 | 0.1149 |
| 9794 | MAML1 | P16T-E | Human | Esophagus | ESCC | 1.04e-15 | 8.95e-02 | 0.1153 |
| 9794 | MAML1 | P20T-E | Human | Esophagus | ESCC | 8.83e-10 | 1.67e-01 | 0.1124 |
| 9794 | MAML1 | P21T-E | Human | Esophagus | ESCC | 2.61e-06 | 1.31e-01 | 0.1617 |
| 9794 | MAML1 | P22T-E | Human | Esophagus | ESCC | 1.06e-19 | 4.75e-01 | 0.1236 |
| 9794 | MAML1 | P23T-E | Human | Esophagus | ESCC | 1.34e-11 | 1.78e-01 | 0.108 |
| 9794 | MAML1 | P24T-E | Human | Esophagus | ESCC | 1.61e-05 | 4.86e-02 | 0.1287 |
| 9794 | MAML1 | P26T-E | Human | Esophagus | ESCC | 1.25e-08 | 1.52e-01 | 0.1276 |
| 9794 | MAML1 | P27T-E | Human | Esophagus | ESCC | 1.57e-16 | 1.11e-01 | 0.1055 |
| Page: 1 2 3 |
| Tissue | Expression Dynamics | Abbreviation |
| Esophagus | 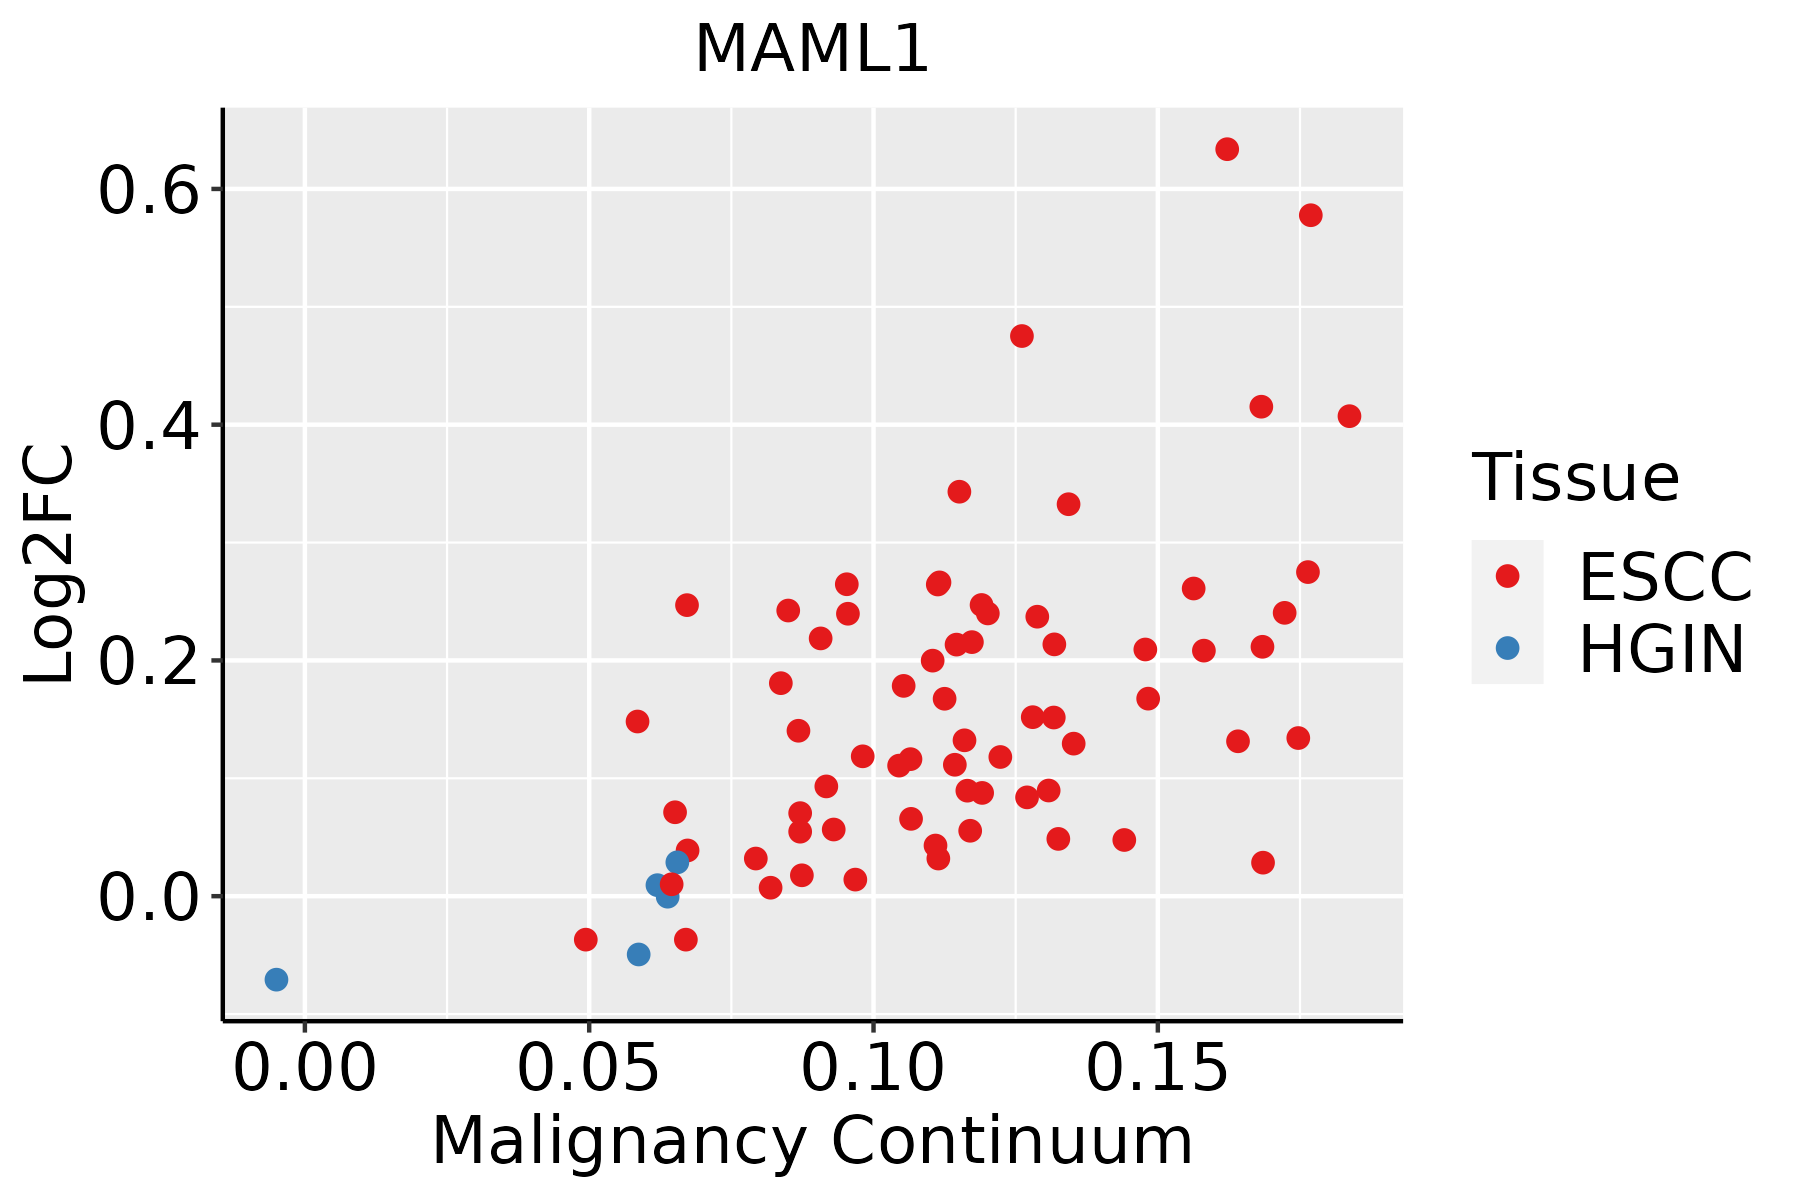 | ESCC: Esophageal squamous cell carcinoma |
| HGIN: High-grade intraepithelial neoplasias | ||
| LGIN: Low-grade intraepithelial neoplasias |
| ∗log2FC in expression of this searched gene in stem-like cells from each diseased tissue sample relative to stem-like cells in normal samples in each tissue plotted against the malignancy continuum. Samples are colored based on if they are from different disease stage. |
Top |
Malignant transformation related pathway analysis |
| Find out the enriched GO biological processes and KEGG pathways involved in transition from healthy to precancer to cancer |
| Tissue | Disease Stage | Enriched GO biological Processes |
| Colorectum | AD |  |
| Colorectum | SER |  |
| Colorectum | MSS |  |
| Colorectum | MSI-H |  |
| Colorectum | FAP |  |
| ∗Top 15 enriched GO BP terms are showed in the bar plot of each disease state in each tissue. Each row represents a significant GO biological process which is colored according to the -log10(p.adjust). |
| Page: 1 2 3 4 5 6 7 8 9 |
| GO ID | Tissue | Disease Stage | Description | Gene Ratio | Bg Ratio | pvalue | p.adjust | Count |
| GO:00072197 | Esophagus | ESCC | Notch signaling pathway | 106/8552 | 172/18723 | 1.74e-05 | 1.55e-04 | 106 |
| GO:00454454 | Esophagus | ESCC | myoblast differentiation | 52/8552 | 84/18723 | 1.98e-03 | 8.90e-03 | 52 |
| GO:006053716 | Esophagus | ESCC | muscle tissue development | 211/8552 | 403/18723 | 3.84e-03 | 1.56e-02 | 211 |
| GO:00350512 | Esophagus | ESCC | cardiocyte differentiation | 86/8552 | 156/18723 | 1.09e-02 | 3.68e-02 | 86 |
| GO:001470615 | Esophagus | ESCC | striated muscle tissue development | 197/8552 | 384/18723 | 1.46e-02 | 4.74e-02 | 197 |
| Page: 1 |
| Pathway ID | Tissue | Disease Stage | Description | Gene Ratio | Bg Ratio | pvalue | p.adjust | qvalue | Count |
| hsa0516510 | Esophagus | ESCC | Human papillomavirus infection | 215/4205 | 331/8465 | 7.86e-09 | 7.12e-08 | 3.65e-08 | 215 |
| hsa043306 | Esophagus | ESCC | Notch signaling pathway | 42/4205 | 62/8465 | 2.97e-03 | 7.97e-03 | 4.08e-03 | 42 |
| hsa046585 | Esophagus | ESCC | Th1 and Th2 cell differentiation | 58/4205 | 92/8465 | 6.49e-03 | 1.60e-02 | 8.19e-03 | 58 |
| hsa0516515 | Esophagus | ESCC | Human papillomavirus infection | 215/4205 | 331/8465 | 7.86e-09 | 7.12e-08 | 3.65e-08 | 215 |
| hsa0433013 | Esophagus | ESCC | Notch signaling pathway | 42/4205 | 62/8465 | 2.97e-03 | 7.97e-03 | 4.08e-03 | 42 |
| hsa0465812 | Esophagus | ESCC | Th1 and Th2 cell differentiation | 58/4205 | 92/8465 | 6.49e-03 | 1.60e-02 | 8.19e-03 | 58 |
| Page: 1 |
Top |
Cell-cell communication analysis |
| Identification of potential cell-cell interactions between two cell types and their ligand-receptor pairs for different disease states |
| Ligand | Receptor | LRpair | Pathway | Tissue | Disease Stage |
| Page: 1 |
Top |
Single-cell gene regulatory network inference analysis |
| Find out the significant the regulons (TFs) and the target genes of each regulon across cell types for different disease states |
| TF | Cell Type | Tissue | Disease Stage | Target Gene | RSS | Regulon Activity |
| ∗The dot plots of a searched regulon are shown for all cell subpopulations in each disease state of each tissue based on the regulon specific score inferred using pySCENIC and by calculating the average expression. |
| Page: 1 |
Top |
Somatic mutation of malignant transformation related genes |
| Annotation of somatic variants for genes involved in malignant transformation |
| Hugo Symbol | Variant Class | Variant Classification | dbSNP RS | HGVSc | HGVSp | HGVSp Short | SWISSPROT | BIOTYPE | SIFT | PolyPhen | Tumor Sample Barcode | Tissue | Histology | Sex | Age | Stage | Therapy Types | Drugs | Outcome |
| MAML1 | SNV | Missense_Mutation | c.1754C>T | p.Pro585Leu | p.P585L | Q92585 | protein_coding | deleterious(0) | probably_damaging(0.925) | TCGA-A8-A06R-01 | Breast | breast invasive carcinoma | Female | >=65 | I/II | Chemotherapy | 5-fluorouracil | CR | |
| MAML1 | SNV | Missense_Mutation | c.2344C>A | p.Pro782Thr | p.P782T | Q92585 | protein_coding | tolerated(0.31) | benign(0.003) | TCGA-AN-A0AK-01 | Breast | breast invasive carcinoma | Female | >=65 | I/II | Unknown | Unknown | SD | |
| MAML1 | SNV | Missense_Mutation | c.2150A>T | p.Asn717Ile | p.N717I | Q92585 | protein_coding | deleterious(0.01) | benign(0.08) | TCGA-E2-A1II-01 | Breast | breast invasive carcinoma | Female | <65 | I/II | Chemotherapy | doxorubicin | SD | |
| MAML1 | deletion | Frame_Shift_Del | novel | c.2466delN | p.Lys822AsnfsTer36 | p.K822Nfs*36 | Q92585 | protein_coding | TCGA-D8-A27V-01 | Breast | breast invasive carcinoma | Female | <65 | I/II | Hormone Therapy | tamoxiphen | SD | ||
| MAML1 | SNV | Missense_Mutation | c.793G>C | p.Glu265Gln | p.E265Q | Q92585 | protein_coding | tolerated(0.07) | probably_damaging(0.987) | TCGA-C5-A8XK-01 | Cervix | cervical & endocervical cancer | Female | <65 | I/II | Chemotherapy | cisplatin | SD | |
| MAML1 | SNV | Missense_Mutation | c.1498N>G | p.Gln500Glu | p.Q500E | Q92585 | protein_coding | deleterious(0.03) | benign(0.142) | TCGA-EK-A2RK-01 | Cervix | cervical & endocervical cancer | Female | >=65 | I/II | Unknown | Unknown | SD | |
| MAML1 | SNV | Missense_Mutation | rs767452281 | c.1222N>T | p.Arg408Cys | p.R408C | Q92585 | protein_coding | deleterious(0) | probably_damaging(0.987) | TCGA-EK-A2RM-01 | Cervix | cervical & endocervical cancer | Female | <65 | I/II | Unknown | Unknown | SD |
| MAML1 | SNV | Missense_Mutation | c.2974N>G | p.Leu992Val | p.L992V | Q92585 | protein_coding | deleterious(0) | probably_damaging(0.997) | TCGA-FU-A770-01 | Cervix | cervical & endocervical cancer | Female | <65 | III/IV | Unknown | Unknown | SD | |
| MAML1 | SNV | Missense_Mutation | novel | c.1028N>T | p.Gly343Val | p.G343V | Q92585 | protein_coding | tolerated(0.33) | benign(0.006) | TCGA-VS-A94X-01 | Cervix | cervical & endocervical cancer | Female | <65 | I/II | Chemotherapy | cisplatin | PD |
| MAML1 | SNV | Missense_Mutation | rs763800343 | c.1402N>T | p.Pro468Ser | p.P468S | Q92585 | protein_coding | tolerated(0.13) | benign(0.012) | TCGA-A6-6780-01 | Colorectum | colon adenocarcinoma | Male | >=65 | I/II | Unknown | Unknown | SD |
| Page: 1 2 3 4 5 6 7 |
Top |
Related drugs of malignant transformation related genes |
| Identification of chemicals and drugs interact with genes involved in malignant transfromation |
| (DGIdb 4.0) |
| Entrez ID | Symbol | Category | Interaction Types | Drug Claim Name | Drug Name | PMIDs |
| Page: 1 |

Copyright 2023-Present -The University of Texas Health Science Center at Houston |