Schematic overview of the cellular and molecular mechanisms involved in the cancer progression, including the proposed cellular and molecular mechanisms in cancer cells trajectory. AT1: alveolar type 1 cells; AT2: alveolar type 2 cells; AAH: atypical adenomatous hyperplasia; AIS: adenocarcinoma in situ; MIA: minimally invasive adenocarcinoma; IA: invasive adenocarcinoma; EMT: epithelial-mesenchymal transition

Home

Download

Statistics

Help

Contact

Center for Computational Systems Medicine
leaf

Gene summary

leaf

Malignant transformation analysis

leaf

Malignant transformation related pathway analysis

leaf

Cell-cell communication analysis

leaf

Single-cell gene regulatory network inference analysis

leaf

Somatic mutation of malignant transformation related genes

leaf

Related drugs of malignant transformation related genes

Gene: MALSU1

Gene summary for MALSU1

check button Gene summary.

Gene informationSpeciesHuman
Gene symbol

MALSU1

Gene ID

115416

Gene namemitochondrial assembly of ribosomal large subunit 1
Gene AliasC7orf30
Cytomap7p15.3
Gene Typeprotein-coding
GO ID

GO:0006412

UniProtAcc

Q96EH3


Top

Malignant transformation analysis

check button Identification of the aberrant gene expression in precancerous and cancerous lesions by comparing the gene expression of stem-like cells in diseased tissues with normal stem cells
check button Malignant transformation involving gene list.
Entrez IDSymbolReplicatesSpeciesOrganTissueAdj P-valueLog2FCMalignancy
115416MALSU1LZE2THumanEsophagusESCC5.54e-088.20e-010.082
115416MALSU1LZE4THumanEsophagusESCC2.14e-196.39e-010.0811
115416MALSU1LZE7THumanEsophagusESCC4.09e-105.28e-010.0667
115416MALSU1LZE8THumanEsophagusESCC5.50e-143.88e-010.067
115416MALSU1LZE20THumanEsophagusESCC9.27e-133.81e-010.0662
115416MALSU1LZE22D1HumanEsophagusHGIN1.58e-043.59e-010.0595
115416MALSU1LZE22THumanEsophagusESCC1.79e-065.92e-010.068
115416MALSU1LZE24THumanEsophagusESCC3.43e-267.40e-010.0596
115416MALSU1LZE6THumanEsophagusESCC5.82e-065.28e-010.0845
115416MALSU1P1T-EHumanEsophagusESCC1.84e-105.52e-010.0875
115416MALSU1P2T-EHumanEsophagusESCC4.67e-346.97e-010.1177
115416MALSU1P4T-EHumanEsophagusESCC9.92e-411.18e+000.1323
115416MALSU1P5T-EHumanEsophagusESCC1.49e-439.60e-010.1327
115416MALSU1P8T-EHumanEsophagusESCC1.34e-327.57e-010.0889
115416MALSU1P9T-EHumanEsophagusESCC3.68e-317.82e-010.1131
115416MALSU1P10T-EHumanEsophagusESCC5.73e-346.64e-010.116
115416MALSU1P11T-EHumanEsophagusESCC9.73e-219.30e-010.1426
115416MALSU1P12T-EHumanEsophagusESCC3.93e-428.16e-010.1122
115416MALSU1P15T-EHumanEsophagusESCC1.18e-378.16e-010.1149
115416MALSU1P16T-EHumanEsophagusESCC2.95e-428.74e-010.1153
Page: 1 2 3 4 5 6 7 

check button Transcriptomic changes along malignancy continuum.
TissueExpression DynamicsAbbreviation
EsophagusThe image shows the transcriptomic changes along malignancy continuum.log2FC in expression of this searched gene in stem-like cells from each diseased tissue sample relative to stem-like cells in normal samples in each tissue plotted against the malignancy continuum. Samples are colored based on if they are from different disease stage.
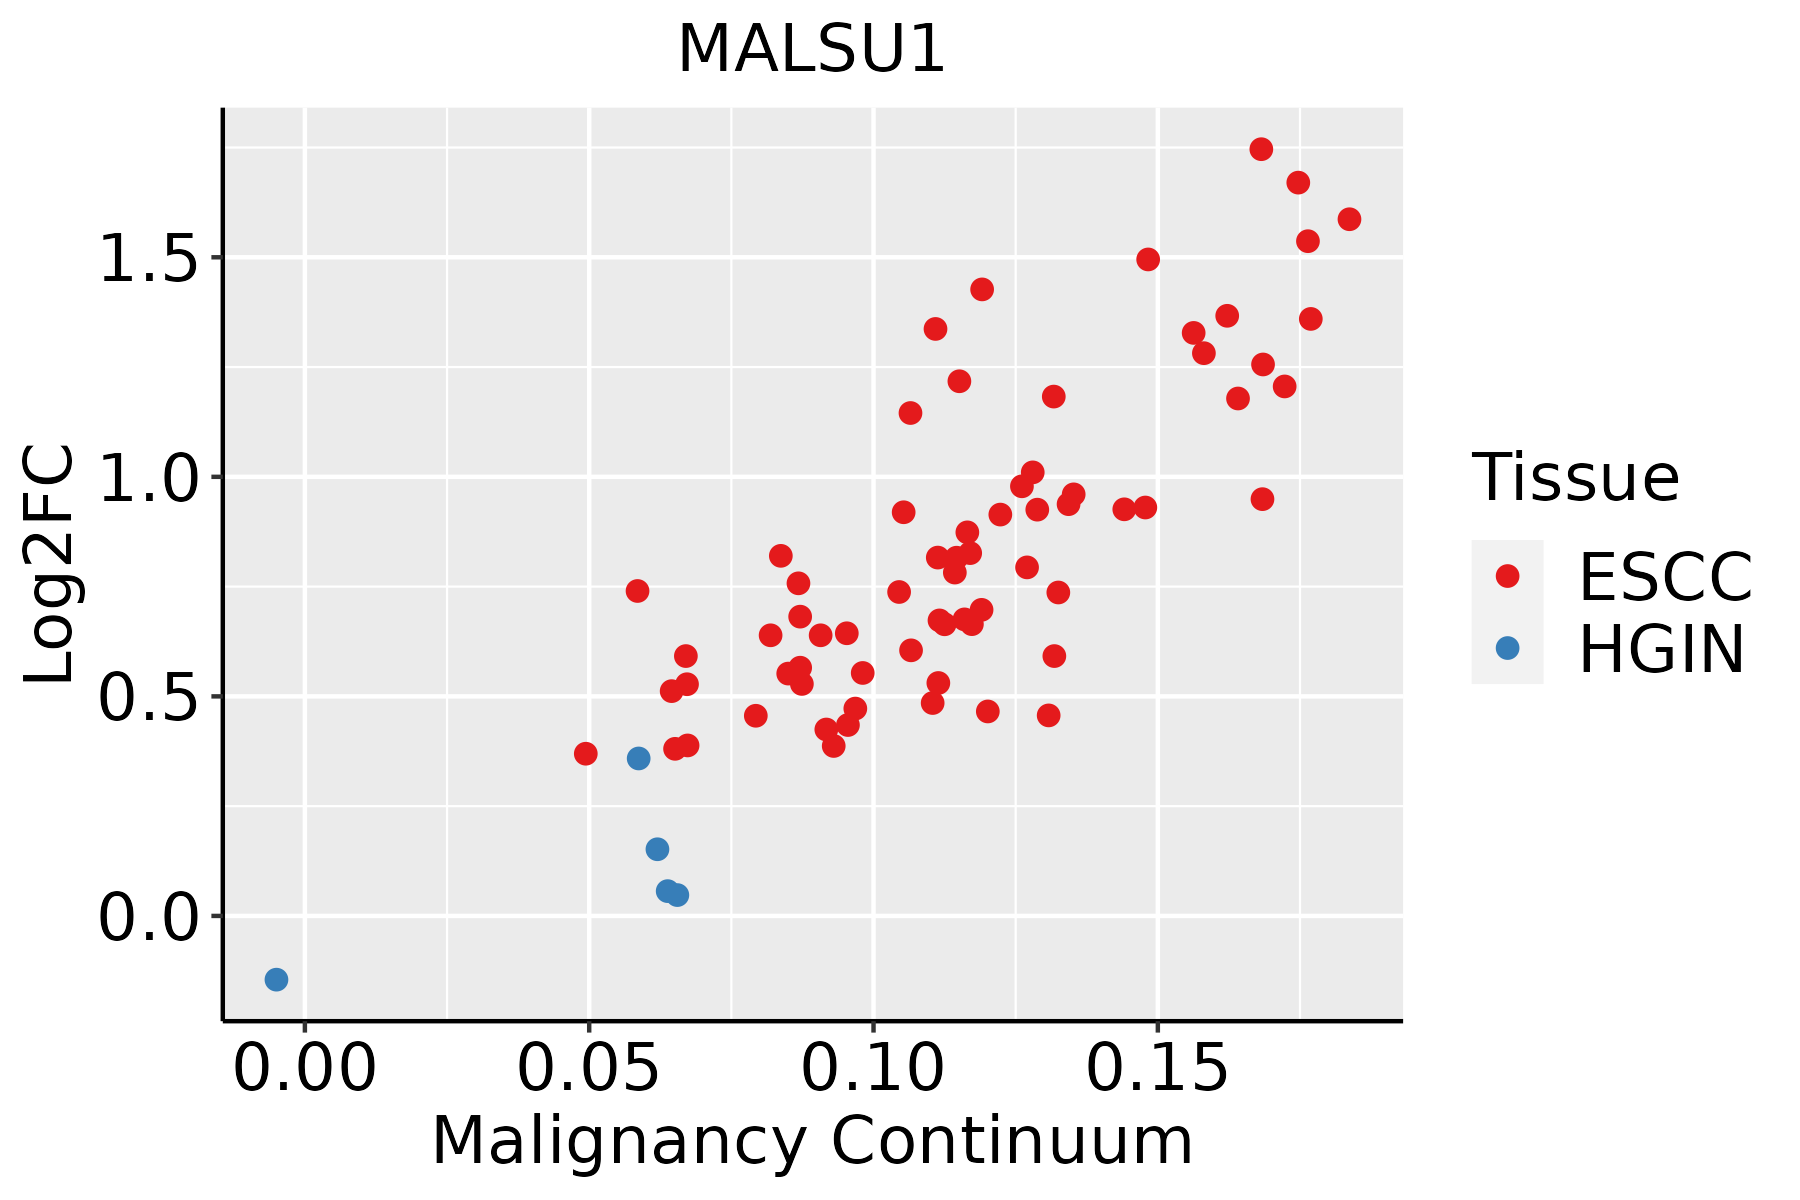
ESCC: Esophageal squamous cell carcinoma
HGIN: High-grade intraepithelial neoplasias
LGIN: Low-grade intraepithelial neoplasias
LiverThe image shows the transcriptomic changes along malignancy continuum.log2FC in expression of this searched gene in stem-like cells from each diseased tissue sample relative to stem-like cells in normal samples in each tissue plotted against the malignancy continuum. Samples are colored based on if they are from different disease stage.
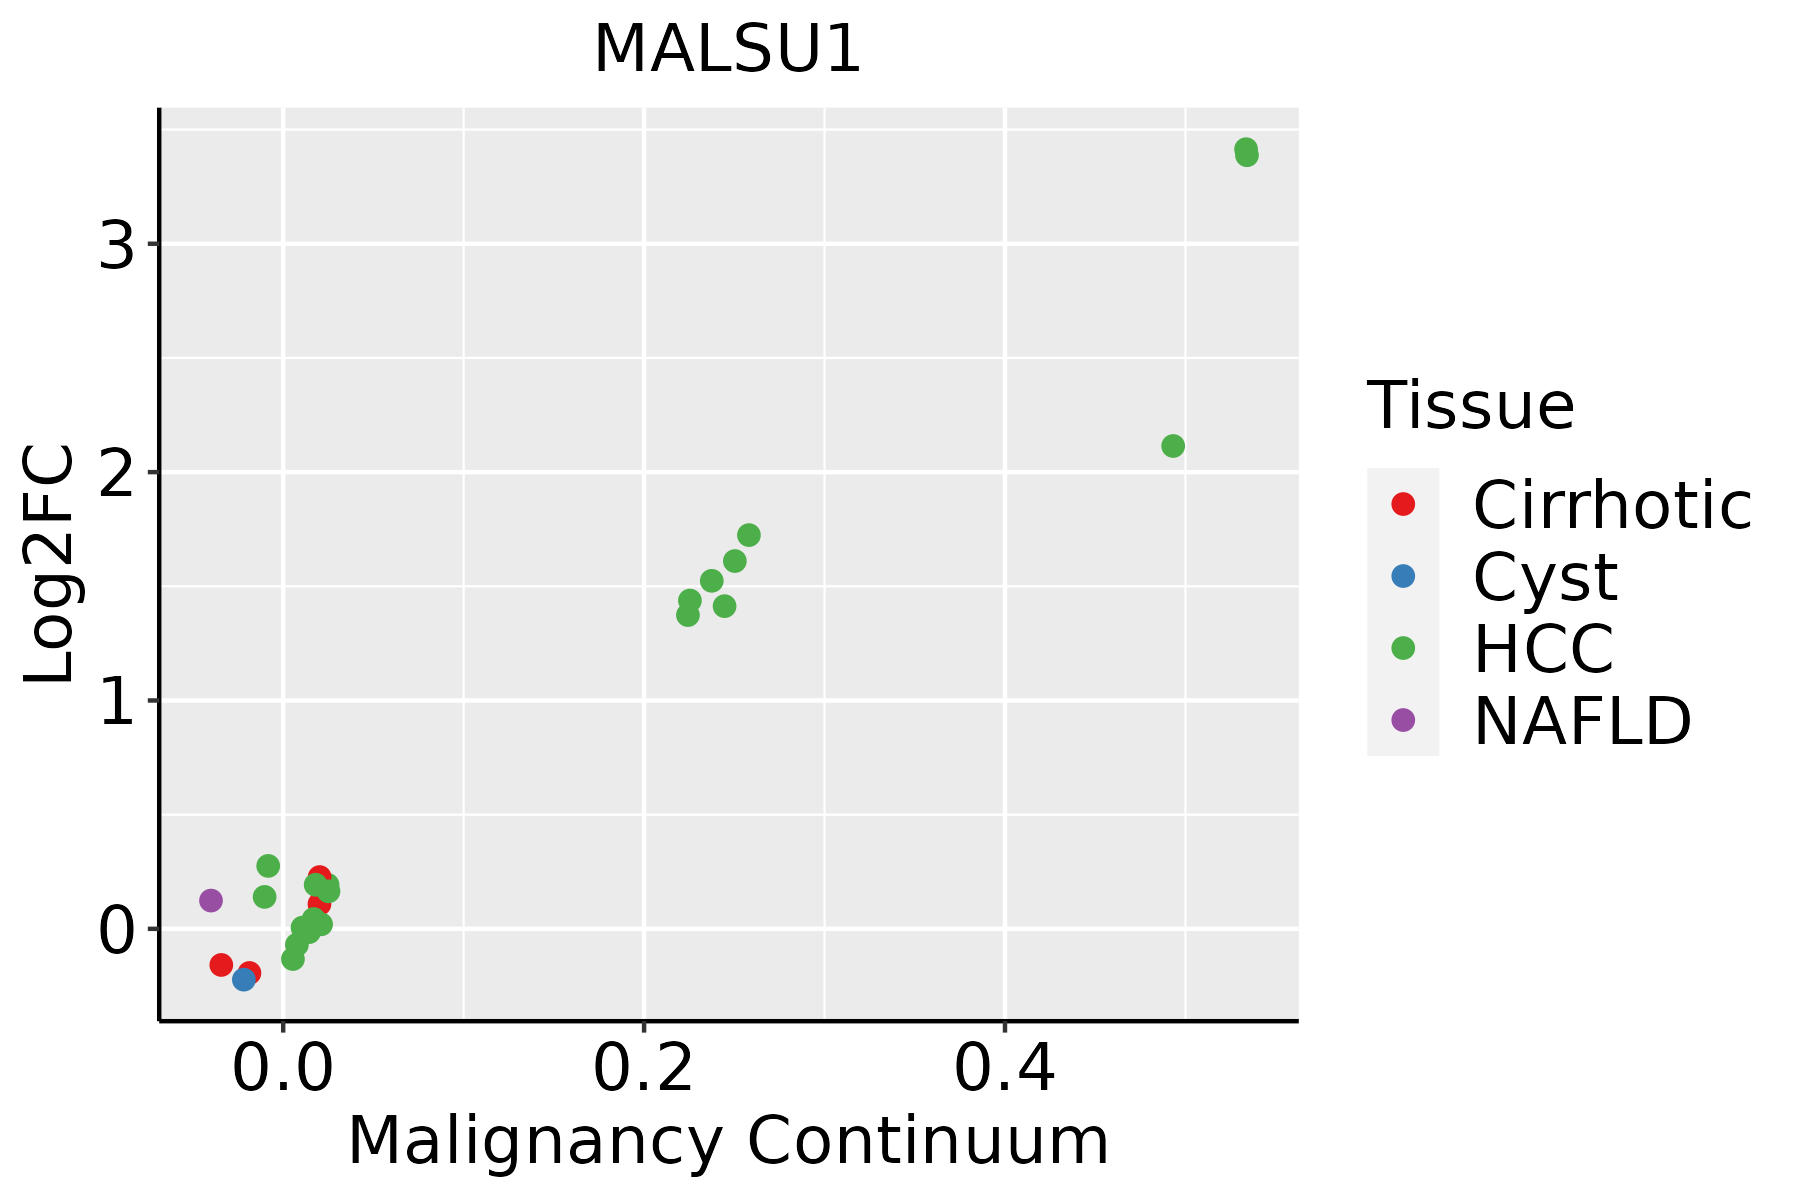
HCC: Hepatocellular carcinoma
NAFLD: Non-alcoholic fatty liver disease
Oral CavityThe image shows the transcriptomic changes along malignancy continuum.log2FC in expression of this searched gene in stem-like cells from each diseased tissue sample relative to stem-like cells in normal samples in each tissue plotted against the malignancy continuum. Samples are colored based on if they are from different disease stage.
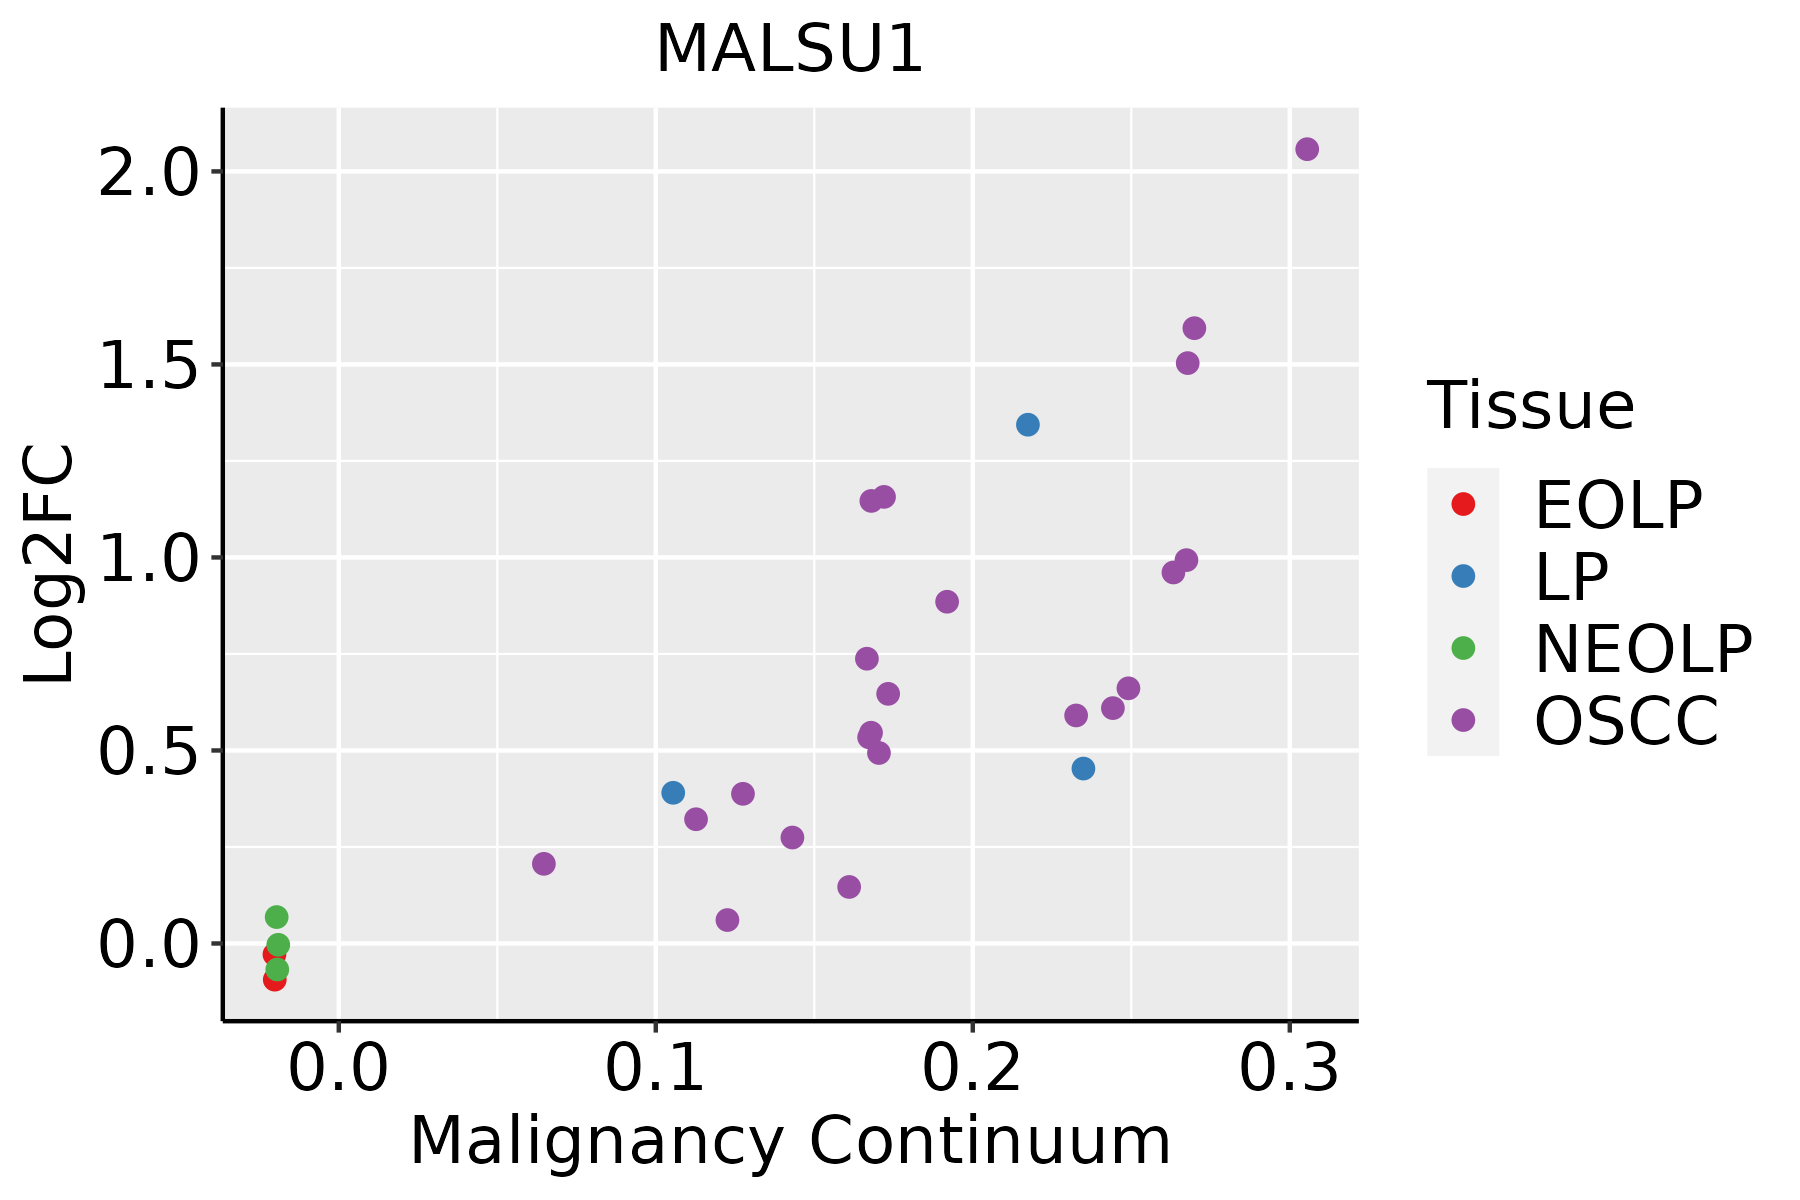
EOLP: Erosive Oral lichen planus
LP: leukoplakia
NEOLP: Non-erosive oral lichen planus
OSCC: Oral squamous cell carcinoma
SkinThe image shows the transcriptomic changes along malignancy continuum.log2FC in expression of this searched gene in stem-like cells from each diseased tissue sample relative to stem-like cells in normal samples in each tissue plotted against the malignancy continuum. Samples are colored based on if they are from different disease stage.
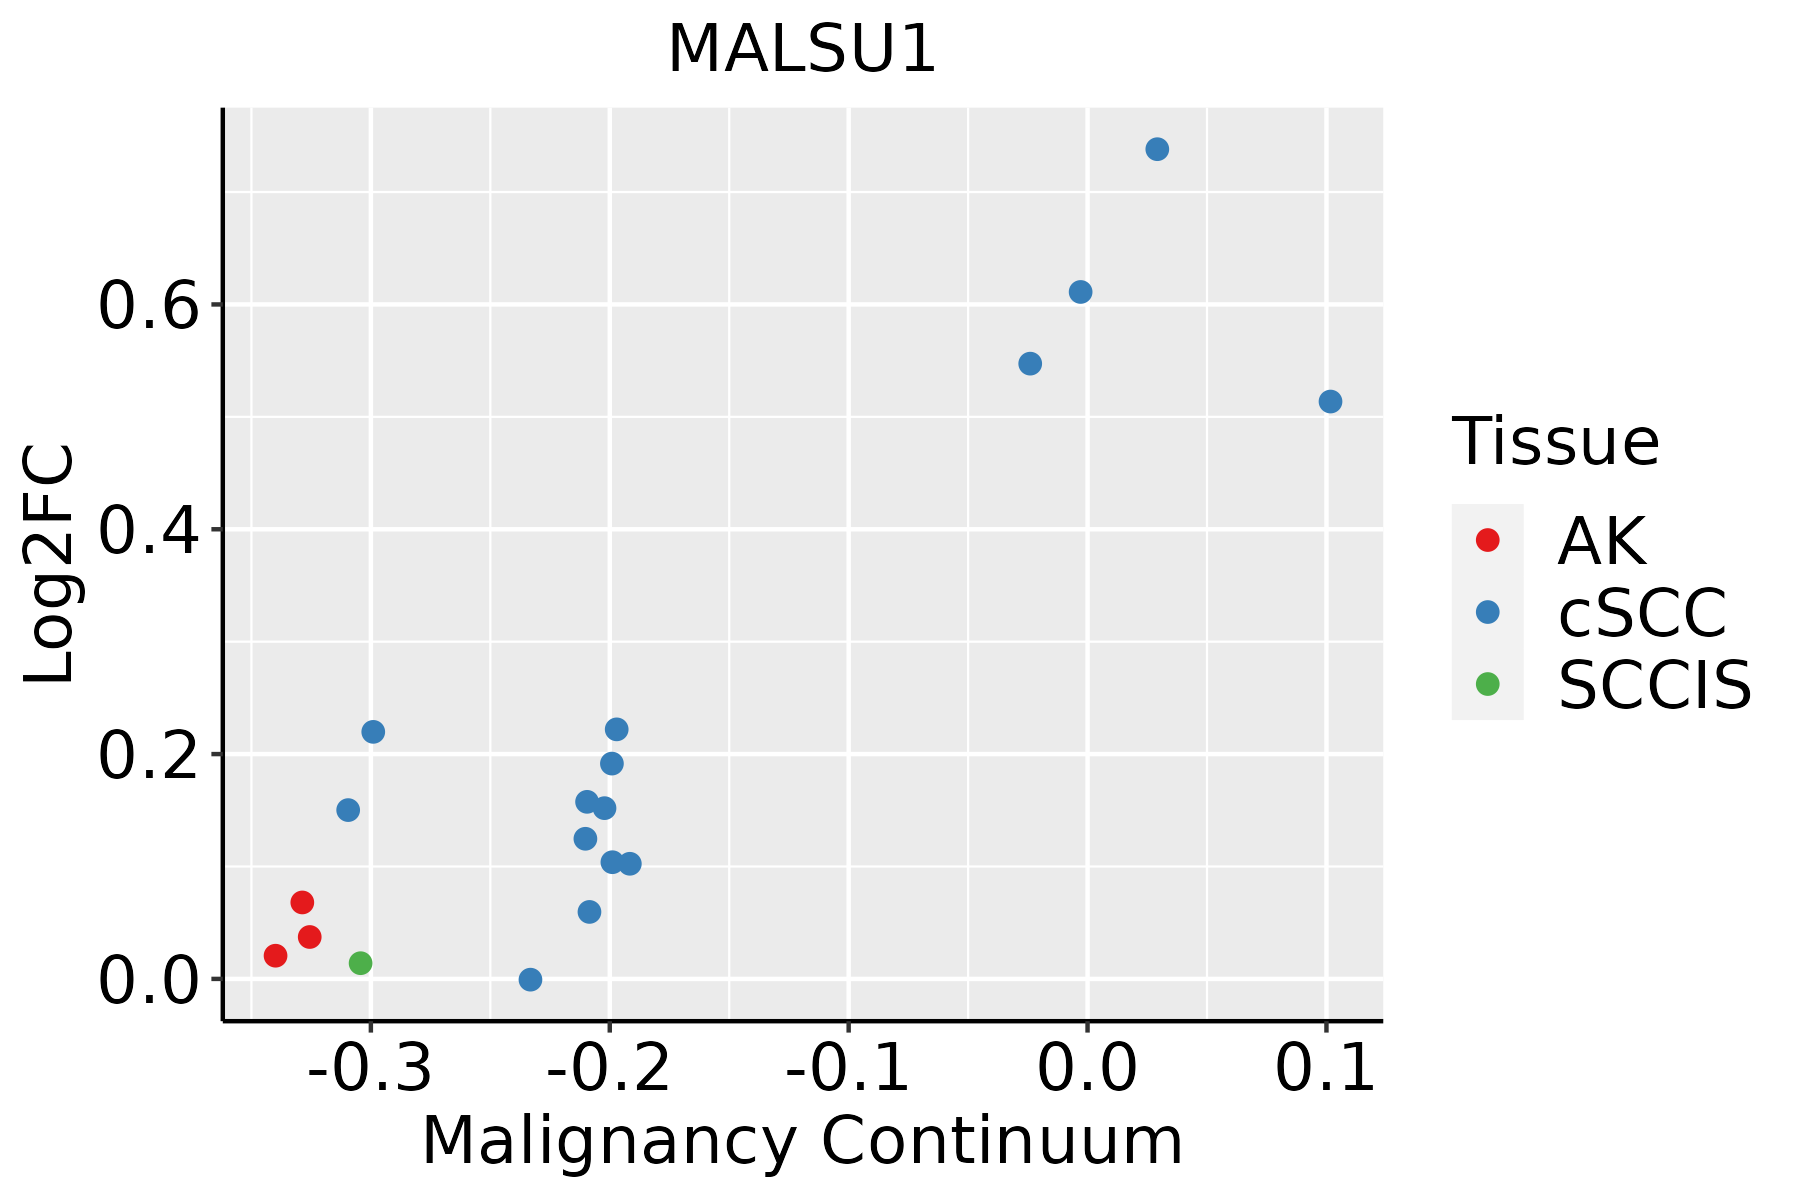
AK: Actinic keratosis
cSCC: Cutaneous squamous cell carcinoma
SCCIS:squamous cell carcinoma in situ
ThyroidThe image shows the transcriptomic changes along malignancy continuum.log2FC in expression of this searched gene in stem-like cells from each diseased tissue sample relative to stem-like cells in normal samples in each tissue plotted against the malignancy continuum. Samples are colored based on if they are from different disease stage.ATC: Anaplastic thyroid cancer
HT: Hashimoto's thyroiditis
PTC: Papillary thyroid cancer
∗log2FC in expression of this searched gene in stem-like cells from each diseased tissue sample relative to stem-like cells in normal samples in each tissue plotted against the malignancy continuum. Samples are colored based on if they are from different disease stage.

Top

Malignant transformation related pathway analysis

check buttonFind out the enriched GO biological processes and KEGG pathways involved in transition from healthy to precancer to cancer
check button Figure of enriched GO biological processes.
TissueDisease StageEnriched GO biological Processes
ColorectumADGO analysis - Figure of enriched GO biological processes: Top 15 enriched GO BP terms are showed in the bar plot of each disease state in each tissue. Each row represents a significant GO biological process which is colored according to the -log10(p.adjust).
ColorectumSERGO analysis - Figure of enriched GO biological processes: Top 15 enriched GO BP terms are showed in the bar plot of each disease state in each tissue. Each row represents a significant GO biological process which is colored according to the -log10(p.adjust).
ColorectumMSSGO analysis - Figure of enriched GO biological processes: Top 15 enriched GO BP terms are showed in the bar plot of each disease state in each tissue. Each row represents a significant GO biological process which is colored according to the -log10(p.adjust).
ColorectumMSI-HGO analysis - Figure of enriched GO biological processes: Top 15 enriched GO BP terms are showed in the bar plot of each disease state in each tissue. Each row represents a significant GO biological process which is colored according to the -log10(p.adjust).
ColorectumFAPGO analysis - Figure of enriched GO biological processes: Top 15 enriched GO BP terms are showed in the bar plot of each disease state in each tissue. Each row represents a significant GO biological process which is colored according to the -log10(p.adjust).
∗Top 15 enriched GO BP terms are showed in the bar plot of each disease state in each tissue. Each row represents a significant GO biological process which is colored according to the -log10(p.adjust).
Page: 1 2 3 4 5 6 7 8 9 

check button Enriched GO biological processes.
GO IDTissueDisease StageDescriptionGene RatioBg Ratiopvaluep.adjustCount
GO:002261327EsophagusHGINribonucleoprotein complex biogenesis158/2587463/187232.61e-295.23e-26158
GO:000641727EsophagusHGINregulation of translation139/2587468/187231.46e-197.98e-17139
GO:004225426EsophagusHGINribosome biogenesis101/2587299/187238.74e-194.03e-16101
GO:004227326EsophagusHGINribosomal large subunit biogenesis34/258772/187238.82e-121.06e-0934
GO:00342496EsophagusHGINnegative regulation of cellular amide metabolic process66/2587273/187232.74e-069.60e-0566
GO:00171486EsophagusHGINnegative regulation of translation59/2587245/187231.03e-052.96e-0459
GO:00325435EsophagusHGINmitochondrial translation23/258776/187231.61e-043.16e-0323
GO:01400534EsophagusHGINmitochondrial gene expression27/2587108/187231.34e-031.57e-0227
GO:0022613111EsophagusESCCribonucleoprotein complex biogenesis365/8552463/187231.74e-491.11e-45365
GO:0042254111EsophagusESCCribosome biogenesis252/8552299/187233.27e-441.04e-40252
GO:014005313EsophagusESCCmitochondrial gene expression93/8552108/187231.96e-182.03e-1693
GO:0006417111EsophagusESCCregulation of translation304/8552468/187231.53e-171.33e-15304
GO:003254314EsophagusESCCmitochondrial translation68/855276/187231.02e-156.86e-1468
GO:0042273111EsophagusESCCribosomal large subunit biogenesis65/855272/187231.53e-159.82e-1465
GO:00701292EsophagusESCCregulation of mitochondrial translation22/855224/187232.82e-063.21e-0522
GO:00621252EsophagusESCCregulation of mitochondrial gene expression24/855228/187231.37e-051.25e-0424
GO:003424914EsophagusESCCnegative regulation of cellular amide metabolic process144/8552273/187231.08e-023.67e-02144
GO:002261312LiverCirrhoticribonucleoprotein complex biogenesis231/4634463/187233.28e-326.86e-29231
GO:004225412LiverCirrhoticribosome biogenesis154/4634299/187231.18e-236.72e-21154
GO:000641712LiverCirrhoticregulation of translation194/4634468/187237.28e-168.79e-14194
Page: 1 2 3 4 

check button Enriched KEGG pathways.
Pathway IDTissueDisease StageDescriptionGene RatioBg Ratiopvaluep.adjustqvalueCount
Page: 1 

Top

Cell-cell communication analysis

check buttonIdentification of potential cell-cell interactions between two cell types and their ligand-receptor pairs for different disease states
LigandReceptorLRpairPathwayTissueDisease Stage
Page: 1 

Top

Single-cell gene regulatory network inference analysis

check buttonFind out the significant the regulons (TFs) and the target genes of each regulon across cell types for different disease states
TFCell TypeTissueDisease StageTarget GeneRSSRegulon Activity
∗The dot plots of a searched regulon are shown for all cell subpopulations in each disease state of each tissue based on the regulon specific score inferred using pySCENIC and by calculating the average expression.
Page: 1 

Top

Somatic mutation of malignant transformation related genes

check buttonAnnotation of somatic variants for genes involved in malignant transformation
Hugo SymbolVariant ClassVariant ClassificationdbSNP RSHGVScHGVSpHGVSp ShortSWISSPROTBIOTYPESIFTPolyPhenTumor Sample BarcodeTissueHistologySexAgeStageTherapy TypesDrugsOutcome
MALSU1SNVMissense_Mutationc.120N>Tp.Gln40Hisp.Q40HQ96EH3protein_codingtolerated(0.13)benign(0.066)TCGA-AO-A128-01Breastbreast invasive carcinomaFemale<65I/IIChemotherapydoxorubicinSD
MALSU1SNVMissense_Mutationc.410N>Tp.Ala137Valp.A137VQ96EH3protein_codingdeleterious(0)probably_damaging(0.993)TCGA-AA-A010-01Colorectumcolon adenocarcinomaFemale<65I/IIChemotherapyfolinicCR
MALSU1SNVMissense_Mutationnovelc.573G>Tp.Glu191Aspp.E191DQ96EH3protein_codingdeleterious(0)probably_damaging(0.999)TCGA-AG-A002-01Colorectumrectum adenocarcinomaMale<65I/IIUnknownUnknownSD
MALSU1SNVMissense_Mutationc.410N>Tp.Ala137Valp.A137VQ96EH3protein_codingdeleterious(0)probably_damaging(0.993)TCGA-AX-A1CE-01Endometriumuterine corpus endometrioid carcinomaFemale<65I/IIUnspecificPaclitaxelSD
MALSU1SNVMissense_Mutationnovelc.332N>Cp.Val111Alap.V111AQ96EH3protein_codingtolerated(0.06)possibly_damaging(0.695)TCGA-AX-A2HJ-01Endometriumuterine corpus endometrioid carcinomaFemale<65I/IIUnknownUnknownSD
MALSU1SNVMissense_Mutationnovelc.573N>Tp.Glu191Aspp.E191DQ96EH3protein_codingdeleterious(0)probably_damaging(0.999)TCGA-EO-A3B0-01Endometriumuterine corpus endometrioid carcinomaFemale<65III/IVUnknownUnknownSD
MALSU1SNVMissense_Mutationnovelc.377T>Gp.Ile126Serp.I126SQ96EH3protein_codingdeleterious(0)probably_damaging(0.989)TCGA-FI-A2D5-01Endometriumuterine corpus endometrioid carcinomaFemale<65III/IVChemotherapycarboplatinumPD
MALSU1SNVMissense_Mutationrs753431892c.490A>Gp.Thr164Alap.T164AQ96EH3protein_codingtolerated(0.25)benign(0.033)TCGA-2Y-A9GU-01Liverliver hepatocellular carcinomaFemale<65I/IIUnknownUnknownSD
MALSU1SNVMissense_Mutationc.19N>Tp.Val7Leup.V7LQ96EH3protein_codingtolerated_low_confidence(0.11)benign(0.018)TCGA-CC-A7II-01Liverliver hepatocellular carcinomaMale<65III/IVUnknownUnknownPD
MALSU1SNVMissense_Mutationrs375849242c.16C>Tp.Arg6Cysp.R6CQ96EH3protein_codingtolerated_low_confidence(0.49)benign(0)TCGA-G3-AAV5-01Liverliver hepatocellular carcinomaMale>=65I/IIChemotherapyhec.1SD
Page: 1 2 

Top

Related drugs of malignant transformation related genes

check buttonIdentification of chemicals and drugs interact with genes involved in malignant transfromation
(DGIdb 4.0)
Entrez IDSymbolCategoryInteraction TypesDrug Claim NameDrug NamePMIDs
Page: 1