
|
|||||
|
 | |
| |
| |
| |
| |
| |
|
Gene: MAL2 |
Gene summary for MAL2 |
| Gene information | Species | Human | Gene symbol | MAL2 | Gene ID | 114569 |
| Gene name | mal, T cell differentiation protein 2 | |
| Gene Alias | MAL2 | |
| Cytomap | 8q24.12 | |
| Gene Type | protein-coding | GO ID | GO:0006810 | UniProtAcc | A0A024R9E4 |
Top |
Malignant transformation analysis |
| Identification of the aberrant gene expression in precancerous and cancerous lesions by comparing the gene expression of stem-like cells in diseased tissues with normal stem cells |
| Entrez ID | Symbol | Replicates | Species | Organ | Tissue | Adj P-value | Log2FC | Malignancy |
| 114569 | MAL2 | GSM4909281 | Human | Breast | IDC | 4.82e-39 | 8.80e-01 | 0.21 |
| 114569 | MAL2 | GSM4909282 | Human | Breast | IDC | 7.20e-38 | 8.61e-01 | -0.0288 |
| 114569 | MAL2 | GSM4909285 | Human | Breast | IDC | 1.98e-04 | 2.41e-01 | 0.21 |
| 114569 | MAL2 | GSM4909286 | Human | Breast | IDC | 5.32e-07 | 1.00e-01 | 0.1081 |
| 114569 | MAL2 | GSM4909290 | Human | Breast | IDC | 4.05e-28 | 8.24e-01 | 0.2096 |
| 114569 | MAL2 | GSM4909291 | Human | Breast | IDC | 3.32e-21 | 7.62e-01 | 0.1753 |
| 114569 | MAL2 | GSM4909293 | Human | Breast | IDC | 4.91e-35 | 6.97e-01 | 0.1581 |
| 114569 | MAL2 | GSM4909295 | Human | Breast | IDC | 2.38e-02 | 4.38e-01 | 0.0898 |
| 114569 | MAL2 | GSM4909297 | Human | Breast | IDC | 4.41e-15 | 2.79e-01 | 0.1517 |
| 114569 | MAL2 | GSM4909298 | Human | Breast | IDC | 3.00e-05 | 2.40e-01 | 0.1551 |
| 114569 | MAL2 | GSM4909304 | Human | Breast | IDC | 1.59e-18 | 5.37e-01 | 0.1636 |
| 114569 | MAL2 | GSM4909311 | Human | Breast | IDC | 4.04e-24 | -1.35e-01 | 0.1534 |
| 114569 | MAL2 | GSM4909312 | Human | Breast | IDC | 1.23e-15 | 4.78e-01 | 0.1552 |
| 114569 | MAL2 | GSM4909319 | Human | Breast | IDC | 1.70e-25 | -2.28e-01 | 0.1563 |
| 114569 | MAL2 | GSM4909321 | Human | Breast | IDC | 3.01e-09 | -2.50e-01 | 0.1559 |
| 114569 | MAL2 | brca1 | Human | Breast | Precancer | 2.90e-12 | 4.73e-01 | -0.0338 |
| 114569 | MAL2 | brca2 | Human | Breast | Precancer | 1.74e-03 | 1.67e-01 | -0.024 |
| 114569 | MAL2 | brca3 | Human | Breast | Precancer | 1.08e-07 | 3.24e-01 | -0.0263 |
| 114569 | MAL2 | NCCBC14 | Human | Breast | DCIS | 4.24e-08 | 2.59e-01 | 0.2021 |
| 114569 | MAL2 | NCCBC3 | Human | Breast | DCIS | 8.56e-03 | -2.44e-01 | 0.1198 |
| Page: 1 2 3 4 5 6 7 8 9 10 11 |
| Tissue | Expression Dynamics | Abbreviation |
| Breast |  | IDC: Invasive ductal carcinoma |
| DCIS: Ductal carcinoma in situ | ||
| Precancer(BRCA1-mut): Precancerous lesion from BRCA1 mutation carriers | ||
| Cervix |  | CC: Cervix cancer |
| HSIL_HPV: HPV-infected high-grade squamous intraepithelial lesions | ||
| N_HPV: HPV-infected normal cervix | ||
| Esophagus | 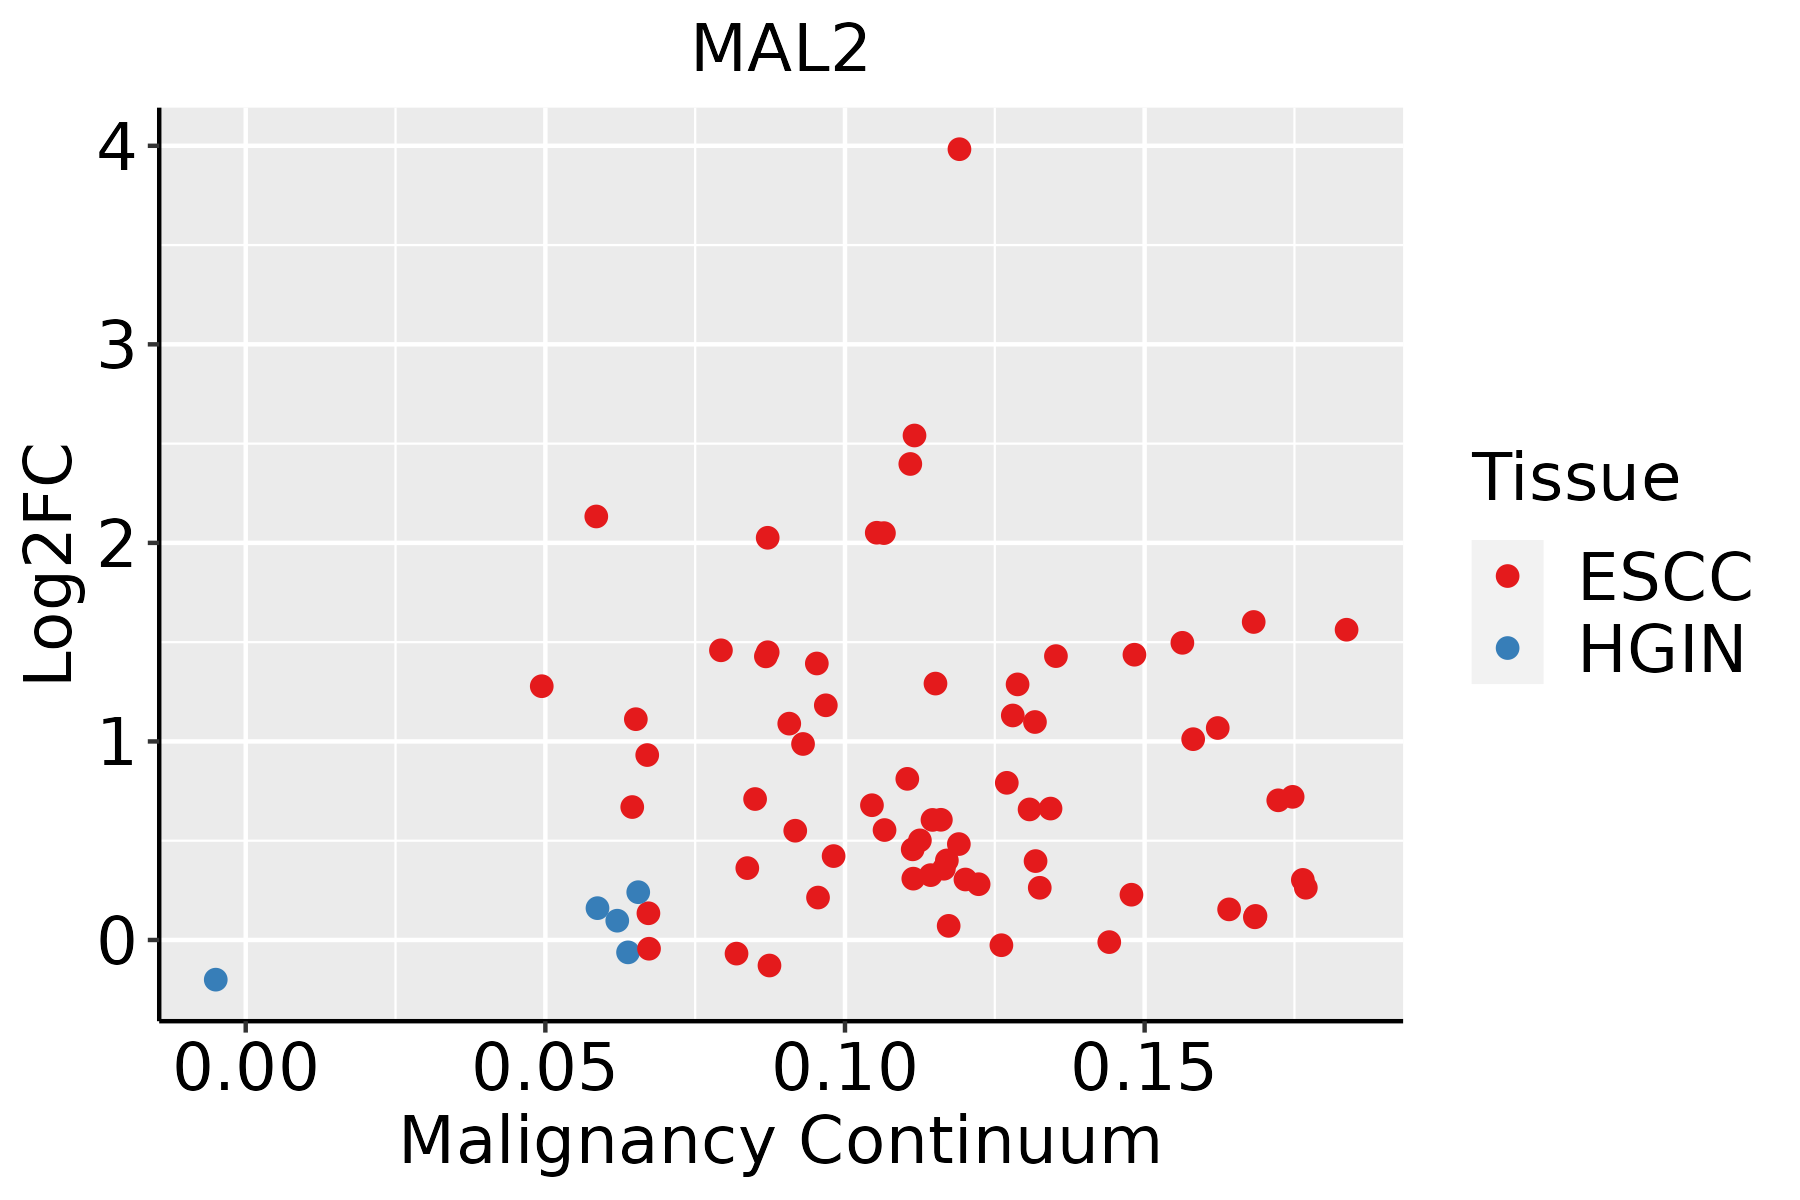 | ESCC: Esophageal squamous cell carcinoma |
| HGIN: High-grade intraepithelial neoplasias | ||
| LGIN: Low-grade intraepithelial neoplasias | ||
| GC | 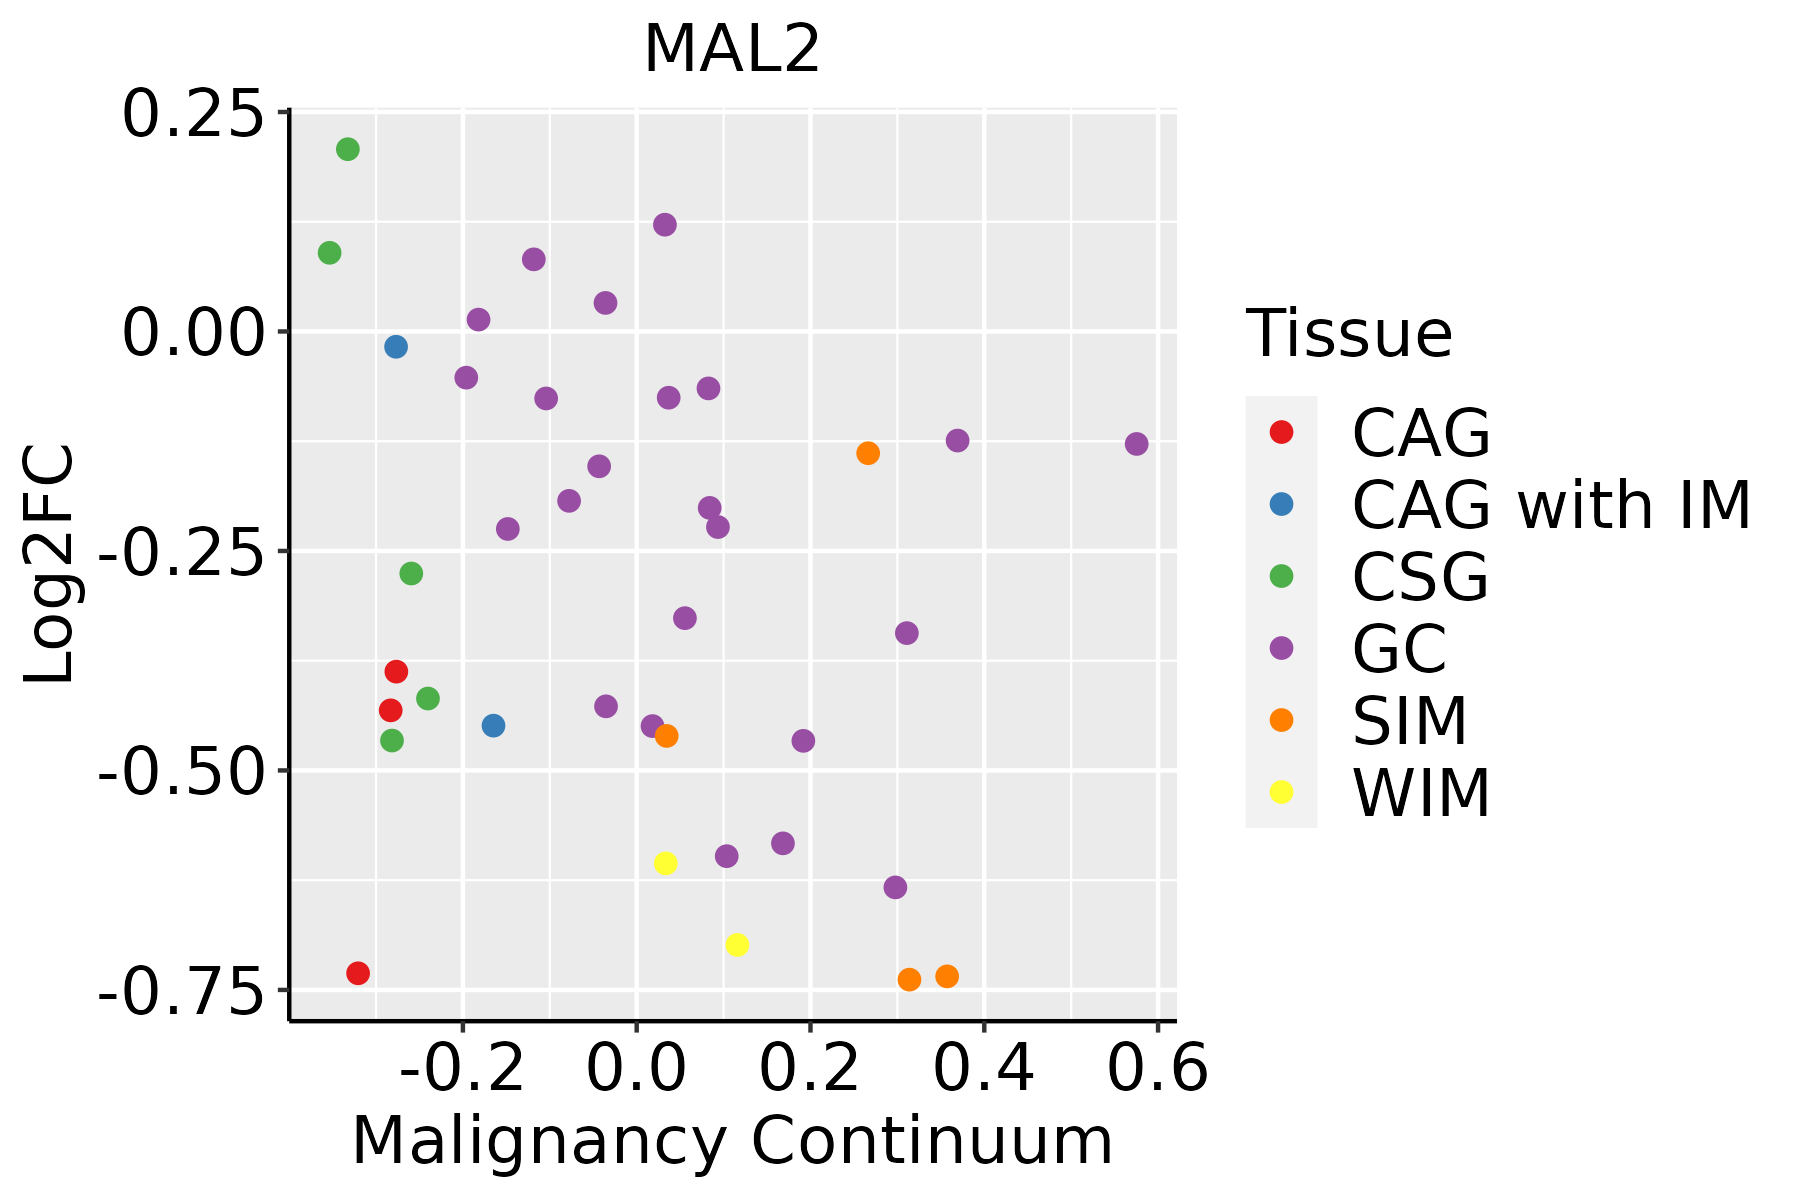 | CAG: Chronic atrophic gastritis |
| CAG with IM: Chronic atrophic gastritis with intestinal metaplasia | ||
| CSG: Chronic superficial gastritis | ||
| GC: Gastric cancer | ||
| SIM: Severe intestinal metaplasia | ||
| WIM: Wild intestinal metaplasia | ||
| Liver |  | HCC: Hepatocellular carcinoma |
| NAFLD: Non-alcoholic fatty liver disease | ||
| Lung |  | AAH: Atypical adenomatous hyperplasia |
| AIS: Adenocarcinoma in situ | ||
| IAC: Invasive lung adenocarcinoma | ||
| MIA: Minimally invasive adenocarcinoma | ||
| Oral Cavity | 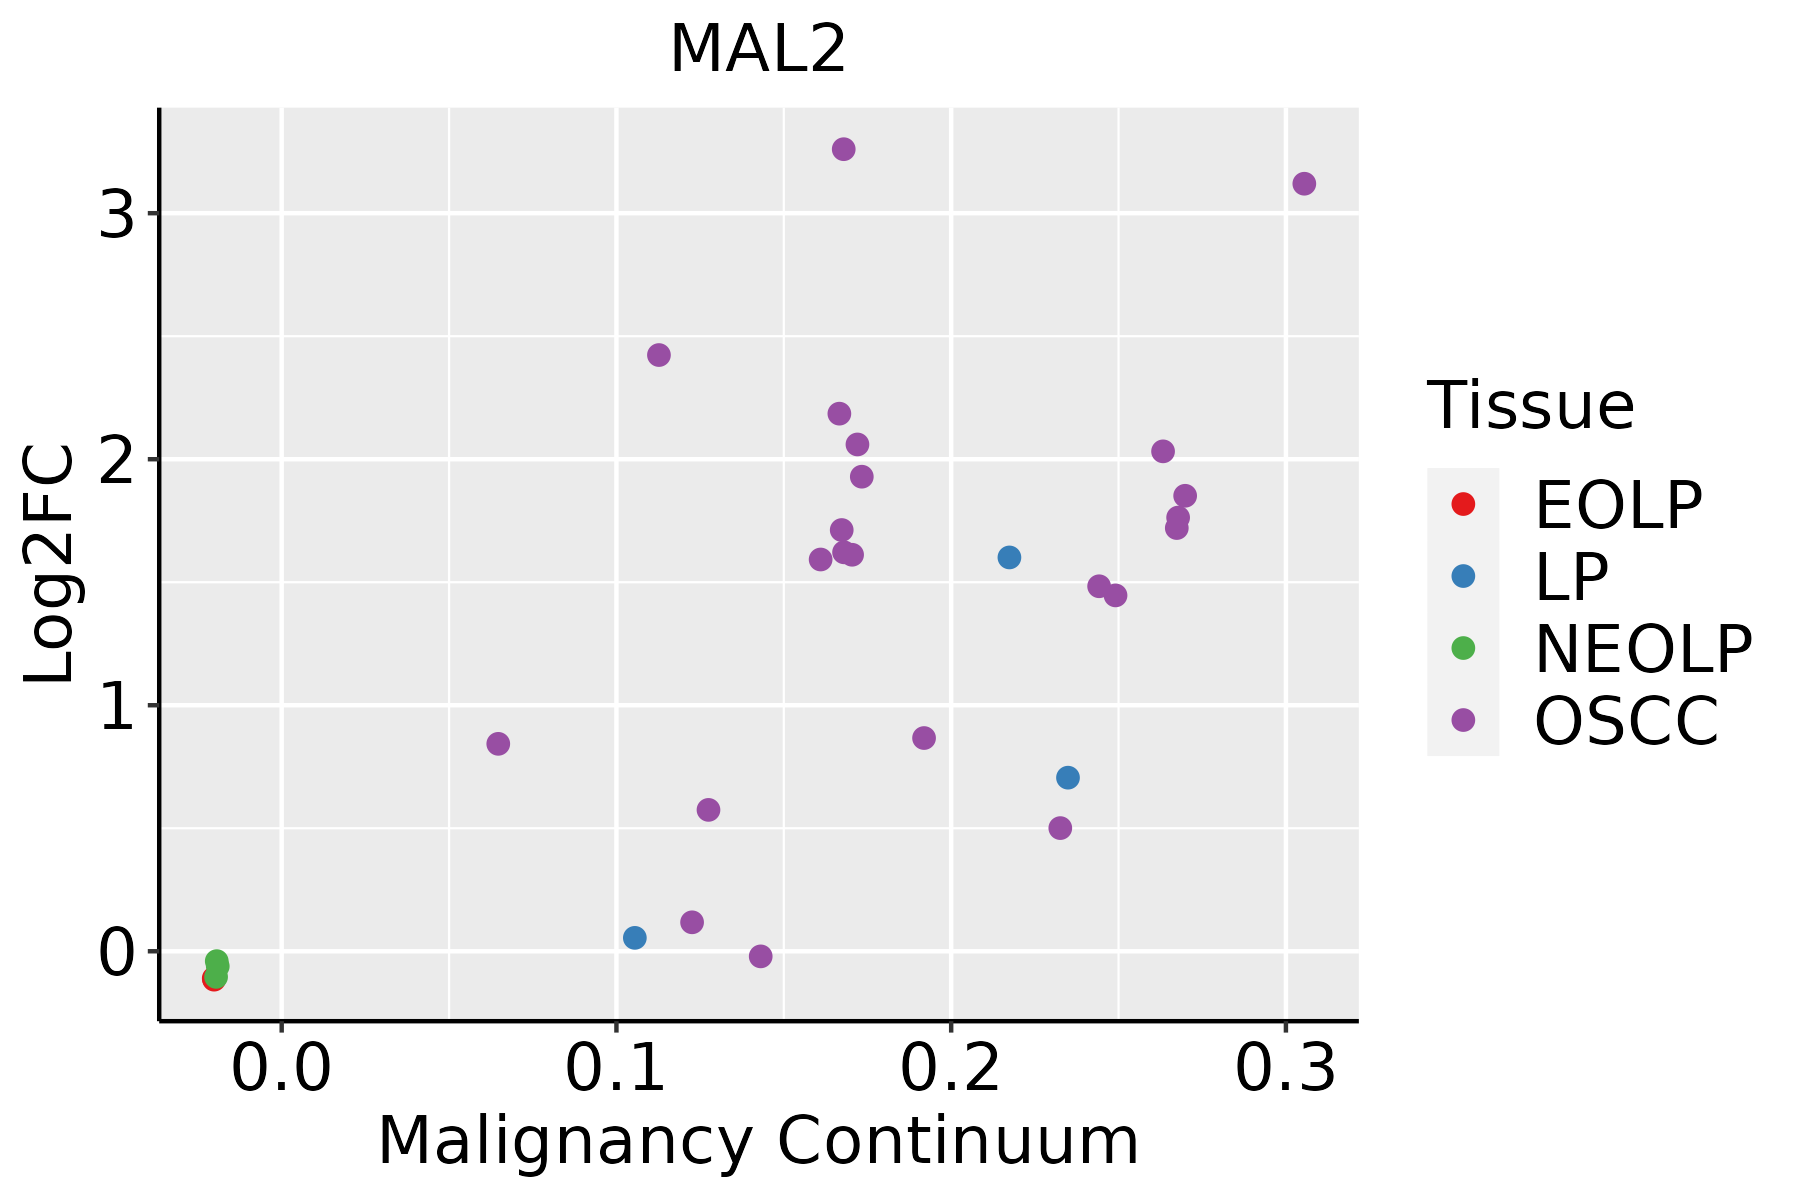 | EOLP: Erosive Oral lichen planus |
| LP: leukoplakia | ||
| NEOLP: Non-erosive oral lichen planus | ||
| OSCC: Oral squamous cell carcinoma | ||
| Prostate | 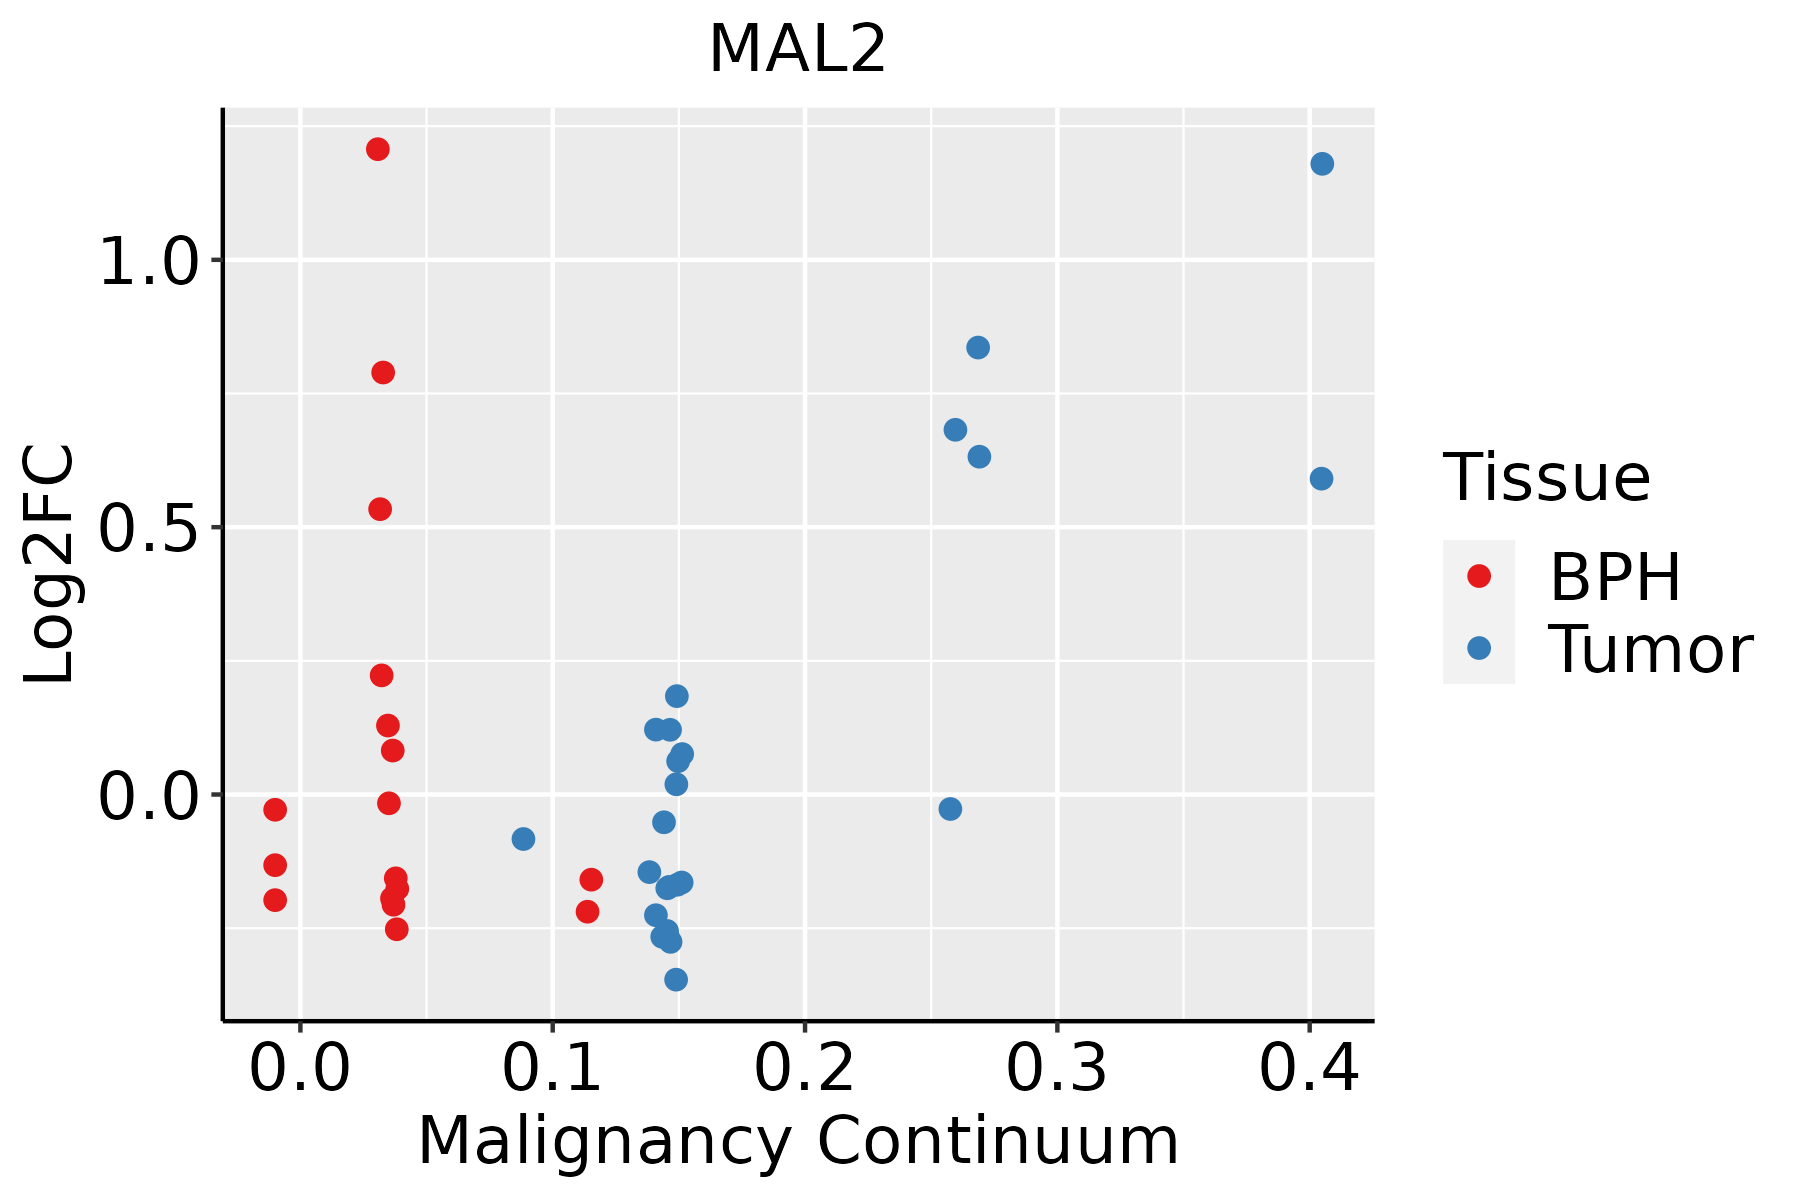 | BPH: Benign Prostatic Hyperplasia |
| Skin | 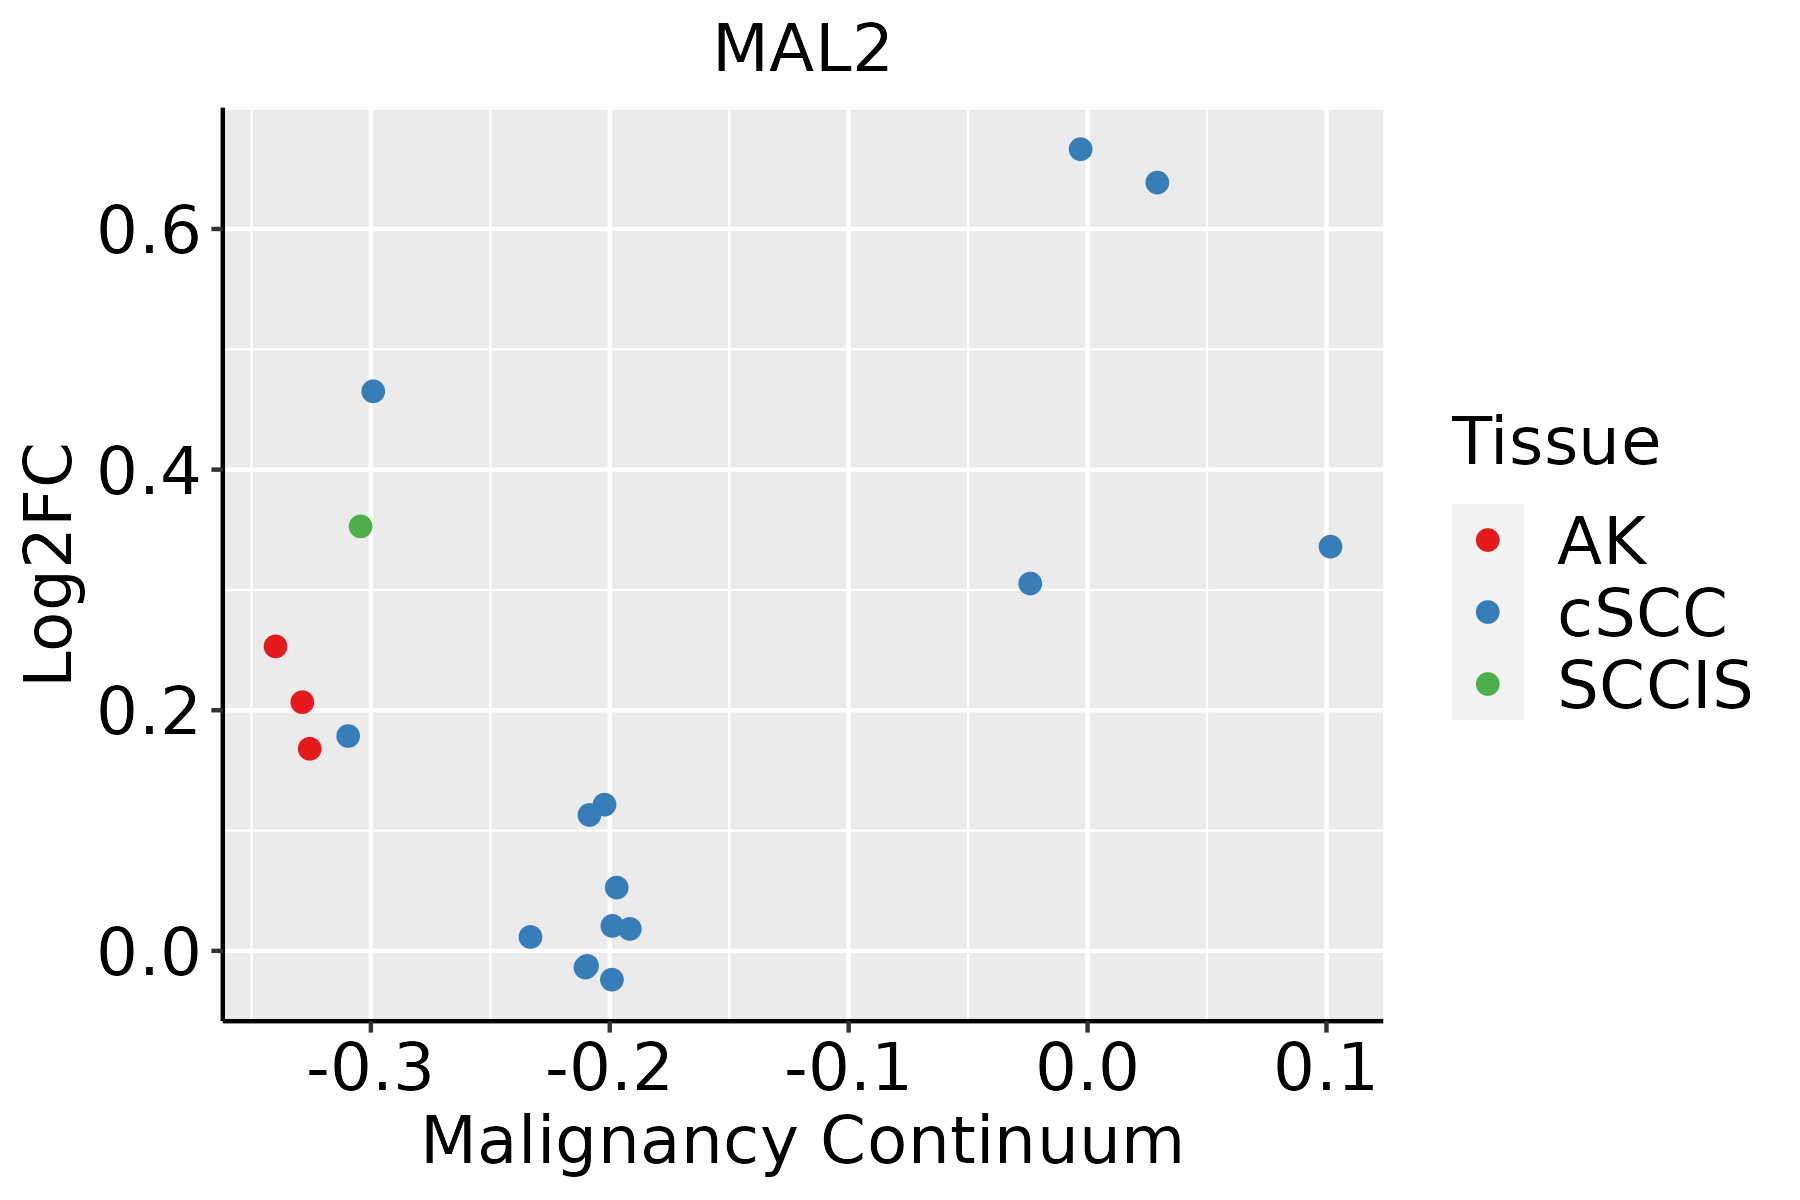 | AK: Actinic keratosis |
| cSCC: Cutaneous squamous cell carcinoma | ||
| SCCIS:squamous cell carcinoma in situ | ||
| Thyroid | 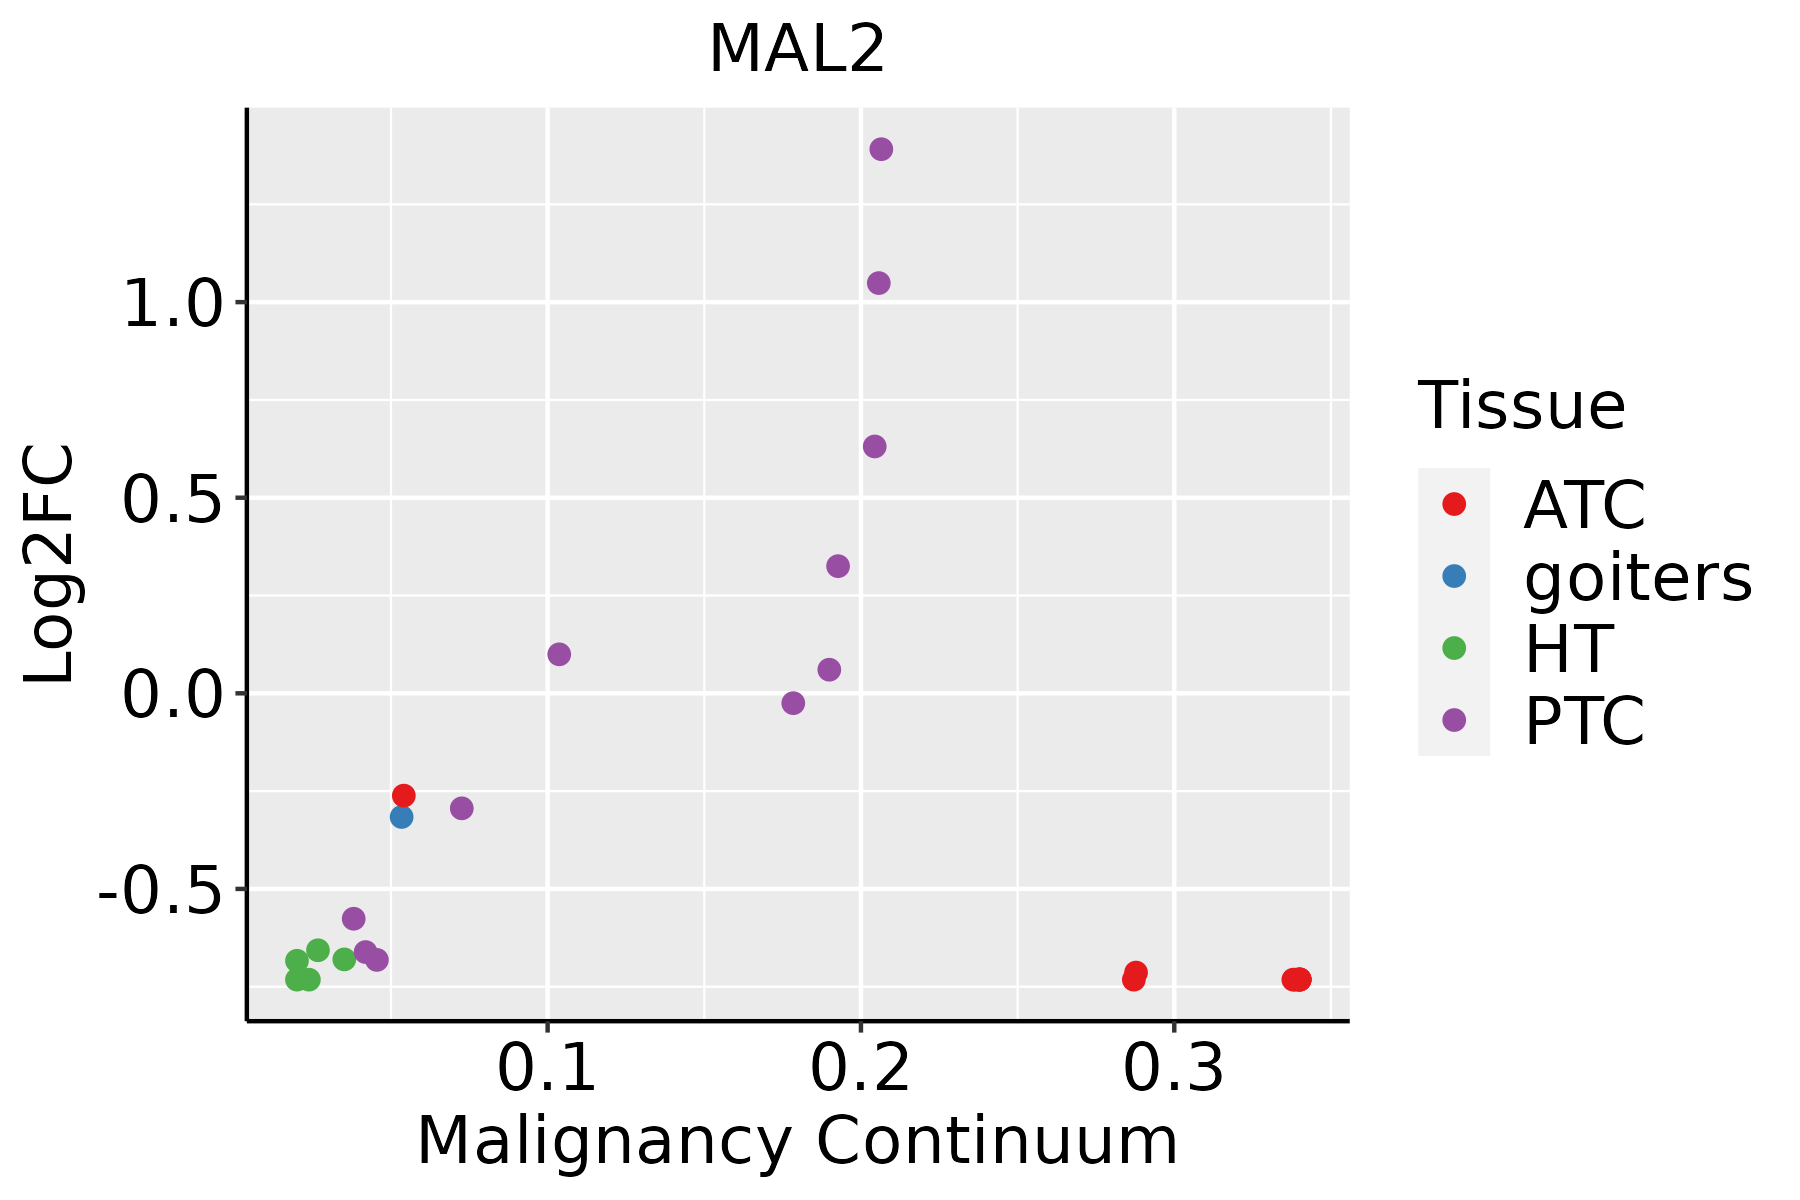 | ATC: Anaplastic thyroid cancer |
| HT: Hashimoto's thyroiditis | ||
| PTC: Papillary thyroid cancer |
| ∗log2FC in expression of this searched gene in stem-like cells from each diseased tissue sample relative to stem-like cells in normal samples in each tissue plotted against the malignancy continuum. Samples are colored based on if they are from different disease stage. |
Top |
Malignant transformation related pathway analysis |
| Find out the enriched GO biological processes and KEGG pathways involved in transition from healthy to precancer to cancer |
| Tissue | Disease Stage | Enriched GO biological Processes |
| Colorectum | AD |  |
| Colorectum | SER |  |
| Colorectum | MSS |  |
| Colorectum | MSI-H |  |
| Colorectum | FAP |  |
| ∗Top 15 enriched GO BP terms are showed in the bar plot of each disease state in each tissue. Each row represents a significant GO biological process which is colored according to the -log10(p.adjust). |
| Page: 1 2 3 4 5 6 7 8 9 |
| GO ID | Tissue | Disease Stage | Description | Gene Ratio | Bg Ratio | pvalue | p.adjust | Count |
| GO:00450565 | Cervix | CC | transcytosis | 7/2311 | 21/18723 | 1.04e-02 | 4.97e-02 | 7 |
| GO:00425524 | Esophagus | ESCC | myelination | 85/8552 | 134/18723 | 2.51e-05 | 2.13e-04 | 85 |
| GO:00072724 | Esophagus | ESCC | ensheathment of neurons | 86/8552 | 136/18723 | 2.68e-05 | 2.24e-04 | 86 |
| GO:00083664 | Esophagus | ESCC | axon ensheathment | 86/8552 | 136/18723 | 2.68e-05 | 2.24e-04 | 86 |
| GO:00450568 | Esophagus | ESCC | transcytosis | 17/8552 | 21/18723 | 1.03e-03 | 5.19e-03 | 17 |
| GO:00450564 | Liver | Cirrhotic | transcytosis | 12/4634 | 21/18723 | 1.53e-03 | 9.98e-03 | 12 |
| GO:0042552 | Liver | Cirrhotic | myelination | 46/4634 | 134/18723 | 8.04e-03 | 3.77e-02 | 46 |
| GO:0007272 | Liver | Cirrhotic | ensheathment of neurons | 46/4634 | 136/18723 | 1.08e-02 | 4.75e-02 | 46 |
| GO:0008366 | Liver | Cirrhotic | axon ensheathment | 46/4634 | 136/18723 | 1.08e-02 | 4.75e-02 | 46 |
| GO:004505611 | Liver | HCC | transcytosis | 15/7958 | 21/18723 | 7.03e-03 | 2.80e-02 | 15 |
| GO:00072721 | Liver | HCC | ensheathment of neurons | 72/7958 | 136/18723 | 8.87e-03 | 3.44e-02 | 72 |
| GO:00083661 | Liver | HCC | axon ensheathment | 72/7958 | 136/18723 | 8.87e-03 | 3.44e-02 | 72 |
| GO:00425521 | Liver | HCC | myelination | 71/7958 | 134/18723 | 9.08e-03 | 3.49e-02 | 71 |
| GO:00450567 | Oral cavity | OSCC | transcytosis | 16/7305 | 21/18723 | 5.99e-04 | 3.39e-03 | 16 |
| GO:00072723 | Oral cavity | OSCC | ensheathment of neurons | 72/7305 | 136/18723 | 6.59e-04 | 3.70e-03 | 72 |
| GO:00083663 | Oral cavity | OSCC | axon ensheathment | 72/7305 | 136/18723 | 6.59e-04 | 3.70e-03 | 72 |
| GO:00425523 | Oral cavity | OSCC | myelination | 71/7305 | 134/18723 | 6.93e-04 | 3.86e-03 | 71 |
| GO:004505613 | Oral cavity | LP | transcytosis | 11/4623 | 21/18723 | 5.78e-03 | 3.44e-02 | 11 |
| GO:00450566 | Prostate | BPH | transcytosis | 10/3107 | 21/18723 | 9.32e-04 | 5.91e-03 | 10 |
| GO:004505612 | Prostate | Tumor | transcytosis | 10/3246 | 21/18723 | 1.33e-03 | 8.31e-03 | 10 |
| Page: 1 2 |
| Pathway ID | Tissue | Disease Stage | Description | Gene Ratio | Bg Ratio | pvalue | p.adjust | qvalue | Count |
| Page: 1 |
Top |
Cell-cell communication analysis |
| Identification of potential cell-cell interactions between two cell types and their ligand-receptor pairs for different disease states |
| Ligand | Receptor | LRpair | Pathway | Tissue | Disease Stage |
| Page: 1 |
Top |
Single-cell gene regulatory network inference analysis |
| Find out the significant the regulons (TFs) and the target genes of each regulon across cell types for different disease states |
| TF | Cell Type | Tissue | Disease Stage | Target Gene | RSS | Regulon Activity |
| ∗The dot plots of a searched regulon are shown for all cell subpopulations in each disease state of each tissue based on the regulon specific score inferred using pySCENIC and by calculating the average expression. |
| Page: 1 |
Top |
Somatic mutation of malignant transformation related genes |
| Annotation of somatic variants for genes involved in malignant transformation |
| Hugo Symbol | Variant Class | Variant Classification | dbSNP RS | HGVSc | HGVSp | HGVSp Short | SWISSPROT | BIOTYPE | SIFT | PolyPhen | Tumor Sample Barcode | Tissue | Histology | Sex | Age | Stage | Therapy Types | Drugs | Outcome |
| MAL2 | SNV | Missense_Mutation | novel | c.181C>G | p.Leu61Val | p.L61V | Q969L2 | protein_coding | tolerated(0.68) | benign(0.248) | TCGA-AR-A250-01 | Breast | breast invasive carcinoma | Female | <65 | I/II | Chemotherapy | doxorubicin | SD |
| MAL2 | deletion | Frame_Shift_Del | novel | c.158delT | p.Leu53TrpfsTer21 | p.L53Wfs*21 | Q969L2 | protein_coding | TCGA-EW-A2FV-01 | Breast | breast invasive carcinoma | Female | <65 | III/IV | Chemotherapy | docetaxel | SD | ||
| MAL2 | SNV | Missense_Mutation | novel | c.182N>C | p.Leu61Pro | p.L61P | Q969L2 | protein_coding | tolerated(0.1) | probably_damaging(0.993) | TCGA-AA-3663-01 | Colorectum | colon adenocarcinoma | Male | <65 | I/II | Unknown | Unknown | SD |
| MAL2 | SNV | Missense_Mutation | novel | c.220N>T | p.Thr74Ser | p.T74S | Q969L2 | protein_coding | tolerated(0.17) | benign(0.171) | TCGA-CA-6717-01 | Colorectum | colon adenocarcinoma | Male | <65 | I/II | Chemotherapy | oxaliplatin | CR |
| MAL2 | SNV | Missense_Mutation | novel | c.407N>T | p.Thr136Ile | p.T136I | Q969L2 | protein_coding | tolerated(0.25) | benign(0.025) | TCGA-AP-A1E0-01 | Endometrium | uterine corpus endometrioid carcinoma | Female | <65 | III/IV | Chemotherapy | paclitaxel | SD |
| MAL2 | SNV | Missense_Mutation | novel | c.281N>A | p.Ile94Asn | p.I94N | Q969L2 | protein_coding | tolerated(0.08) | probably_damaging(0.998) | TCGA-AX-A3FS-01 | Endometrium | uterine corpus endometrioid carcinoma | Female | >=65 | I/II | Unknown | Unknown | SD |
| MAL2 | SNV | Missense_Mutation | novel | c.406N>C | p.Thr136Pro | p.T136P | Q969L2 | protein_coding | tolerated(0.17) | benign(0.114) | TCGA-B5-A0JR-01 | Endometrium | uterine corpus endometrioid carcinoma | Female | >=65 | I/II | Unknown | Unknown | SD |
| MAL2 | SNV | Missense_Mutation | novel | c.472A>G | p.Met158Val | p.M158V | Q969L2 | protein_coding | tolerated(1) | benign(0) | TCGA-DI-A1BU-01 | Endometrium | uterine corpus endometrioid carcinoma | Female | <65 | I/II | Chemotherapy | paclitaxel | SD |
| MAL2 | SNV | Missense_Mutation | novel | c.153N>T | p.Trp51Cys | p.W51C | Q969L2 | protein_coding | deleterious(0) | probably_damaging(0.999) | TCGA-69-7979-01 | Lung | lung adenocarcinoma | Female | >=65 | I/II | Unknown | Unknown | SD |
| MAL2 | SNV | Missense_Mutation | rs749996607 | c.374N>G | p.Ser125Cys | p.S125C | Q969L2 | protein_coding | tolerated(0.06) | probably_damaging(0.954) | TCGA-34-5928-01 | Lung | lung squamous cell carcinoma | Female | >=65 | I/II | Unknown | Unknown | SD |
| Page: 1 2 |
Top |
Related drugs of malignant transformation related genes |
| Identification of chemicals and drugs interact with genes involved in malignant transfromation |
| (DGIdb 4.0) |
| Entrez ID | Symbol | Category | Interaction Types | Drug Claim Name | Drug Name | PMIDs |
| Page: 1 |

Copyright 2023-Present -The University of Texas Health Science Center at Houston |