
|
|||||
|
 | |
| |
| |
| |
| |
| |
|
Gene: MAGOHB |
Gene summary for MAGOHB |
| Gene information | Species | Human | Gene symbol | MAGOHB | Gene ID | 55110 |
| Gene name | mago homolog B, exon junction complex subunit | |
| Gene Alias | MGN2 | |
| Cytomap | 12p13.2 | |
| Gene Type | protein-coding | GO ID | GO:0000184 | UniProtAcc | F5H6P7 |
Top |
Malignant transformation analysis |
| Identification of the aberrant gene expression in precancerous and cancerous lesions by comparing the gene expression of stem-like cells in diseased tissues with normal stem cells |
| Entrez ID | Symbol | Replicates | Species | Organ | Tissue | Adj P-value | Log2FC | Malignancy |
| 55110 | MAGOHB | LZE4T | Human | Esophagus | ESCC | 2.28e-13 | 3.73e-01 | 0.0811 |
| 55110 | MAGOHB | LZE7T | Human | Esophagus | ESCC | 1.15e-12 | 6.98e-01 | 0.0667 |
| 55110 | MAGOHB | LZE8T | Human | Esophagus | ESCC | 4.09e-09 | 4.66e-01 | 0.067 |
| 55110 | MAGOHB | LZE20T | Human | Esophagus | ESCC | 3.81e-08 | 3.42e-01 | 0.0662 |
| 55110 | MAGOHB | LZE22D1 | Human | Esophagus | HGIN | 1.35e-03 | 1.25e-01 | 0.0595 |
| 55110 | MAGOHB | LZE22T | Human | Esophagus | ESCC | 2.26e-07 | 4.39e-01 | 0.068 |
| 55110 | MAGOHB | LZE24T | Human | Esophagus | ESCC | 6.55e-14 | 3.21e-01 | 0.0596 |
| 55110 | MAGOHB | LZE6T | Human | Esophagus | ESCC | 7.78e-10 | 3.75e-01 | 0.0845 |
| 55110 | MAGOHB | P1T-E | Human | Esophagus | ESCC | 3.26e-05 | 2.37e-01 | 0.0875 |
| 55110 | MAGOHB | P2T-E | Human | Esophagus | ESCC | 2.75e-30 | 6.83e-01 | 0.1177 |
| 55110 | MAGOHB | P4T-E | Human | Esophagus | ESCC | 2.97e-54 | 1.20e+00 | 0.1323 |
| 55110 | MAGOHB | P5T-E | Human | Esophagus | ESCC | 1.80e-33 | 6.83e-01 | 0.1327 |
| 55110 | MAGOHB | P8T-E | Human | Esophagus | ESCC | 2.80e-25 | 4.71e-01 | 0.0889 |
| 55110 | MAGOHB | P9T-E | Human | Esophagus | ESCC | 5.16e-23 | 4.66e-01 | 0.1131 |
| 55110 | MAGOHB | P10T-E | Human | Esophagus | ESCC | 7.18e-36 | 5.95e-01 | 0.116 |
| 55110 | MAGOHB | P11T-E | Human | Esophagus | ESCC | 6.39e-15 | 3.26e-01 | 0.1426 |
| 55110 | MAGOHB | P12T-E | Human | Esophagus | ESCC | 1.04e-50 | 1.01e+00 | 0.1122 |
| 55110 | MAGOHB | P15T-E | Human | Esophagus | ESCC | 3.56e-21 | 3.82e-01 | 0.1149 |
| 55110 | MAGOHB | P16T-E | Human | Esophagus | ESCC | 8.59e-77 | 1.78e+00 | 0.1153 |
| 55110 | MAGOHB | P17T-E | Human | Esophagus | ESCC | 9.89e-15 | 4.97e-01 | 0.1278 |
| Page: 1 2 3 4 5 6 |
| Tissue | Expression Dynamics | Abbreviation |
| Esophagus | 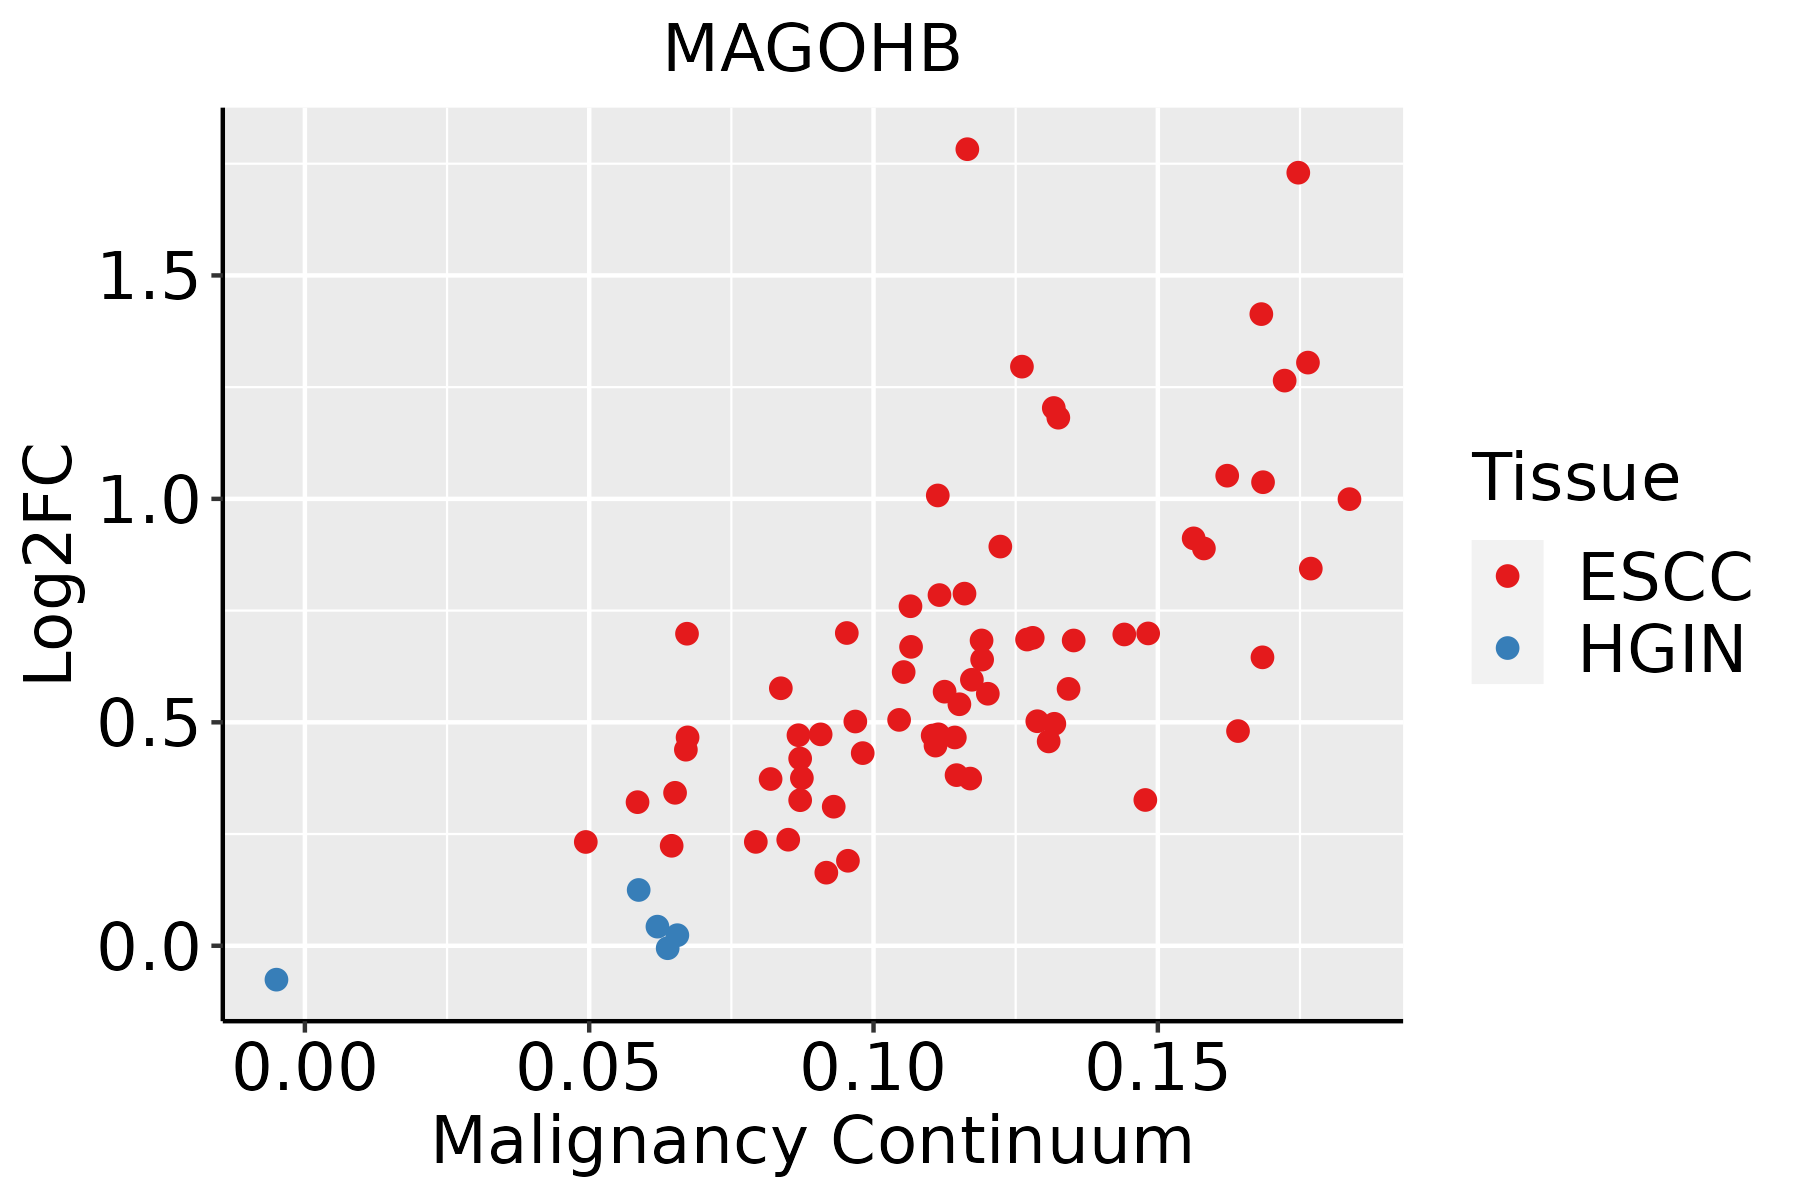 | ESCC: Esophageal squamous cell carcinoma |
| HGIN: High-grade intraepithelial neoplasias | ||
| LGIN: Low-grade intraepithelial neoplasias | ||
| Liver | 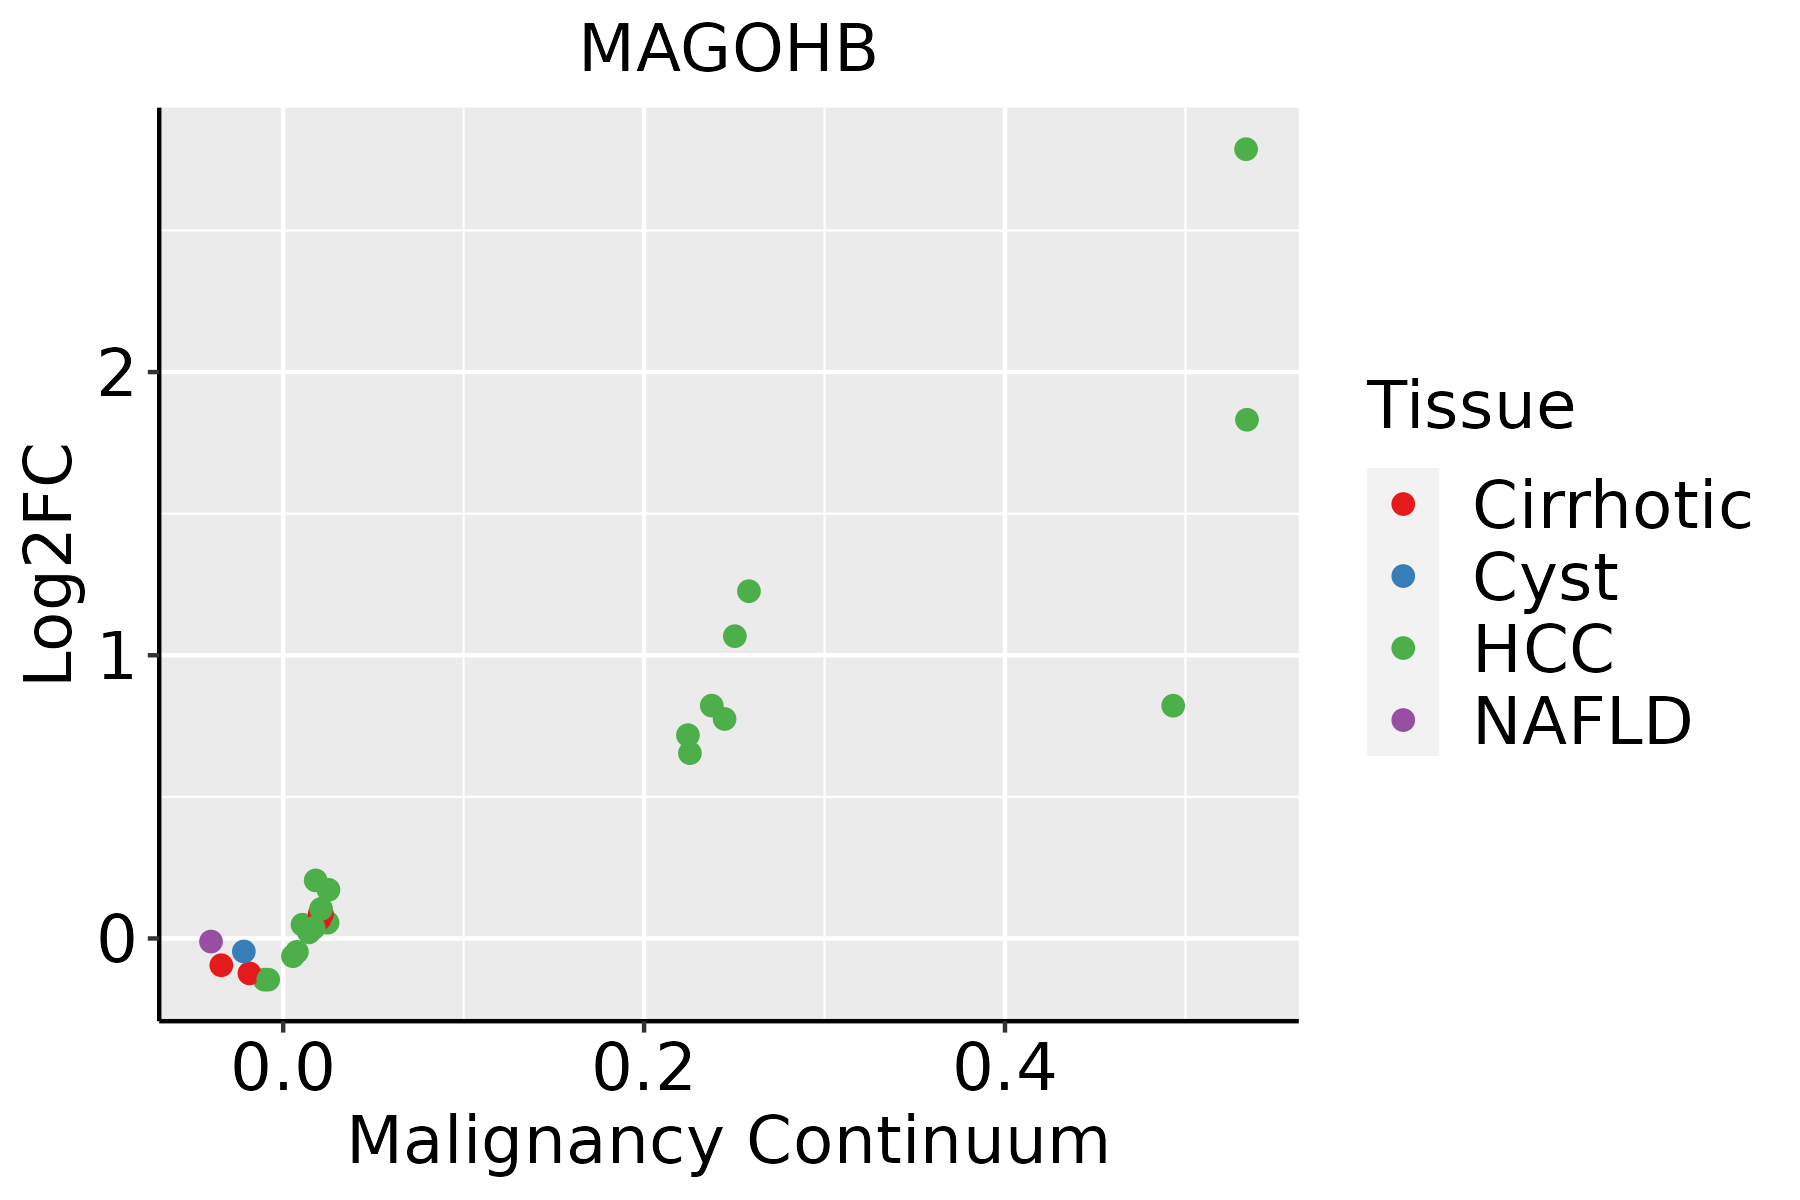 | HCC: Hepatocellular carcinoma |
| NAFLD: Non-alcoholic fatty liver disease | ||
| Oral Cavity |  | EOLP: Erosive Oral lichen planus |
| LP: leukoplakia | ||
| NEOLP: Non-erosive oral lichen planus | ||
| OSCC: Oral squamous cell carcinoma | ||
| Skin |  | AK: Actinic keratosis |
| cSCC: Cutaneous squamous cell carcinoma | ||
| SCCIS:squamous cell carcinoma in situ | ||
| Thyroid | 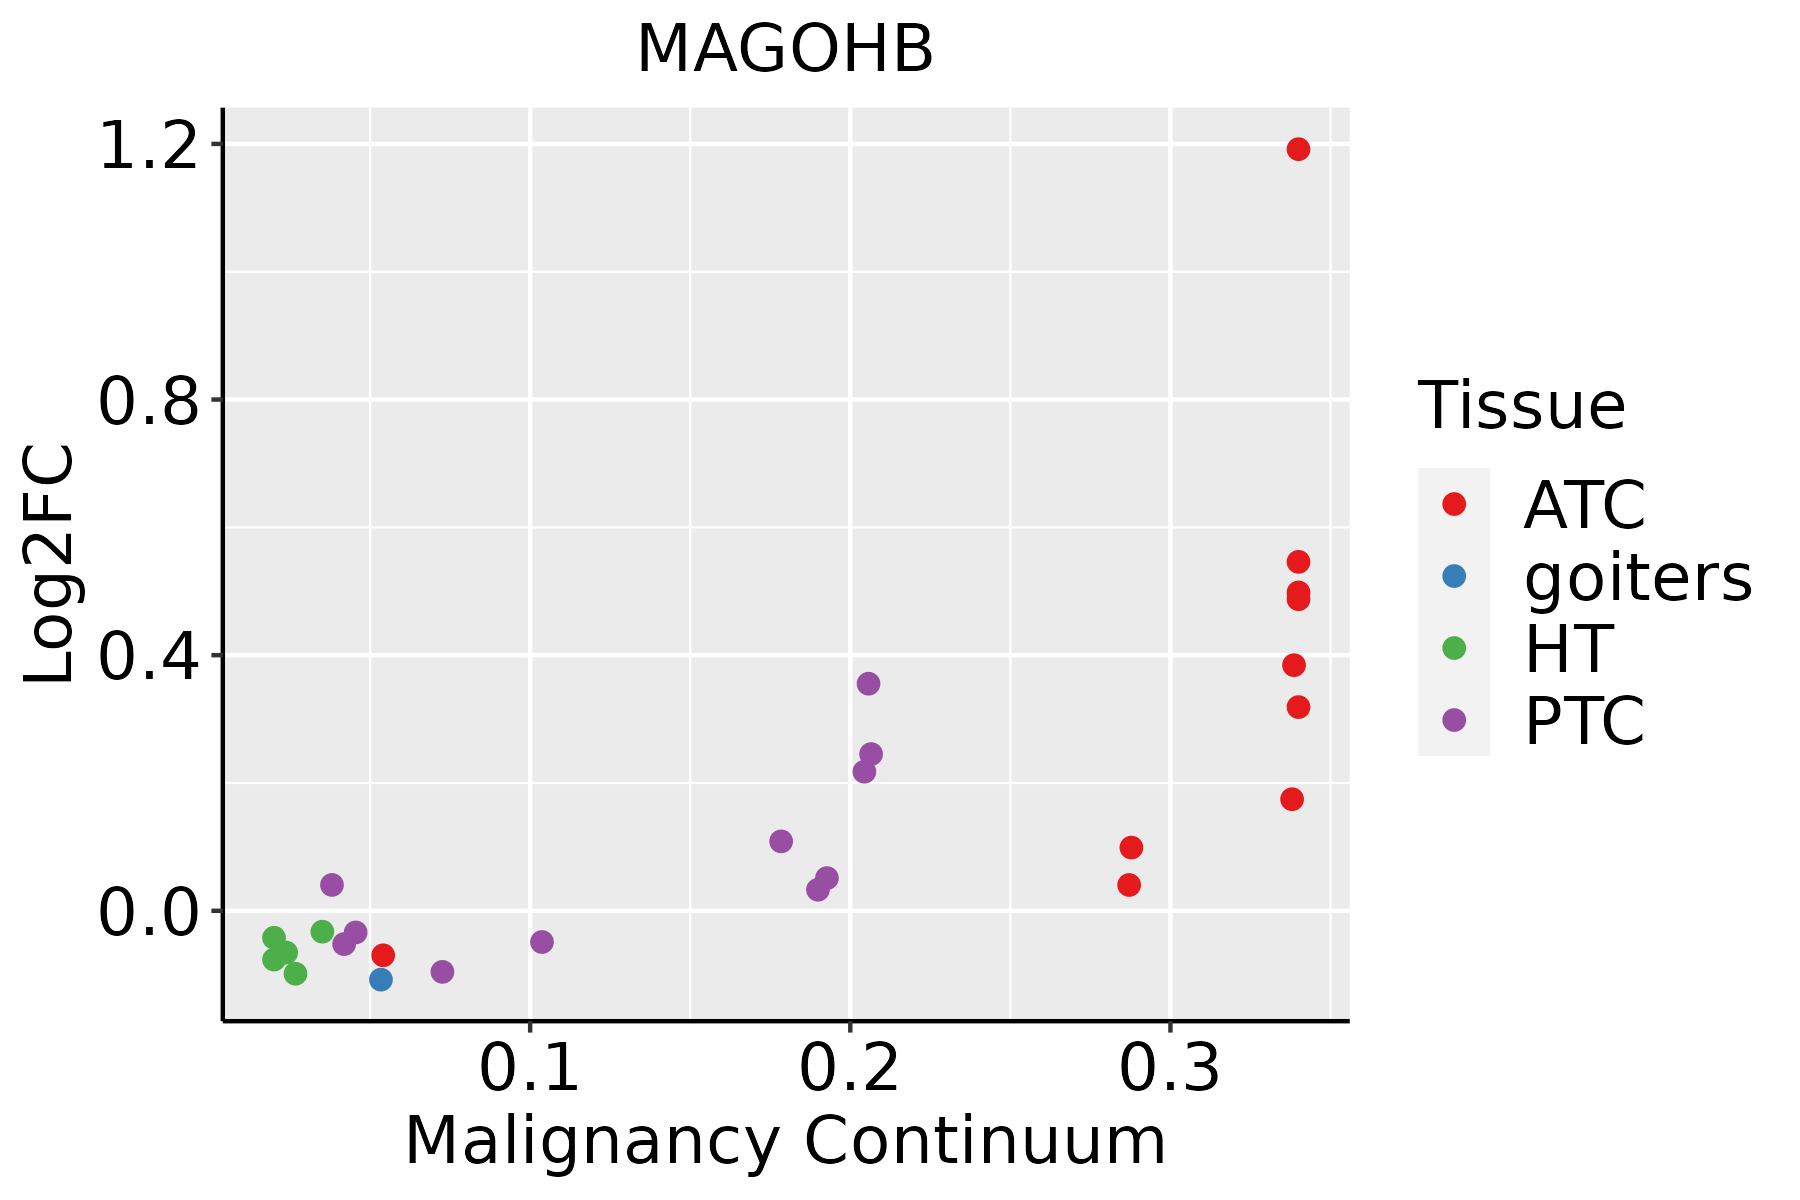 | ATC: Anaplastic thyroid cancer |
| HT: Hashimoto's thyroiditis | ||
| PTC: Papillary thyroid cancer |
| ∗log2FC in expression of this searched gene in stem-like cells from each diseased tissue sample relative to stem-like cells in normal samples in each tissue plotted against the malignancy continuum. Samples are colored based on if they are from different disease stage. |
Top |
Malignant transformation related pathway analysis |
| Find out the enriched GO biological processes and KEGG pathways involved in transition from healthy to precancer to cancer |
| Tissue | Disease Stage | Enriched GO biological Processes |
| Colorectum | AD |  |
| Colorectum | SER |  |
| Colorectum | MSS |  |
| Colorectum | MSI-H |  |
| Colorectum | FAP |  |
| ∗Top 15 enriched GO BP terms are showed in the bar plot of each disease state in each tissue. Each row represents a significant GO biological process which is colored according to the -log10(p.adjust). |
| Page: 1 2 3 4 5 6 7 8 9 |
| GO ID | Tissue | Disease Stage | Description | Gene Ratio | Bg Ratio | pvalue | p.adjust | Count |
| GO:000838026 | Esophagus | HGIN | RNA splicing | 160/2587 | 434/18723 | 3.74e-34 | 1.12e-30 | 160 |
| GO:000037520 | Esophagus | HGIN | RNA splicing, via transesterification reactions | 115/2587 | 324/18723 | 3.16e-23 | 3.80e-20 | 115 |
| GO:000037720 | Esophagus | HGIN | RNA splicing, via transesterification reactions with bulged adenosine as nucleophile | 113/2587 | 320/18723 | 1.24e-22 | 9.26e-20 | 113 |
| GO:000039820 | Esophagus | HGIN | mRNA splicing, via spliceosome | 113/2587 | 320/18723 | 1.24e-22 | 9.26e-20 | 113 |
| GO:000640320 | Esophagus | HGIN | RNA localization | 66/2587 | 201/18723 | 4.06e-12 | 5.41e-10 | 66 |
| GO:000640120 | Esophagus | HGIN | RNA catabolic process | 77/2587 | 278/18723 | 7.63e-10 | 6.36e-08 | 77 |
| GO:000640220 | Esophagus | HGIN | mRNA catabolic process | 67/2587 | 232/18723 | 1.47e-09 | 1.13e-07 | 67 |
| GO:000095617 | Esophagus | HGIN | nuclear-transcribed mRNA catabolic process | 40/2587 | 112/18723 | 4.44e-09 | 3.03e-07 | 40 |
| GO:003465519 | Esophagus | HGIN | nucleobase-containing compound catabolic process | 98/2587 | 407/18723 | 1.44e-08 | 8.94e-07 | 98 |
| GO:004670017 | Esophagus | HGIN | heterocycle catabolic process | 103/2587 | 445/18723 | 5.44e-08 | 2.99e-06 | 103 |
| GO:005065716 | Esophagus | HGIN | nucleic acid transport | 49/2587 | 163/18723 | 5.71e-08 | 3.06e-06 | 49 |
| GO:005065816 | Esophagus | HGIN | RNA transport | 49/2587 | 163/18723 | 5.71e-08 | 3.06e-06 | 49 |
| GO:005123616 | Esophagus | HGIN | establishment of RNA localization | 49/2587 | 166/18723 | 1.07e-07 | 5.47e-06 | 49 |
| GO:004427018 | Esophagus | HGIN | cellular nitrogen compound catabolic process | 103/2587 | 451/18723 | 1.10e-07 | 5.56e-06 | 103 |
| GO:001943917 | Esophagus | HGIN | aromatic compound catabolic process | 105/2587 | 467/18723 | 1.89e-07 | 9.31e-06 | 105 |
| GO:00510288 | Esophagus | HGIN | mRNA transport | 40/2587 | 130/18723 | 4.67e-07 | 2.07e-05 | 40 |
| GO:001593116 | Esophagus | HGIN | nucleobase-containing compound transport | 57/2587 | 222/18723 | 1.76e-06 | 6.52e-05 | 57 |
| GO:190136117 | Esophagus | HGIN | organic cyclic compound catabolic process | 106/2587 | 495/18723 | 1.94e-06 | 7.13e-05 | 106 |
| GO:00001846 | Esophagus | HGIN | nuclear-transcribed mRNA catabolic process, nonsense-mediated decay | 15/2587 | 37/18723 | 5.66e-05 | 1.33e-03 | 15 |
| GO:0008380111 | Esophagus | ESCC | RNA splicing | 336/8552 | 434/18723 | 1.74e-42 | 3.67e-39 | 336 |
| Page: 1 2 3 4 5 6 7 8 9 |
| Pathway ID | Tissue | Disease Stage | Description | Gene Ratio | Bg Ratio | pvalue | p.adjust | qvalue | Count |
| hsa0304018 | Esophagus | HGIN | Spliceosome | 79/1383 | 217/8465 | 3.22e-13 | 7.00e-12 | 5.56e-12 | 79 |
| hsa030159 | Esophagus | HGIN | mRNA surveillance pathway | 30/1383 | 97/8465 | 2.48e-04 | 2.69e-03 | 2.14e-03 | 30 |
| hsa030137 | Esophagus | HGIN | Nucleocytoplasmic transport | 31/1383 | 108/8465 | 8.29e-04 | 7.95e-03 | 6.31e-03 | 31 |
| hsa0304019 | Esophagus | HGIN | Spliceosome | 79/1383 | 217/8465 | 3.22e-13 | 7.00e-12 | 5.56e-12 | 79 |
| hsa0301514 | Esophagus | HGIN | mRNA surveillance pathway | 30/1383 | 97/8465 | 2.48e-04 | 2.69e-03 | 2.14e-03 | 30 |
| hsa0301312 | Esophagus | HGIN | Nucleocytoplasmic transport | 31/1383 | 108/8465 | 8.29e-04 | 7.95e-03 | 6.31e-03 | 31 |
| hsa0301321 | Esophagus | ESCC | Nucleocytoplasmic transport | 89/4205 | 108/8465 | 1.20e-12 | 2.37e-11 | 1.21e-11 | 89 |
| hsa0301524 | Esophagus | ESCC | mRNA surveillance pathway | 72/4205 | 97/8465 | 6.12e-07 | 4.10e-06 | 2.10e-06 | 72 |
| hsa0304027 | Esophagus | ESCC | Spliceosome | 128/4205 | 217/8465 | 3.31e-03 | 8.79e-03 | 4.50e-03 | 128 |
| hsa0301331 | Esophagus | ESCC | Nucleocytoplasmic transport | 89/4205 | 108/8465 | 1.20e-12 | 2.37e-11 | 1.21e-11 | 89 |
| hsa0301534 | Esophagus | ESCC | mRNA surveillance pathway | 72/4205 | 97/8465 | 6.12e-07 | 4.10e-06 | 2.10e-06 | 72 |
| hsa0304037 | Esophagus | ESCC | Spliceosome | 128/4205 | 217/8465 | 3.31e-03 | 8.79e-03 | 4.50e-03 | 128 |
| hsa030407 | Liver | Cirrhotic | Spliceosome | 102/2530 | 217/8465 | 5.69e-08 | 9.47e-07 | 5.84e-07 | 102 |
| hsa030154 | Liver | Cirrhotic | mRNA surveillance pathway | 46/2530 | 97/8465 | 1.92e-04 | 1.30e-03 | 8.03e-04 | 46 |
| hsa0304012 | Liver | Cirrhotic | Spliceosome | 102/2530 | 217/8465 | 5.69e-08 | 9.47e-07 | 5.84e-07 | 102 |
| hsa0301511 | Liver | Cirrhotic | mRNA surveillance pathway | 46/2530 | 97/8465 | 1.92e-04 | 1.30e-03 | 8.03e-04 | 46 |
| hsa03013 | Liver | HCC | Nucleocytoplasmic transport | 81/4020 | 108/8465 | 4.28e-09 | 6.83e-08 | 3.80e-08 | 81 |
| hsa0301521 | Liver | HCC | mRNA surveillance pathway | 66/4020 | 97/8465 | 3.16e-05 | 1.88e-04 | 1.04e-04 | 66 |
| hsa0304022 | Liver | HCC | Spliceosome | 122/4020 | 217/8465 | 5.55e-03 | 1.60e-02 | 8.91e-03 | 122 |
| hsa030131 | Liver | HCC | Nucleocytoplasmic transport | 81/4020 | 108/8465 | 4.28e-09 | 6.83e-08 | 3.80e-08 | 81 |
| Page: 1 2 |
Top |
Cell-cell communication analysis |
| Identification of potential cell-cell interactions between two cell types and their ligand-receptor pairs for different disease states |
| Ligand | Receptor | LRpair | Pathway | Tissue | Disease Stage |
| Page: 1 |
Top |
Single-cell gene regulatory network inference analysis |
| Find out the significant the regulons (TFs) and the target genes of each regulon across cell types for different disease states |
| TF | Cell Type | Tissue | Disease Stage | Target Gene | RSS | Regulon Activity |
| ∗The dot plots of a searched regulon are shown for all cell subpopulations in each disease state of each tissue based on the regulon specific score inferred using pySCENIC and by calculating the average expression. |
| Page: 1 |
Top |
Somatic mutation of malignant transformation related genes |
| Annotation of somatic variants for genes involved in malignant transformation |
| Hugo Symbol | Variant Class | Variant Classification | dbSNP RS | HGVSc | HGVSp | HGVSp Short | SWISSPROT | BIOTYPE | SIFT | PolyPhen | Tumor Sample Barcode | Tissue | Histology | Sex | Age | Stage | Therapy Types | Drugs | Outcome |
| MAGOHB | SNV | Missense_Mutation | c.323N>A | p.Ser108Tyr | p.S108Y | Q96A72 | protein_coding | deleterious(0.03) | probably_damaging(0.998) | TCGA-AN-A046-01 | Breast | breast invasive carcinoma | Female | >=65 | I/II | Unknown | Unknown | SD | |
| MAGOHB | SNV | Missense_Mutation | rs754343052 | c.226N>A | p.Asp76Asn | p.D76N | Q96A72 | protein_coding | deleterious(0) | probably_damaging(0.978) | TCGA-Q1-A73O-01 | Cervix | cervical & endocervical cancer | Female | <65 | I/II | Chemotherapy | cisplatin | CR |
| MAGOHB | SNV | Missense_Mutation | novel | c.254T>G | p.Val85Gly | p.V85G | Q96A72 | protein_coding | tolerated(0.22) | benign(0.444) | TCGA-G4-6628-01 | Colorectum | colon adenocarcinoma | Male | >=65 | I/II | Unknown | Unknown | SD |
| MAGOHB | SNV | Missense_Mutation | c.365N>A | p.Arg122Gln | p.R122Q | Q96A72 | protein_coding | tolerated(0.19) | benign(0.065) | TCGA-AG-A002-01 | Colorectum | rectum adenocarcinoma | Male | <65 | I/II | Unknown | Unknown | SD | |
| MAGOHB | SNV | Missense_Mutation | c.335N>C | p.Val112Ala | p.V112A | Q96A72 | protein_coding | deleterious(0.02) | possibly_damaging(0.665) | TCGA-B5-A11E-01 | Endometrium | uterine corpus endometrioid carcinoma | Female | <65 | I/II | Unknown | Unknown | SD | |
| MAGOHB | SNV | Missense_Mutation | rs745448693 | c.10G>A | p.Ala4Thr | p.A4T | Q96A72 | protein_coding | tolerated(0.26) | benign(0) | TCGA-EC-A24G-01 | Endometrium | uterine corpus endometrioid carcinoma | Female | <65 | I/II | Chemotherapy | doxorubicin | SD |
| MAGOHB | SNV | Missense_Mutation | c.323C>A | p.Ser108Tyr | p.S108Y | Q96A72 | protein_coding | deleterious(0.03) | probably_damaging(0.998) | TCGA-EO-A3B0-01 | Endometrium | uterine corpus endometrioid carcinoma | Female | <65 | III/IV | Unknown | Unknown | SD | |
| MAGOHB | SNV | Missense_Mutation | novel | c.95N>T | p.Gly32Val | p.G32V | Q96A72 | protein_coding | deleterious(0) | probably_damaging(0.999) | TCGA-55-8089-01 | Lung | lung adenocarcinoma | Male | <65 | I/II | Unknown | Unknown | SD |
| MAGOHB | SNV | Missense_Mutation | novel | c.41N>T | p.Gly14Val | p.G14V | Q96A72 | protein_coding | deleterious(0) | probably_damaging(0.995) | TCGA-78-7539-01 | Lung | lung adenocarcinoma | Female | >=65 | I/II | Chemotherapy | cisplatin | PD |
| MAGOHB | SNV | Missense_Mutation | c.260N>A | p.Arg87Gln | p.R87Q | Q96A72 | protein_coding | tolerated(0.06) | benign(0.049) | TCGA-BR-4292-01 | Stomach | stomach adenocarcinoma | Female | >=65 | I/II | Unknown | Unknown | SD |
| Page: 1 2 |
Top |
Related drugs of malignant transformation related genes |
| Identification of chemicals and drugs interact with genes involved in malignant transfromation |
| (DGIdb 4.0) |
| Entrez ID | Symbol | Category | Interaction Types | Drug Claim Name | Drug Name | PMIDs |
| Page: 1 |

Copyright 2023-Present -The University of Texas Health Science Center at Houston |