
|
|||||
|
 | |
| |
| |
| |
| |
| |
|
Gene: MAGOH |
Gene summary for MAGOH |
| Gene information | Species | Human | Gene symbol | MAGOH | Gene ID | 4116 |
| Gene name | mago homolog, exon junction complex subunit | |
| Gene Alias | MAGOH1 | |
| Cytomap | 1p32.3 | |
| Gene Type | protein-coding | GO ID | GO:0000184 | UniProtAcc | P61326 |
Top |
Malignant transformation analysis |
| Identification of the aberrant gene expression in precancerous and cancerous lesions by comparing the gene expression of stem-like cells in diseased tissues with normal stem cells |
| Entrez ID | Symbol | Replicates | Species | Organ | Tissue | Adj P-value | Log2FC | Malignancy |
| 4116 | MAGOH | GSM4909282 | Human | Breast | IDC | 1.90e-33 | 7.01e-01 | -0.0288 |
| 4116 | MAGOH | GSM4909285 | Human | Breast | IDC | 9.21e-33 | 6.87e-01 | 0.21 |
| 4116 | MAGOH | GSM4909286 | Human | Breast | IDC | 7.77e-03 | 2.29e-01 | 0.1081 |
| 4116 | MAGOH | GSM4909296 | Human | Breast | IDC | 1.51e-03 | 2.61e-02 | 0.1524 |
| 4116 | MAGOH | GSM4909297 | Human | Breast | IDC | 7.20e-10 | -1.16e-01 | 0.1517 |
| 4116 | MAGOH | GSM4909311 | Human | Breast | IDC | 2.37e-20 | -1.76e-01 | 0.1534 |
| 4116 | MAGOH | GSM4909312 | Human | Breast | IDC | 2.26e-05 | -7.17e-02 | 0.1552 |
| 4116 | MAGOH | GSM4909319 | Human | Breast | IDC | 1.48e-25 | -2.38e-01 | 0.1563 |
| 4116 | MAGOH | GSM4909320 | Human | Breast | IDC | 4.28e-02 | -1.67e-01 | 0.1575 |
| 4116 | MAGOH | GSM4909321 | Human | Breast | IDC | 6.26e-13 | -2.70e-01 | 0.1559 |
| 4116 | MAGOH | brca2 | Human | Breast | Precancer | 1.57e-05 | 2.68e-01 | -0.024 |
| 4116 | MAGOH | NCCBC14 | Human | Breast | DCIS | 2.00e-02 | -4.98e-02 | 0.2021 |
| 4116 | MAGOH | NCCBC5 | Human | Breast | DCIS | 2.95e-07 | 2.03e-01 | 0.2046 |
| 4116 | MAGOH | P1 | Human | Breast | IDC | 1.15e-08 | -1.71e-01 | 0.1527 |
| 4116 | MAGOH | DCIS2 | Human | Breast | DCIS | 1.84e-64 | 1.82e-01 | 0.0085 |
| 4116 | MAGOH | AEH-subject1 | Human | Endometrium | AEH | 1.58e-07 | -2.88e-01 | -0.3059 |
| 4116 | MAGOH | AEH-subject2 | Human | Endometrium | AEH | 2.68e-08 | -2.87e-01 | -0.2525 |
| 4116 | MAGOH | AEH-subject3 | Human | Endometrium | AEH | 3.26e-06 | -1.93e-01 | -0.2576 |
| 4116 | MAGOH | AEH-subject4 | Human | Endometrium | AEH | 4.02e-03 | -2.66e-01 | -0.2657 |
| 4116 | MAGOH | AEH-subject5 | Human | Endometrium | AEH | 3.72e-06 | -2.80e-01 | -0.2953 |
| Page: 1 2 3 4 5 6 7 8 9 |
| Tissue | Expression Dynamics | Abbreviation |
| Breast |  | IDC: Invasive ductal carcinoma |
| DCIS: Ductal carcinoma in situ | ||
| Precancer(BRCA1-mut): Precancerous lesion from BRCA1 mutation carriers | ||
| Endometrium | 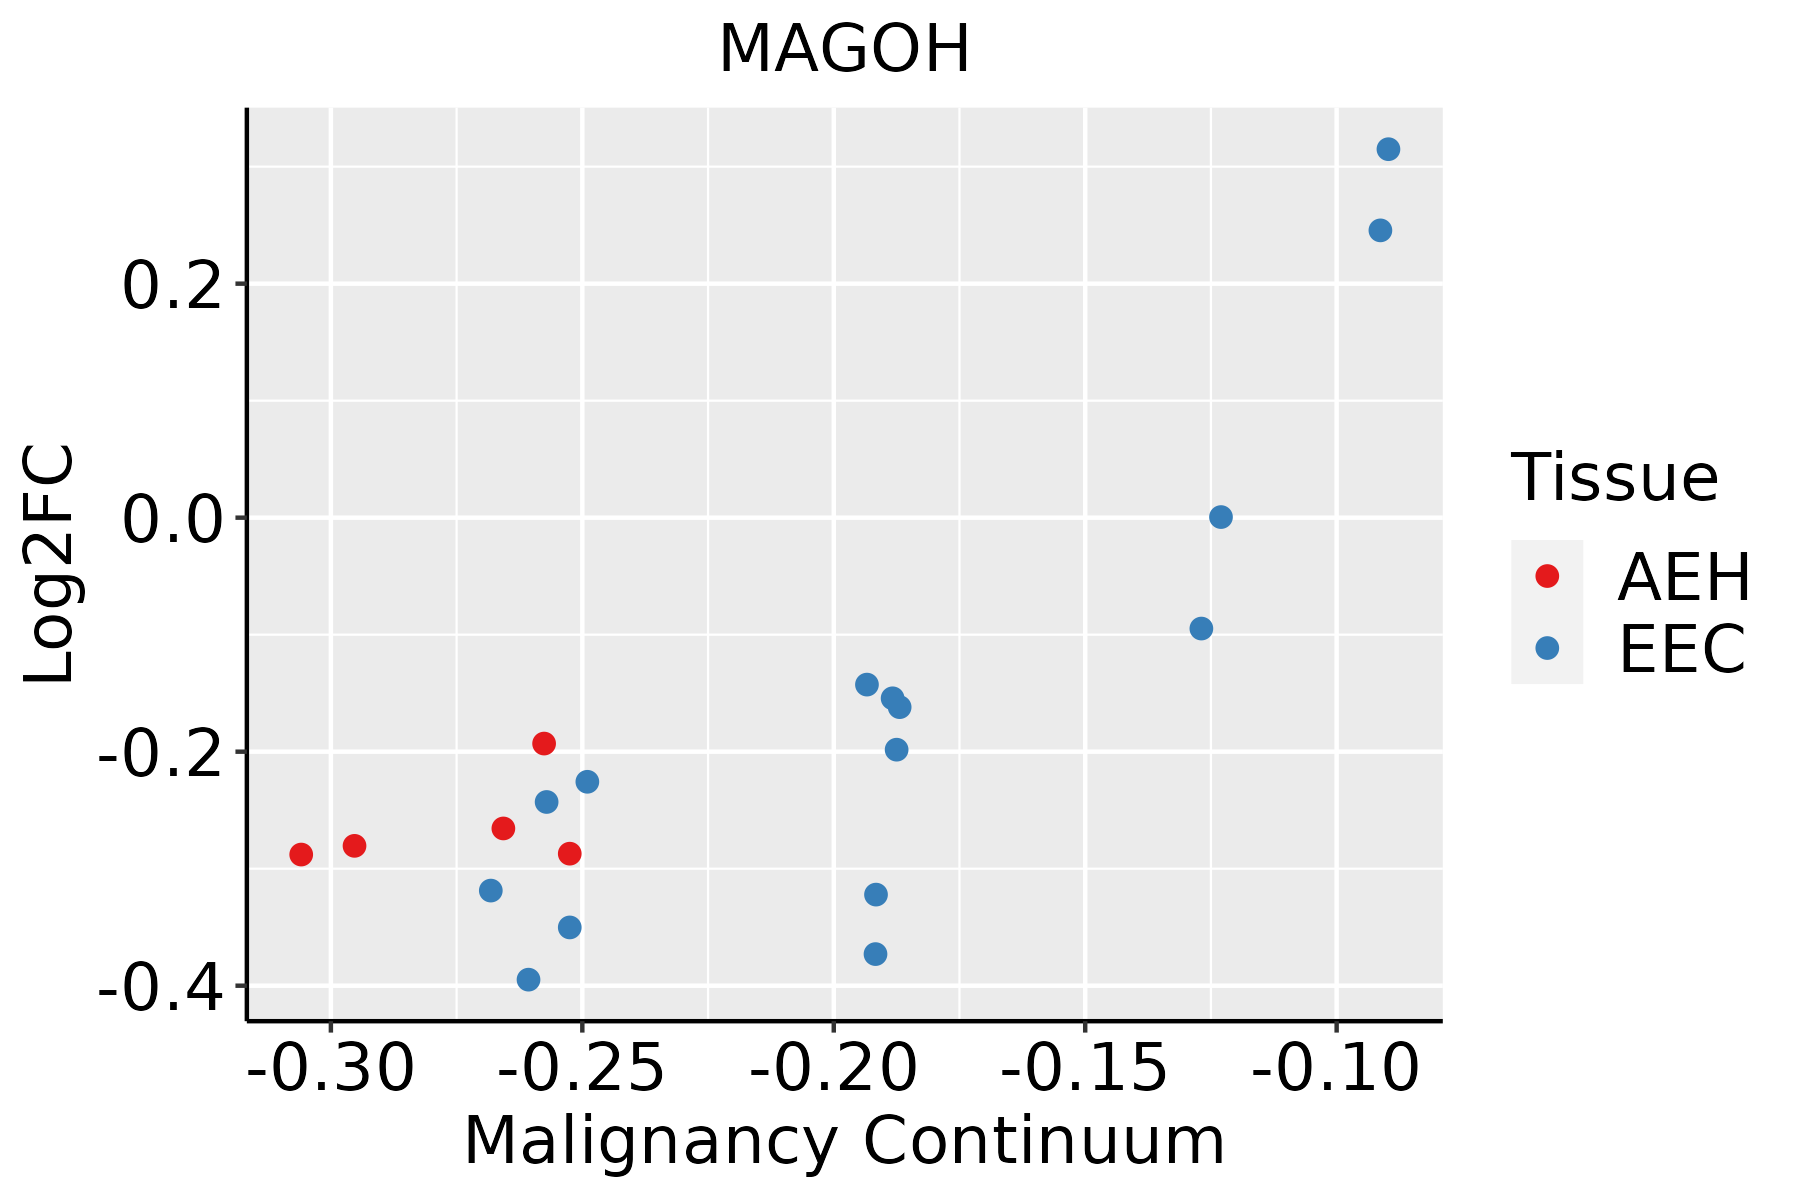 | AEH: Atypical endometrial hyperplasia |
| EEC: Endometrioid Cancer | ||
| Esophagus | 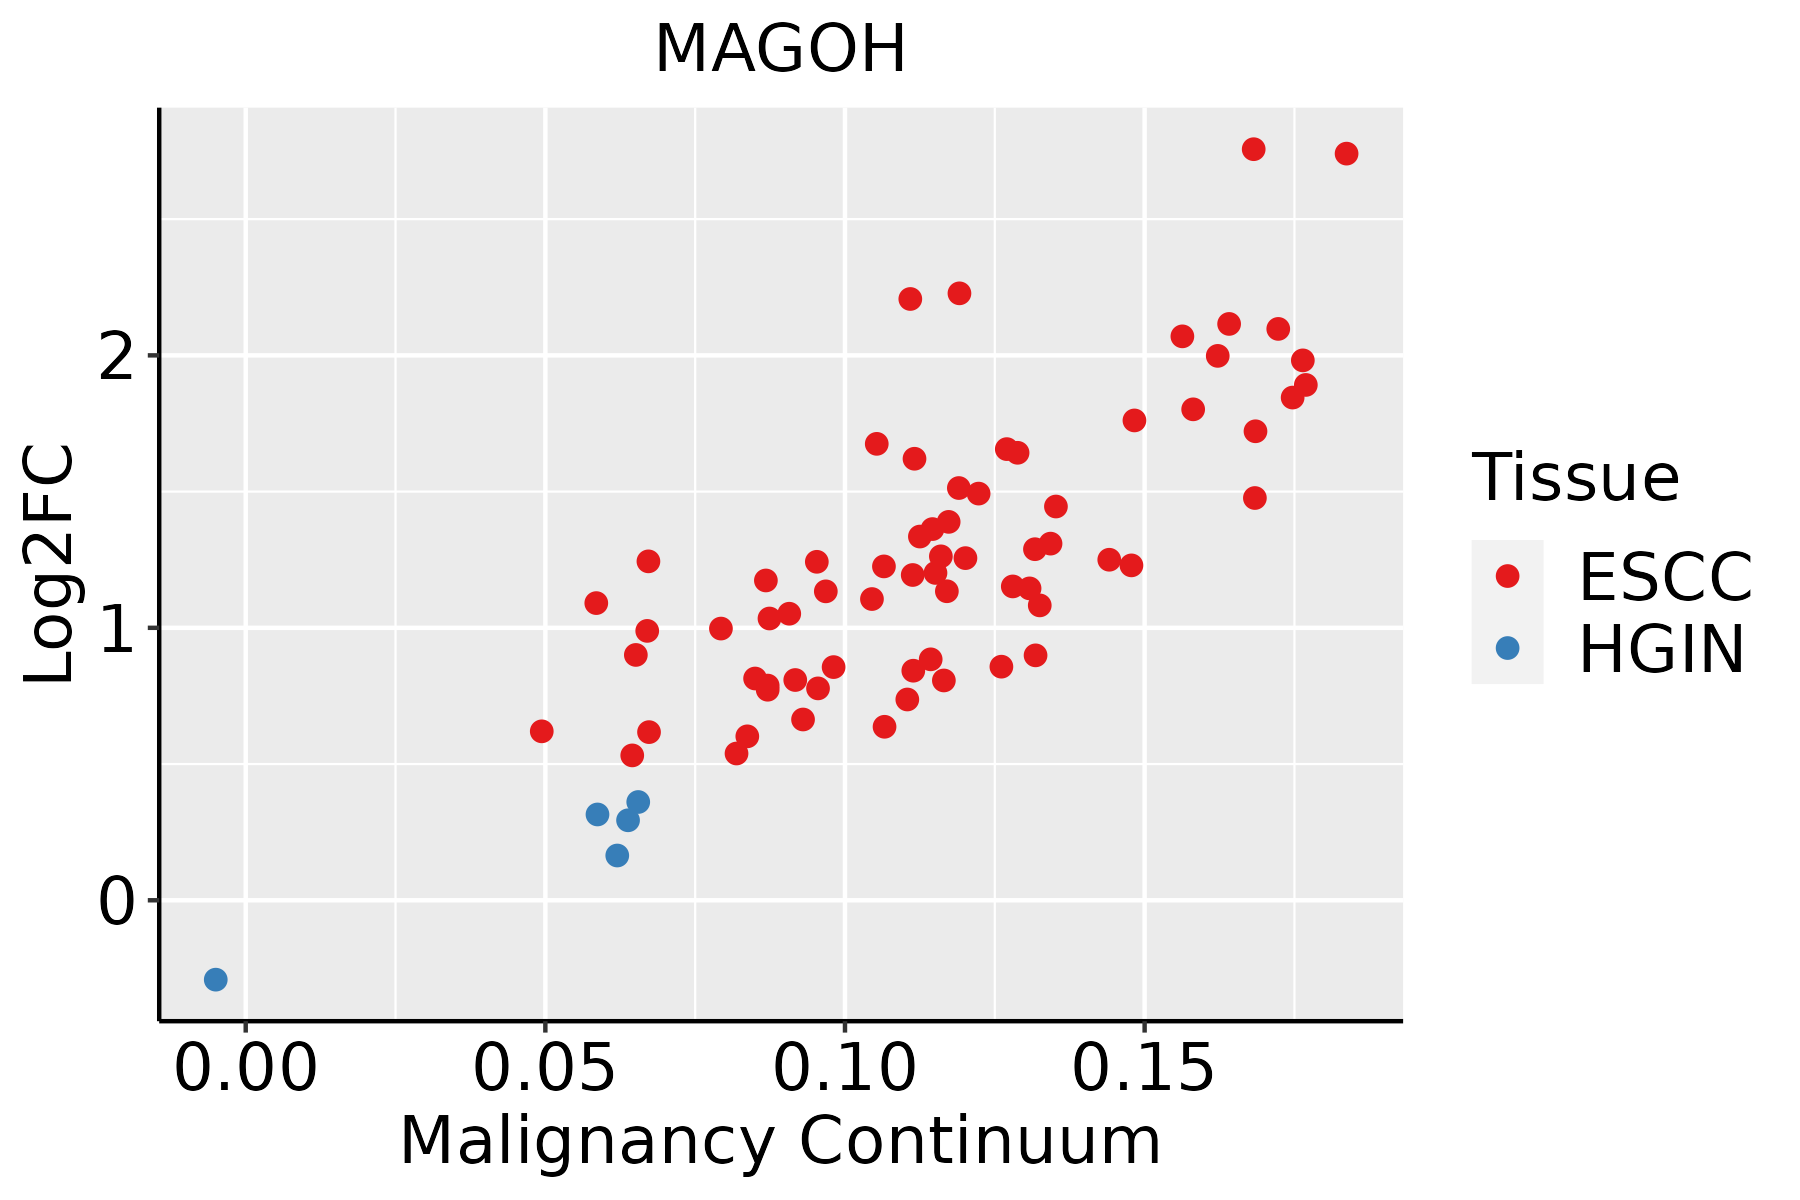 | ESCC: Esophageal squamous cell carcinoma |
| HGIN: High-grade intraepithelial neoplasias | ||
| LGIN: Low-grade intraepithelial neoplasias | ||
| Liver |  | HCC: Hepatocellular carcinoma |
| NAFLD: Non-alcoholic fatty liver disease | ||
| Oral Cavity | 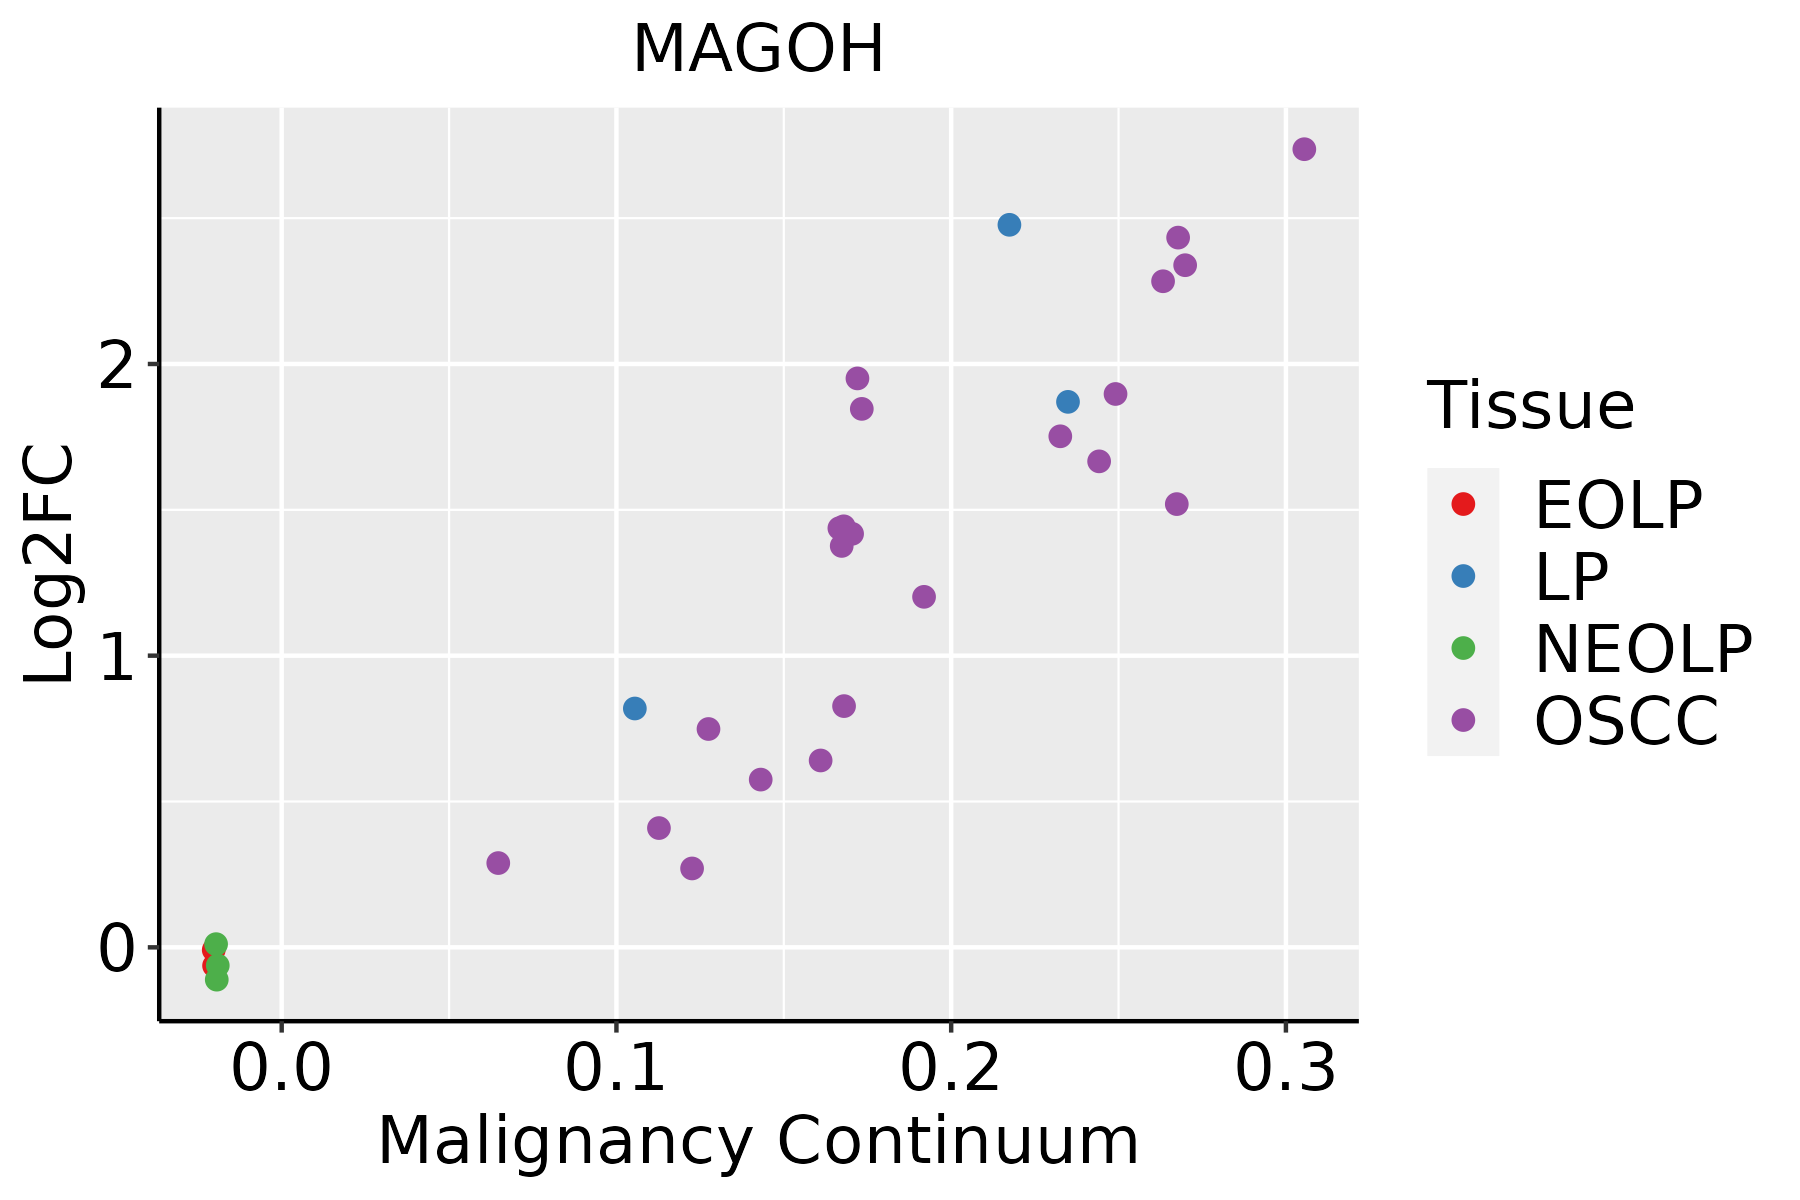 | EOLP: Erosive Oral lichen planus |
| LP: leukoplakia | ||
| NEOLP: Non-erosive oral lichen planus | ||
| OSCC: Oral squamous cell carcinoma | ||
| Skin | 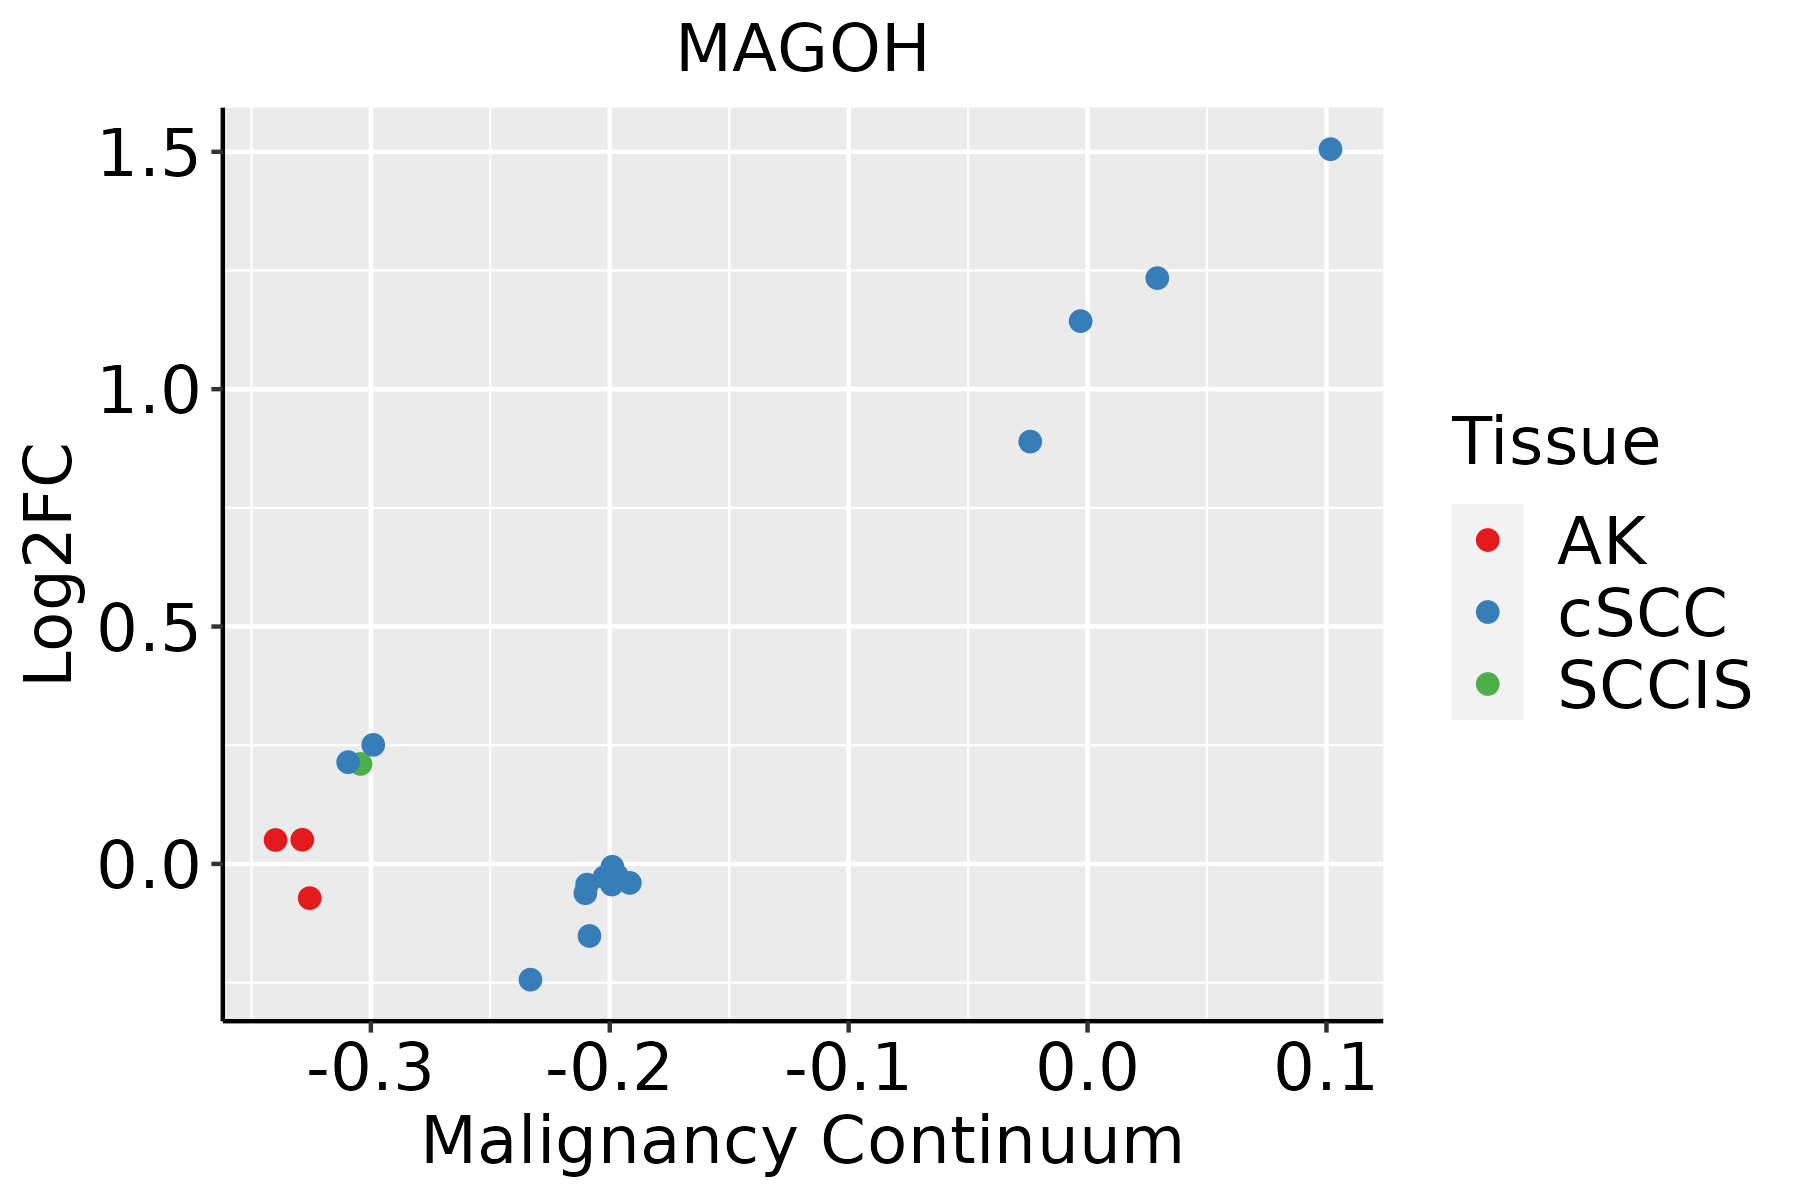 | AK: Actinic keratosis |
| cSCC: Cutaneous squamous cell carcinoma | ||
| SCCIS:squamous cell carcinoma in situ | ||
| Thyroid |  | ATC: Anaplastic thyroid cancer |
| HT: Hashimoto's thyroiditis | ||
| PTC: Papillary thyroid cancer |
| ∗log2FC in expression of this searched gene in stem-like cells from each diseased tissue sample relative to stem-like cells in normal samples in each tissue plotted against the malignancy continuum. Samples are colored based on if they are from different disease stage. |
Top |
Malignant transformation related pathway analysis |
| Find out the enriched GO biological processes and KEGG pathways involved in transition from healthy to precancer to cancer |
| Tissue | Disease Stage | Enriched GO biological Processes |
| Colorectum | AD |  |
| Colorectum | SER |  |
| Colorectum | MSS |  |
| Colorectum | MSI-H |  |
| Colorectum | FAP |  |
| ∗Top 15 enriched GO BP terms are showed in the bar plot of each disease state in each tissue. Each row represents a significant GO biological process which is colored according to the -log10(p.adjust). |
| Page: 1 2 3 4 5 6 7 8 9 |
| GO ID | Tissue | Disease Stage | Description | Gene Ratio | Bg Ratio | pvalue | p.adjust | Count |
| GO:00083809 | Breast | Precancer | RNA splicing | 65/1080 | 434/18723 | 1.27e-12 | 2.53e-10 | 65 |
| GO:00434849 | Breast | Precancer | regulation of RNA splicing | 34/1080 | 148/18723 | 2.66e-12 | 4.75e-10 | 34 |
| GO:00064179 | Breast | Precancer | regulation of translation | 67/1080 | 468/18723 | 4.71e-12 | 7.64e-10 | 67 |
| GO:00003759 | Breast | Precancer | RNA splicing, via transesterification reactions | 52/1080 | 324/18723 | 1.74e-11 | 2.22e-09 | 52 |
| GO:00003779 | Breast | Precancer | RNA splicing, via transesterification reactions with bulged adenosine as nucleophile | 51/1080 | 320/18723 | 3.55e-11 | 4.04e-09 | 51 |
| GO:00003989 | Breast | Precancer | mRNA splicing, via spliceosome | 51/1080 | 320/18723 | 3.55e-11 | 4.04e-09 | 51 |
| GO:00480249 | Breast | Precancer | regulation of mRNA splicing, via spliceosome | 22/1080 | 101/18723 | 5.29e-08 | 3.18e-06 | 22 |
| GO:19033118 | Breast | Precancer | regulation of mRNA metabolic process | 38/1080 | 288/18723 | 1.63e-06 | 5.97e-05 | 38 |
| GO:00506848 | Breast | Precancer | regulation of mRNA processing | 23/1080 | 137/18723 | 3.49e-06 | 1.13e-04 | 23 |
| GO:00064028 | Breast | Precancer | mRNA catabolic process | 31/1080 | 232/18723 | 1.12e-05 | 2.93e-04 | 31 |
| GO:00003808 | Breast | Precancer | alternative mRNA splicing, via spliceosome | 15/1080 | 77/18723 | 2.86e-05 | 6.37e-04 | 15 |
| GO:00064018 | Breast | Precancer | RNA catabolic process | 34/1080 | 278/18723 | 2.88e-05 | 6.39e-04 | 34 |
| GO:00003818 | Breast | Precancer | regulation of alternative mRNA splicing, via spliceosome | 13/1080 | 60/18723 | 2.98e-05 | 6.58e-04 | 13 |
| GO:00346558 | Breast | Precancer | nucleobase-containing compound catabolic process | 42/1080 | 407/18723 | 1.91e-04 | 3.06e-03 | 42 |
| GO:00467007 | Breast | Precancer | heterocycle catabolic process | 44/1080 | 445/18723 | 3.49e-04 | 4.88e-03 | 44 |
| GO:00442708 | Breast | Precancer | cellular nitrogen compound catabolic process | 44/1080 | 451/18723 | 4.64e-04 | 6.12e-03 | 44 |
| GO:00009566 | Breast | Precancer | nuclear-transcribed mRNA catabolic process | 16/1080 | 112/18723 | 6.87e-04 | 8.36e-03 | 16 |
| GO:00194397 | Breast | Precancer | aromatic compound catabolic process | 44/1080 | 467/18723 | 9.55e-04 | 1.07e-02 | 44 |
| GO:00064039 | Breast | Precancer | RNA localization | 23/1080 | 201/18723 | 1.34e-03 | 1.41e-02 | 23 |
| GO:19013617 | Breast | Precancer | organic cyclic compound catabolic process | 45/1080 | 495/18723 | 1.73e-03 | 1.74e-02 | 45 |
| Page: 1 2 3 4 5 6 7 8 9 10 11 12 13 14 15 16 17 18 19 |
| Pathway ID | Tissue | Disease Stage | Description | Gene Ratio | Bg Ratio | pvalue | p.adjust | qvalue | Count |
| hsa030408 | Breast | Precancer | Spliceosome | 39/684 | 217/8465 | 1.44e-06 | 2.27e-05 | 1.74e-05 | 39 |
| hsa0304013 | Breast | Precancer | Spliceosome | 39/684 | 217/8465 | 1.44e-06 | 2.27e-05 | 1.74e-05 | 39 |
| hsa0304023 | Breast | IDC | Spliceosome | 40/867 | 217/8465 | 1.53e-04 | 1.42e-03 | 1.06e-03 | 40 |
| hsa0304033 | Breast | IDC | Spliceosome | 40/867 | 217/8465 | 1.53e-04 | 1.42e-03 | 1.06e-03 | 40 |
| hsa0304043 | Breast | DCIS | Spliceosome | 40/846 | 217/8465 | 8.97e-05 | 8.52e-04 | 6.28e-04 | 40 |
| hsa0304053 | Breast | DCIS | Spliceosome | 40/846 | 217/8465 | 8.97e-05 | 8.52e-04 | 6.28e-04 | 40 |
| hsa030409 | Endometrium | AEH | Spliceosome | 54/1197 | 217/8465 | 1.47e-05 | 1.65e-04 | 1.21e-04 | 54 |
| hsa0304014 | Endometrium | AEH | Spliceosome | 54/1197 | 217/8465 | 1.47e-05 | 1.65e-04 | 1.21e-04 | 54 |
| hsa0304024 | Endometrium | EEC | Spliceosome | 54/1237 | 217/8465 | 3.78e-05 | 3.88e-04 | 2.89e-04 | 54 |
| hsa0304034 | Endometrium | EEC | Spliceosome | 54/1237 | 217/8465 | 3.78e-05 | 3.88e-04 | 2.89e-04 | 54 |
| hsa0304018 | Esophagus | HGIN | Spliceosome | 79/1383 | 217/8465 | 3.22e-13 | 7.00e-12 | 5.56e-12 | 79 |
| hsa030159 | Esophagus | HGIN | mRNA surveillance pathway | 30/1383 | 97/8465 | 2.48e-04 | 2.69e-03 | 2.14e-03 | 30 |
| hsa030137 | Esophagus | HGIN | Nucleocytoplasmic transport | 31/1383 | 108/8465 | 8.29e-04 | 7.95e-03 | 6.31e-03 | 31 |
| hsa0304019 | Esophagus | HGIN | Spliceosome | 79/1383 | 217/8465 | 3.22e-13 | 7.00e-12 | 5.56e-12 | 79 |
| hsa0301514 | Esophagus | HGIN | mRNA surveillance pathway | 30/1383 | 97/8465 | 2.48e-04 | 2.69e-03 | 2.14e-03 | 30 |
| hsa0301312 | Esophagus | HGIN | Nucleocytoplasmic transport | 31/1383 | 108/8465 | 8.29e-04 | 7.95e-03 | 6.31e-03 | 31 |
| hsa0301321 | Esophagus | ESCC | Nucleocytoplasmic transport | 89/4205 | 108/8465 | 1.20e-12 | 2.37e-11 | 1.21e-11 | 89 |
| hsa0301524 | Esophagus | ESCC | mRNA surveillance pathway | 72/4205 | 97/8465 | 6.12e-07 | 4.10e-06 | 2.10e-06 | 72 |
| hsa0304027 | Esophagus | ESCC | Spliceosome | 128/4205 | 217/8465 | 3.31e-03 | 8.79e-03 | 4.50e-03 | 128 |
| hsa0301331 | Esophagus | ESCC | Nucleocytoplasmic transport | 89/4205 | 108/8465 | 1.20e-12 | 2.37e-11 | 1.21e-11 | 89 |
| Page: 1 2 3 |
Top |
Cell-cell communication analysis |
| Identification of potential cell-cell interactions between two cell types and their ligand-receptor pairs for different disease states |
| Ligand | Receptor | LRpair | Pathway | Tissue | Disease Stage |
| Page: 1 |
Top |
Single-cell gene regulatory network inference analysis |
| Find out the significant the regulons (TFs) and the target genes of each regulon across cell types for different disease states |
| TF | Cell Type | Tissue | Disease Stage | Target Gene | RSS | Regulon Activity |
| ∗The dot plots of a searched regulon are shown for all cell subpopulations in each disease state of each tissue based on the regulon specific score inferred using pySCENIC and by calculating the average expression. |
| Page: 1 |
Top |
Somatic mutation of malignant transformation related genes |
| Annotation of somatic variants for genes involved in malignant transformation |
| Hugo Symbol | Variant Class | Variant Classification | dbSNP RS | HGVSc | HGVSp | HGVSp Short | SWISSPROT | BIOTYPE | SIFT | PolyPhen | Tumor Sample Barcode | Tissue | Histology | Sex | Age | Stage | Therapy Types | Drugs | Outcome |
| MAGOH | SNV | Missense_Mutation | c.280G>A | p.Asp94Asn | p.D94N | P61326 | protein_coding | tolerated(1) | benign(0.005) | TCGA-IR-A3LK-01 | Cervix | cervical & endocervical cancer | Female | >=65 | I/II | Chemotherapy | cisplatin | PD | |
| MAGOH | SNV | Missense_Mutation | c.185G>T | p.Arg62Ile | p.R62I | P61326 | protein_coding | deleterious(0.03) | possibly_damaging(0.88) | TCGA-A5-A1OF-01 | Endometrium | uterine corpus endometrioid carcinoma | Female | <65 | I/II | Unknown | Unknown | SD | |
| MAGOH | SNV | Missense_Mutation | c.196G>A | p.Asp66Asn | p.D66N | P61326 | protein_coding | deleterious(0.01) | benign(0.071) | TCGA-B5-A11E-01 | Endometrium | uterine corpus endometrioid carcinoma | Female | <65 | I/II | Unknown | Unknown | SD | |
| MAGOH | SNV | Missense_Mutation | c.293N>A | p.Ser98Tyr | p.S98Y | P61326 | protein_coding | deleterious(0.02) | benign(0.153) | TCGA-BS-A0UF-01 | Endometrium | uterine corpus endometrioid carcinoma | Female | >=65 | I/II | Unknown | Unknown | SD | |
| MAGOH | SNV | Missense_Mutation | rs749229462 | c.271N>A | p.Val91Ile | p.V91I | P61326 | protein_coding | tolerated(0.33) | benign(0.023) | TCGA-EY-A549-01 | Endometrium | uterine corpus endometrioid carcinoma | Female | >=65 | I/II | Unknown | Unknown | SD |
| MAGOH | SNV | Missense_Mutation | c.185N>C | p.Arg62Thr | p.R62T | P61326 | protein_coding | deleterious(0.02) | possibly_damaging(0.851) | TCGA-78-7150-01 | Lung | lung adenocarcinoma | Male | <65 | I/II | Chemotherapy | carboplatin | PD | |
| MAGOH | SNV | Missense_Mutation | novel | c.183G>C | p.Lys61Asn | p.K61N | P61326 | protein_coding | deleterious(0) | possibly_damaging(0.733) | TCGA-92-7340-01 | Lung | lung squamous cell carcinoma | Female | <65 | I/II | Chemotherapy | cisplatin | SD |
| MAGOH | SNV | Missense_Mutation | novel | c.265N>A | p.Glu89Lys | p.E89K | P61326 | protein_coding | deleterious(0) | probably_damaging(0.984) | TCGA-CV-A6JM-01 | Oral cavity | head & neck squamous cell carcinoma | Male | >=65 | I/II | Unknown | Unknown | PD |
| MAGOH | SNV | Missense_Mutation | c.373C>G | p.Leu125Val | p.L125V | P61326 | protein_coding | deleterious(0.02) | probably_damaging(0.927) | TCGA-HU-8249-01 | Stomach | stomach adenocarcinoma | Male | >=65 | III/IV | Chemotherapy | xeloda | CR |
| Page: 1 |
Top |
Related drugs of malignant transformation related genes |
| Identification of chemicals and drugs interact with genes involved in malignant transfromation |
| (DGIdb 4.0) |
| Entrez ID | Symbol | Category | Interaction Types | Drug Claim Name | Drug Name | PMIDs |
| Page: 1 |

Copyright 2023-Present -The University of Texas Health Science Center at Houston |