
|
|||||
|
 | |
| |
| |
| |
| |
| |
|
Gene: MAGIX |
Gene summary for MAGIX |
| Gene information | Species | Human | Gene symbol | MAGIX | Gene ID | 79917 |
| Gene name | MAGI family member, X-linked | |
| Gene Alias | JM10 | |
| Cytomap | Xp11.23 | |
| Gene Type | protein-coding | GO ID | NA | UniProtAcc | A0A087WUY6 |
Top |
Malignant transformation analysis |
| Identification of the aberrant gene expression in precancerous and cancerous lesions by comparing the gene expression of stem-like cells in diseased tissues with normal stem cells |
| Entrez ID | Symbol | Replicates | Species | Organ | Tissue | Adj P-value | Log2FC | Malignancy |
| 79917 | MAGIX | LZE5T | Human | Esophagus | ESCC | 5.74e-03 | 2.53e-01 | 0.0514 |
| 79917 | MAGIX | LZE20T | Human | Esophagus | ESCC | 1.25e-05 | 1.70e-01 | 0.0662 |
| 79917 | MAGIX | P1T-E | Human | Esophagus | ESCC | 1.07e-09 | 6.83e-01 | 0.0875 |
| 79917 | MAGIX | P2T-E | Human | Esophagus | ESCC | 6.00e-10 | 9.79e-02 | 0.1177 |
| 79917 | MAGIX | P4T-E | Human | Esophagus | ESCC | 2.20e-12 | 2.95e-01 | 0.1323 |
| 79917 | MAGIX | P8T-E | Human | Esophagus | ESCC | 6.64e-08 | 1.95e-01 | 0.0889 |
| 79917 | MAGIX | P9T-E | Human | Esophagus | ESCC | 2.08e-04 | 7.39e-02 | 0.1131 |
| 79917 | MAGIX | P15T-E | Human | Esophagus | ESCC | 4.52e-08 | 9.57e-02 | 0.1149 |
| 79917 | MAGIX | P16T-E | Human | Esophagus | ESCC | 1.40e-05 | 1.04e-01 | 0.1153 |
| 79917 | MAGIX | P20T-E | Human | Esophagus | ESCC | 5.51e-06 | 1.32e-01 | 0.1124 |
| 79917 | MAGIX | P22T-E | Human | Esophagus | ESCC | 3.82e-15 | 2.90e-01 | 0.1236 |
| 79917 | MAGIX | P23T-E | Human | Esophagus | ESCC | 7.64e-16 | 3.98e-01 | 0.108 |
| 79917 | MAGIX | P26T-E | Human | Esophagus | ESCC | 5.39e-12 | 2.39e-01 | 0.1276 |
| 79917 | MAGIX | P27T-E | Human | Esophagus | ESCC | 1.03e-14 | 4.22e-01 | 0.1055 |
| 79917 | MAGIX | P28T-E | Human | Esophagus | ESCC | 7.36e-05 | 6.89e-02 | 0.1149 |
| 79917 | MAGIX | P36T-E | Human | Esophagus | ESCC | 5.98e-05 | 1.81e-01 | 0.1187 |
| 79917 | MAGIX | P37T-E | Human | Esophagus | ESCC | 1.51e-04 | 5.47e-02 | 0.1371 |
| 79917 | MAGIX | P42T-E | Human | Esophagus | ESCC | 2.60e-04 | 9.05e-02 | 0.1175 |
| 79917 | MAGIX | P48T-E | Human | Esophagus | ESCC | 6.78e-08 | 2.39e-01 | 0.0959 |
| 79917 | MAGIX | P54T-E | Human | Esophagus | ESCC | 6.19e-11 | 3.14e-01 | 0.0975 |
| Page: 1 2 3 |
| Tissue | Expression Dynamics | Abbreviation |
| Esophagus | 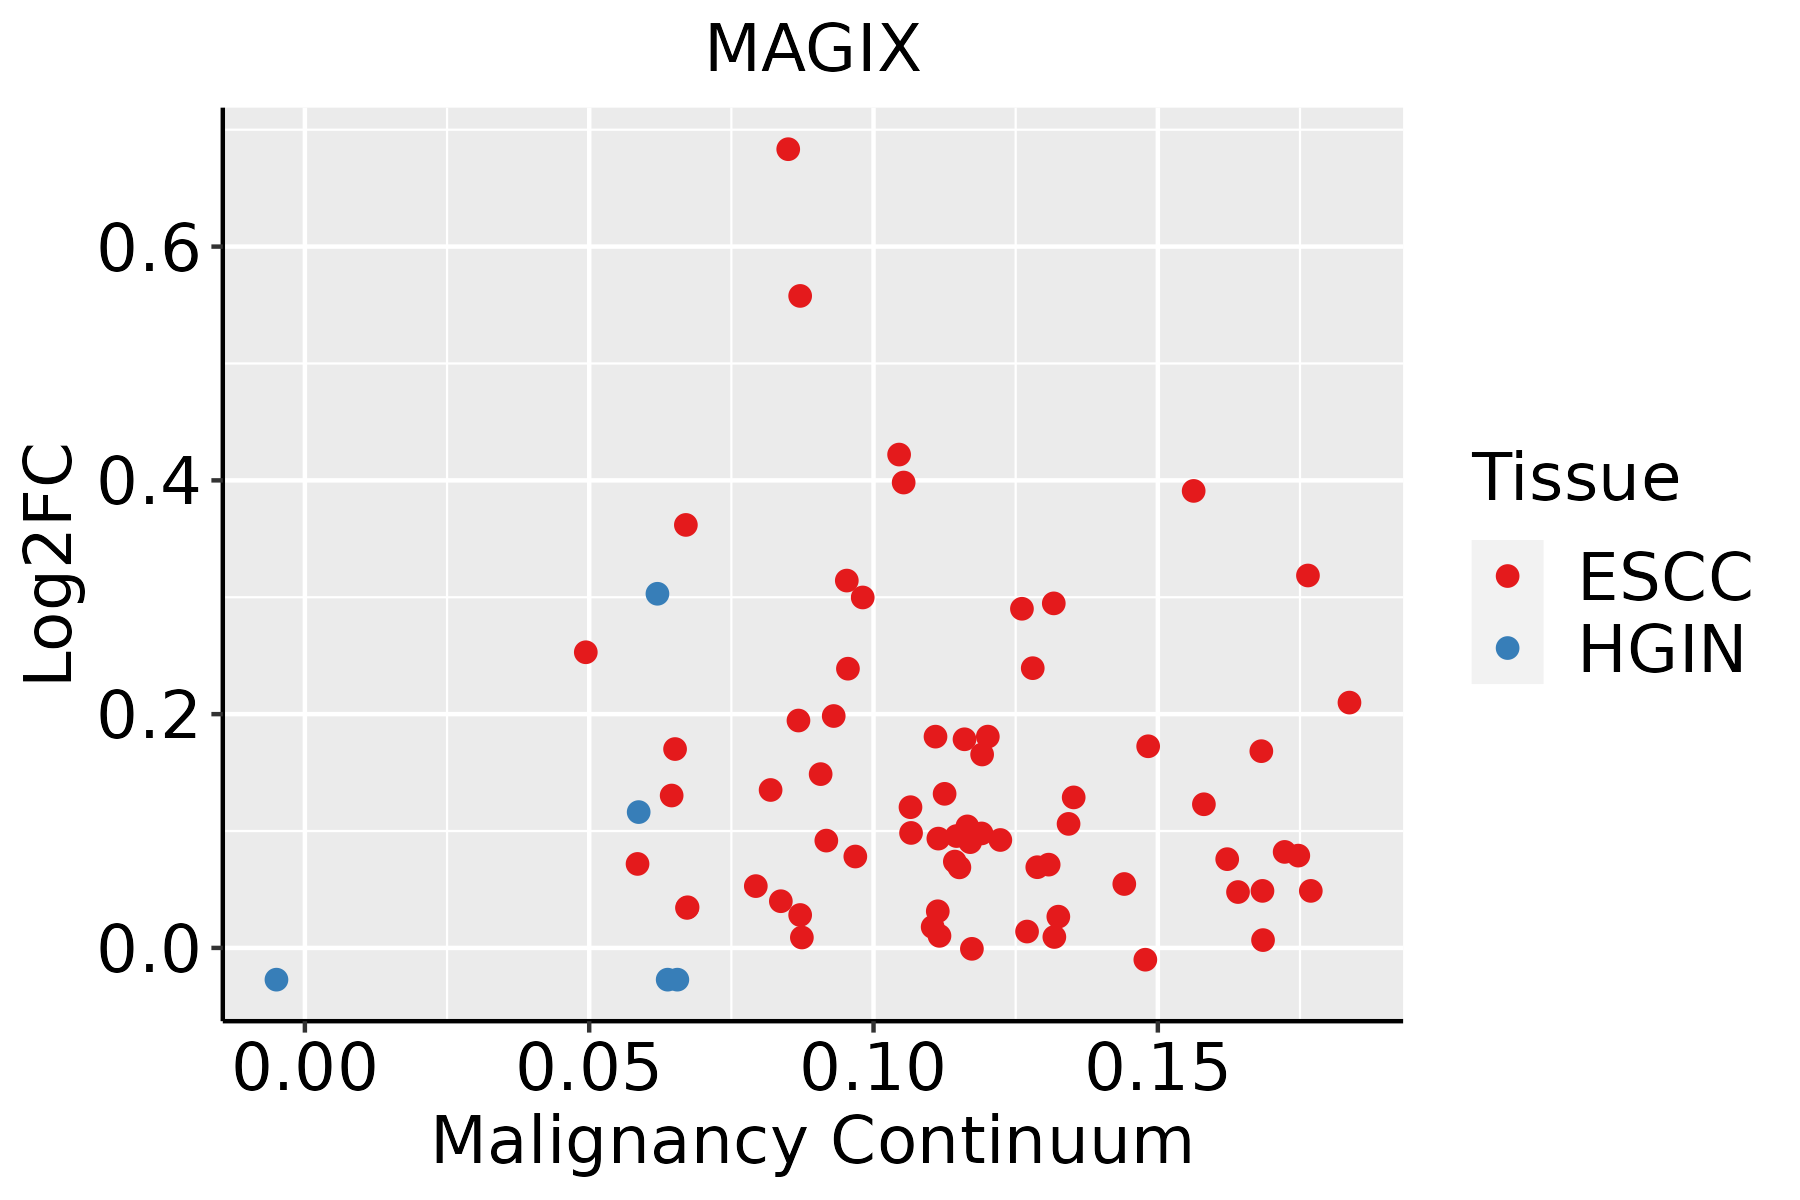 | ESCC: Esophageal squamous cell carcinoma |
| HGIN: High-grade intraepithelial neoplasias | ||
| LGIN: Low-grade intraepithelial neoplasias | ||
| Liver |  | HCC: Hepatocellular carcinoma |
| NAFLD: Non-alcoholic fatty liver disease |
| ∗log2FC in expression of this searched gene in stem-like cells from each diseased tissue sample relative to stem-like cells in normal samples in each tissue plotted against the malignancy continuum. Samples are colored based on if they are from different disease stage. |
Top |
Malignant transformation related pathway analysis |
| Find out the enriched GO biological processes and KEGG pathways involved in transition from healthy to precancer to cancer |
| Tissue | Disease Stage | Enriched GO biological Processes |
| Colorectum | AD |  |
| Colorectum | SER |  |
| Colorectum | MSS |  |
| Colorectum | MSI-H |  |
| Colorectum | FAP |  |
| ∗Top 15 enriched GO BP terms are showed in the bar plot of each disease state in each tissue. Each row represents a significant GO biological process which is colored according to the -log10(p.adjust). |
| Page: 1 2 3 4 5 6 7 8 9 |
| GO ID | Tissue | Disease Stage | Description | Gene Ratio | Bg Ratio | pvalue | p.adjust | Count |
| Page: 1 |
| Pathway ID | Tissue | Disease Stage | Description | Gene Ratio | Bg Ratio | pvalue | p.adjust | qvalue | Count |
| Page: 1 |
Top |
Cell-cell communication analysis |
| Identification of potential cell-cell interactions between two cell types and their ligand-receptor pairs for different disease states |
| Ligand | Receptor | LRpair | Pathway | Tissue | Disease Stage |
| Page: 1 |
Top |
Single-cell gene regulatory network inference analysis |
| Find out the significant the regulons (TFs) and the target genes of each regulon across cell types for different disease states |
| TF | Cell Type | Tissue | Disease Stage | Target Gene | RSS | Regulon Activity |
| ∗The dot plots of a searched regulon are shown for all cell subpopulations in each disease state of each tissue based on the regulon specific score inferred using pySCENIC and by calculating the average expression. |
| Page: 1 |
Top |
Somatic mutation of malignant transformation related genes |
| Annotation of somatic variants for genes involved in malignant transformation |
| Hugo Symbol | Variant Class | Variant Classification | dbSNP RS | HGVSc | HGVSp | HGVSp Short | SWISSPROT | BIOTYPE | SIFT | PolyPhen | Tumor Sample Barcode | Tissue | Histology | Sex | Age | Stage | Therapy Types | Drugs | Outcome |
| MAGIX | SNV | Missense_Mutation | rs782468533 | c.616N>T | p.Arg206Cys | p.R206C | protein_coding | tolerated(0.25) | possibly_damaging(0.862) | TCGA-BH-A18G-01 | Breast | breast invasive carcinoma | Female | >=65 | I/II | Unknown | Unknown | SD | |
| MAGIX | SNV | Missense_Mutation | novel | c.896C>T | p.Ser299Phe | p.S299F | protein_coding | deleterious(0.03) | probably_damaging(0.994) | TCGA-PE-A5DE-01 | Breast | breast invasive carcinoma | Female | <65 | I/II | Chemotherapy | taxotere | CR | |
| MAGIX | SNV | Missense_Mutation | c.842N>T | p.Thr281Met | p.T281M | protein_coding | tolerated(0.06) | possibly_damaging(0.695) | TCGA-IR-A3LK-01 | Cervix | cervical & endocervical cancer | Female | >=65 | I/II | Chemotherapy | cisplatin | PD | ||
| MAGIX | SNV | Missense_Mutation | novel | c.31C>A | p.Pro11Thr | p.P11T | protein_coding | deleterious_low_confidence(0.01) | possibly_damaging(0.801) | TCGA-VS-A9U5-01 | Cervix | cervical & endocervical cancer | Female | <65 | I/II | Chemotherapy | cisplatin | CR | |
| MAGIX | SNV | Missense_Mutation | novel | c.242N>A | p.Arg81His | p.R81H | protein_coding | tolerated(0.11) | probably_damaging(0.993) | TCGA-A6-5665-01 | Colorectum | colon adenocarcinoma | Female | >=65 | I/II | Unknown | Unknown | PD | |
| MAGIX | SNV | Missense_Mutation | c.451N>G | p.Leu151Val | p.L151V | protein_coding | deleterious(0.03) | possibly_damaging(0.64) | TCGA-AA-3685-01 | Colorectum | colon adenocarcinoma | Male | >=65 | I/II | Unknown | Unknown | SD | ||
| MAGIX | SNV | Missense_Mutation | c.304N>A | p.Ala102Thr | p.A102T | protein_coding | tolerated(0.64) | benign(0.221) | TCGA-AA-3833-01 | Colorectum | colon adenocarcinoma | Female | <65 | I/II | Unknown | Unknown | SD | ||
| MAGIX | SNV | Missense_Mutation | c.304N>A | p.Ala102Thr | p.A102T | protein_coding | tolerated(0.64) | benign(0.221) | TCGA-CK-4951-01 | Colorectum | colon adenocarcinoma | Female | >=65 | I/II | Unknown | Unknown | PD | ||
| MAGIX | SNV | Missense_Mutation | rs782582267 | c.457G>A | p.Val153Met | p.V153M | protein_coding | deleterious(0) | probably_damaging(0.998) | TCGA-WS-AB45-01 | Colorectum | colon adenocarcinoma | Female | <65 | I/II | Unknown | Unknown | SD | |
| MAGIX | SNV | Missense_Mutation | c.824N>T | p.Ala275Val | p.A275V | protein_coding | tolerated(0.06) | possibly_damaging(0.581) | TCGA-CL-4957-01 | Colorectum | rectum adenocarcinoma | Female | >=65 | III/IV | Chemotherapy | oxaliplatin | SD |
| Page: 1 2 3 4 5 |
Top |
Related drugs of malignant transformation related genes |
| Identification of chemicals and drugs interact with genes involved in malignant transfromation |
| (DGIdb 4.0) |
| Entrez ID | Symbol | Category | Interaction Types | Drug Claim Name | Drug Name | PMIDs |
| Page: 1 |

Copyright 2023-Present -The University of Texas Health Science Center at Houston |